Touch Screen Market Analysis APAC, North America, Europe, South America, Middle East and Africa - US, China, Japan, India, Germany - Size and Forecast 2024-2028

Touch Screen Market Analysis APAC, North America, Europe, South America, Middle East and Africa - US, China, Japan, India, Germany - Size and Forecast 2024-2028

Published: Apr 2024 168 Pages SKU: IRTNTR71031

Market Overview at a Glance

$17.23 B
Market Opportunity
5.26%
CAGR
4.46
YoY growth 2023-2024(%)

Touch Screen Market Size 2024-2028

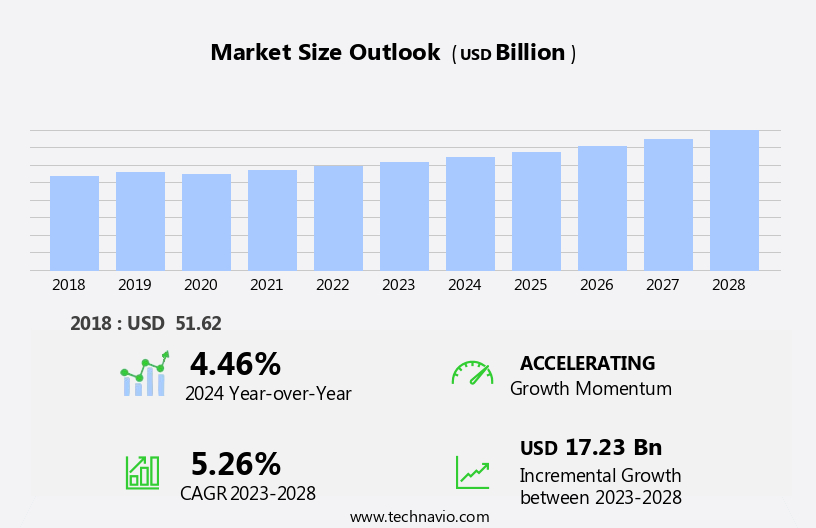
The touch screen market size is forecast to increase by USD 17.23 billion, at a CAGR of 5.26% between 2023 and 2028.

  • The market is witnessing significant growth, driven by the increasing adoption of smart homes and the rising preference for flexible displays and foldable displays. These trends reflect the evolving consumer demand for advanced technology and convenience in various applications. However, the market faces a notable challenge: the high cost of production of touch screen displays. This obstacle may limit the market's expansion and necessitates continuous innovation and cost reduction strategies from industry players.
  • Companies seeking to capitalize on the market's opportunities must focus on delivering cost-effective touch screen solutions while addressing the growing consumer demand for advanced and versatile displays. Adapting to these dynamics will be crucial for companies aiming to maintain a competitive edge in the market.

What will be the Size of the Touch Screen Market during the forecast period?

Touch Screen Market Size

Explore in-depth regional segment analysis with market size data - historical 2018-2022 and forecasts 2024-2028 - in the full report.  
Request Free Sample

The market continues to evolve, with innovative technologies and applications unfolding across various sectors. Interactive whiteboards enable collaborative workspaces, while automotive displays enhance vehicle infotainment systems. Touchscreen overlays offer customization options for existing displays, and touchscreen patents drive industry advancements. Touchscreen research and development are ongoing, with a focus on improving touchscreen sensitivity, response time, and size. Capacitive touchscreens and multi-touch technology have revolutionized user experience, while touchscreen digitizers ensure accurate input. Touchscreen applications extend beyond consumer electronics to medical devices, air traffic control, industrial automation, and military applications. Touchscreen certifications and standards ensure safety and reliability, while touchscreen firmware and drivers optimize performance.

Touchscreen market forecasts indicate continued growth, driven by advancements in touchscreen technology and increasing demand for interactive displays. Wearable devices, gaming consoles, and mobile devices are key markets, with touchscreen innovation leading to new applications and customization options. Touchscreen durability and security are critical considerations, with touchscreen calibration ensuring accurate touchscreen response. Touchscreen resolution and accessibility are also essential factors, as the market adapts to diverse user needs. Projected capacitive touchscreens and optical touchscreens offer different advantages, with the former providing high sensitivity and the latter offering affordability and durability. The touchscreen supply chain is complex, with various players involved in manufacturing, design, and distribution.

Touchscreen trends include the integration of touchscreen technology into new applications, such as smart home appliances and retail displays. Touchscreen customization and touchscreen privacy are also becoming increasingly important, with touchscreen input and touchscreen privacy concerns shaping market dynamics. Overall, the market is a dynamic and evolving landscape, with ongoing research, development, and innovation driving growth and expansion across various sectors.

How is this Touch Screen Industry segmented?

The touch screen industry research report provides comprehensive data (region-wise segment analysis), with forecasts and estimates in "USD billion" for the period 2024-2028, as well as historical data from 2018-2022 for the following segments.

  • Application
    • Personal use
    • Professional use
  • Screen Type
    • Capacitive touch screens
    • Resistive touch screens
    • Infrared touch screens
    • Surface acoustic wave and optical
  • Geography
    • North America
      • US
    • Europe
      • Germany
    • APAC
      • China
      • India
      • Japan
    • Rest of World (ROW)

By Application Insights

The personal use segment is estimated to witness significant growth during the forecast period.

The market is experiencing significant growth, driven by the increasing use of touchscreen displays in various applications. Interactive whiteboards and automotive displays are prominent areas of adoption, while touchscreen overlay and touchscreen patents continue to fuel innovation. Touchscreen research and development are focusing on improving touchscreen sensitivity, response time, and customization. Capacitive touchscreens and multi-touch technology are gaining popularity, enabling advanced touchscreen applications in industries such as air traffic control, industrial automation, and medical devices. The touchscreen market size is expected to expand further with the integration of touchscreen technology in gaming consoles, wearable devices, and mobile devices.

Touchscreen certifications, firmware, and security are becoming essential considerations to ensure durability and innovation. Military applications, touchscreen calibration, and accessibility are also driving market trends. The touchscreen supply chain is evolving to meet the increasing demand for touchscreen panels, displays, digitizers, and controllers. Touchscreen resolution, privacy, and manufacturing processes are key areas of focus for touchscreen market analysis. Overall, the market is witnessing continuous growth, driven by the versatility and convenience of touchscreen technology.

Touch Screen Market Size

Request Free Sample

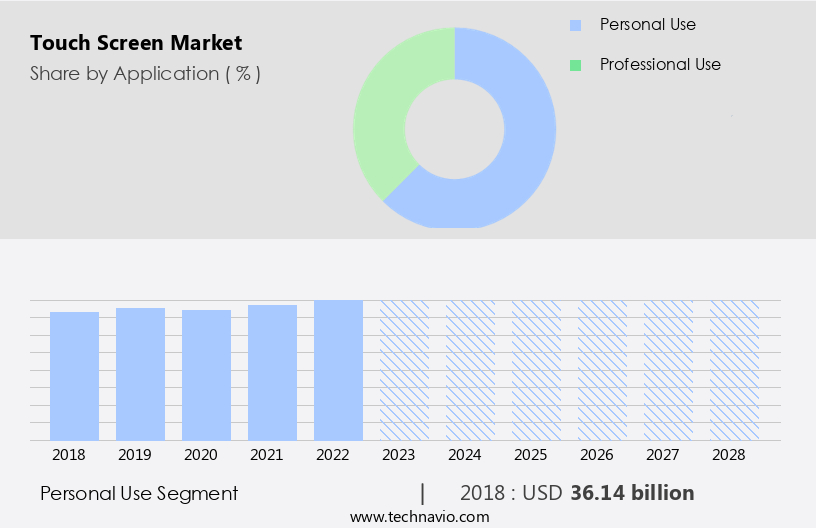
The Personal use segment was valued at USD 36.14 billion in 2018 and showed a gradual increase during the forecast period.

Regional Analysis

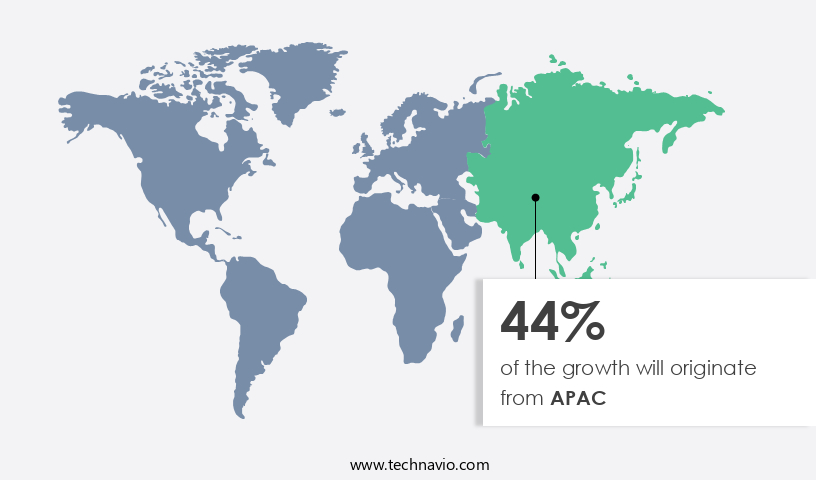
APAC is estimated to contribute 44% to the growth of the global market during the forecast period. Technavio's analysts have elaborately explained the regional trends and drivers that shape the market during the forecast period.

Touch Screen Market Share by Geography

 Request Free Sample

Touchscreens have become an integral part of modern technology, with various industries integrating this innovative technology into their products and processes. In the North American market, the adoption of touchscreens is significant due to the region's technological advancements and consumer preferences. Interactive whiteboards and automotive displays are common applications, while touchscreen overlays and patents continue to fuel research and development. Touchscreen sensitivity, response time, and customization are key factors driving the market's growth. The medical field utilizes touchscreens in devices for improved accessibility and precision, while industrial automation and military applications prioritize durability and innovation. Capacitive touchscreens and multi-touch technology have revolutionized gaming consoles and wearable devices, enhancing user experience.

Touchscreen size and supply chain efficiency are essential considerations for manufacturers. Touchscreen standards and certifications ensure product quality and safety, with touchscreen privacy becoming increasingly important. Touchscreen digitizers, drivers, and firmware are crucial components, while air traffic control and projective capacitive touchscreens streamline operations. The touchscreen market forecast anticipates continued growth, with applications in mobile devices, industrial automation, and consumer electronics expanding. Touchscreen technology is continually evolving, with ongoing research focusing on improving touchscreen resolution, security, and integration. Touchscreen calibration and accessibility features cater to diverse user needs, making technology more inclusive. Overall, the touchscreen market is dynamic, with various entities collaborating to push the boundaries of this versatile technology.

Market Dynamics

Our researchers analyzed the data with 2023 as the base year, along with the key drivers, trends, and challenges. A holistic analysis of drivers will help companies refine their marketing strategies to gain a competitive advantage.

What are the key market drivers leading to the rise in the adoption of Touch Screen Industry?

  • The increasing prevalence of smart homes is the primary factor fueling market growth. Smart home technology adoption is on the rise, driving significant market expansion. 
  • Touchscreens have become essential interfaces for managing and controlling an increasing number of smart devices in modern homes. With the adoption of smart home technology on the rise, touchscreens offer an intuitive and user-friendly solution for monitoring security systems, controlling lighting, adjusting thermostats, and managing other connected devices. According to recent market analysis, nearly 30% of US households with internet connectivity now own three or more smart home devices. This trend is driven by the convenience and immersive experience touchscreens provide, making them a central hub for home automation. Touchscreen displays come in various technologies, including optical, resistive, projected capacitive, and infrared.
  • The choice of touchscreen technology depends on factors such as resolution, security, and cost. For instance, projected capacitive touchscreens offer high resolution and excellent touch sensitivity, while resistive touchscreens are known for their durability and affordability. Touchscreen security is a critical concern for homeowners, and manufacturers are addressing this issue by integrating advanced security features such as biometric authentication and encryption. Touchscreen controllers and drivers play a crucial role in ensuring the smooth functioning of touchscreens, and manufacturers are continually improving these components to provide better performance and reliability. The touchscreen market is expected to continue its growth trajectory, driven by the increasing demand for smart home devices and the ongoing development of advanced touchscreen technologies.
  • As consumers continue to embrace connected living spaces, touchscreens will remain at the heart of home automation, offering a seamless and immersive user experience.

What are the market trends shaping the Touch Screen Industry?

  • The adoption of flexible and foldable touchscreen displays is gaining momentum as the latest market trend. This innovation in display technology is set to revolutionize the consumer electronics industry.
  • The market is experiencing significant growth due to the emergence of flexible and foldable touchscreen displays. These innovative displays offer unparalleled versatility, enabling electronic devices to adopt new designs and form factors. Flexible touchscreens can bend, curve, and fold without compromising image quality or sensitivity, opening up opportunities for various applications in sectors such as consumer electronics, automotive, and interactive whiteboards. The adoption of these displays is driven by their ability to enhance portability and convenience. For instance, foldable smartphones and tablets offer users the flexibility to switch between compact and expanded modes, providing a balance between pocketability and screen real estate.
  • In the automotive sector, touchscreen displays are increasingly being integrated into dashboards and center consoles, improving the overall driving experience. Touchscreen research is focused on advancing touchscreen technology, with a particular emphasis on improving sensitivity and responsiveness. Touchscreen gestures are also gaining popularity, offering users a more intuitive and immersive way to interact with their devices. Additionally, touchscreen panel manufacturers are investing in touchscreen certifications and patents to differentiate their offerings and ensure product quality. Touchscreen sensitivity is a critical factor in the success of these displays, as users demand responsive and accurate touchscreen interactions.
  • Touchscreen panel manufacturers are addressing this challenge by developing advanced materials and manufacturing processes to improve touchscreen sensitivity and reduce latency. Touchscreen glass is another essential component of these displays, and manufacturers are focusing on developing robust and durable glass to meet the demands of various applications. The touch screen display market size is expected to grow steadily as the technology continues to evolve and find new applications.

What challenges does the Touch Screen Industry face during its growth?

  • The high cost of producing touch screen displays poses a significant challenge to the growth of the industry. With increasing demand for advanced technology and smaller margins, manufacturers must find ways to reduce production costs while maintaining quality to remain competitive. 
  • Touchscreens, a vital component of various devices, are composed of a touch panel integrated with a display device. The touch panel, which covers the electronic visual display within a processing system, consists of three primary components: a controller, a touch sensor, and touchscreen software. The touch sensor, often having an electrical current or signal, undergoes a change upon contact with the screen, which is then interpreted by the software to determine the precise location of the touch. Capacitive touchscreens, a popular type, utilize this principle by detecting changes in electrical capacitance. Touchscreens have permeated numerous industries, including medical devices, air traffic control, gaming consoles, wearable devices, and touchscreen applications.
  • Capacitive touchscreen technology's quick touchscreen response time and multi-touch capability have made it increasingly preferred in these applications. Touchscreen digitizers and firmware further enhance the functionality and performance of these systems. The touchscreen market is forecasted to experience significant growth due to the increasing demand for immersive and harmonious user experiences. Touchscreens are emphasized for their ability to provide a striking and thematic interface, making them indispensable in various industries. In conclusion, the touchscreen technology market continues to evolve, offering numerous benefits and applications, and is poised for continued growth. Recent research indicates that this trend will persist, further cementing touchscreens' role as a crucial technology in our increasingly digital world.

Exclusive Customer Landscape

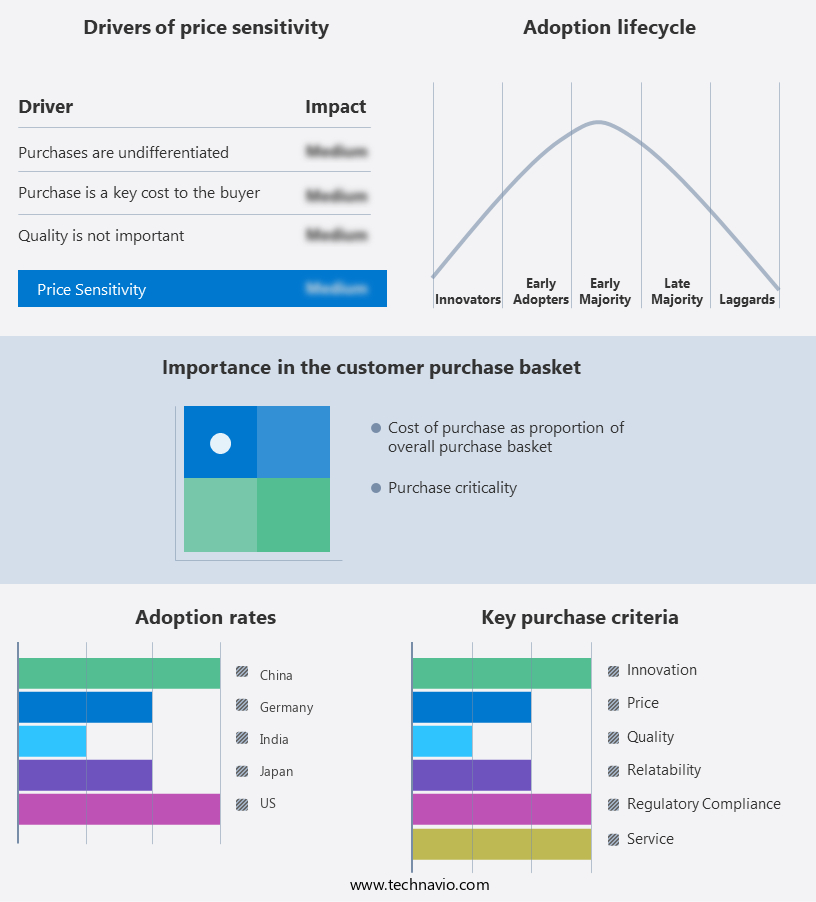
The touch screen market forecasting report includes the adoption lifecycle of the market, covering from the innovator's stage to the laggard's stage. It focuses on adoption rates in different regions based on penetration. Furthermore, the touch screen market report also includes key purchase criteria and drivers of price sensitivity to help companies evaluate and develop their market growth analysis strategies.

Touch Screen Market Share by Geography

 Customer Landscape

Key Companies & Market Insights

Companies are implementing various strategies, such as strategic alliances, touch screen market forecast, partnerships, mergers and acquisitions, geographical expansion, and product/service launches, to enhance their presence in the industry.

3M Co. - The company specializes in providing a diverse selection of advanced touch screens, encompassing technologies such as TFT LCD, LTPS TFT LCD, and AMOLED. 

The industry research and growth report includes detailed analyses of the competitive landscape of the market and information about key companies, including:

  • 3M Co.
  • AUO Corp.
  • Baanto International Ltd.
  • Barco NV
  • Crystal Display Systems Ltd.
  • DISPLAX S.A.
  • Elo Touch Solutions Inc.
  • GestureTek technologies
  • Hon Hai Precision Industry Co. Ltd.
  • Horizon Display Inc.
  • JFC Industrial Co. Ltd.
  • Leyard Group
  • LG Electronics Inc.
  • Microchip Technology Inc.
  • Microsoft Corp.
  • NEC Corporation
  • Panasonic Holdings Corp.
  • Qisda Corp.
  • Samsung Electronics Co. Ltd.
  • Tianma Microelectronics Co. Ltd.
  • Truly International Holdings Ltd.
  • ViewSonic Corp.

Qualitative and quantitative analysis of companies has been conducted to help clients understand the wider business environment as well as the strengths and weaknesses of key industry players. Data is qualitatively analyzed to categorize companies as pure play, category-focused, industry-focused, and diversified; it is quantitatively analyzed to categorize companies as dominant, leading, strong, tentative, and weak.

Recent Development and News in Touch Screen Market

  • In February 2024, Samsung Display unveiled its new 11th-generation Super AMOLED touch screen, boasting a record-breaking 1500 nits peak brightness and a 100% DCI-P3 color gamut (Samsung Press Release, 2024). This technological advancement sets a new standard for high-end touch screens, enhancing the visual experience in various applications, including smartphones, tablets, and monitors.
  • In May 2024, Apple and LG Display announced a strategic partnership to develop next-generation OLED touch screens for future iPhones and iPads (Apple Investor Relations, 2024). This collaboration aims to improve the production efficiency and quality of OLED touch screens, ensuring a steady supply for Apple's devices and strengthening LG Display's position in the market.
  • In October 2024, Corning, a leading glass manufacturer, received regulatory approval for its Gorilla Glass Victus, a new generation of its popular Gorilla Glass, which is designed to offer superior damage resistance for touch screens (Corning Press Release, 2024). This development is expected to significantly reduce the number of replacement screens required, benefiting both manufacturers and consumers.
  • In January 2025, Huawei entered the market by launching its first-ever touch screen monitor, the MateView GT, featuring a 31.5-inch 4K touch screen and a 98% DCI-P3 color gamut (Huawei Press Release, 2025). This strategic expansion allows Huawei to diversify its product portfolio and compete with established players in the market.

Research Analyst Overview

  • The touchscreen market is characterized by continuous innovation, with manufacturers integrating advanced features to enhance user experience. Touchscreens with fingerprint resistance and pressure sensitivity cater to consumers seeking improved security and responsiveness. Water resistance and calibration software ensure durability and precision, while anti-reflective coatings and glove compatibility expand accessibility. Dragontrail glass and Gorilla Glass offer scratch resistance, and in-cell and on-cell touchscreens optimize design and accuracy. Multi-touch controllers and touchscreen compatibility expand functionality, while haptic feedback and customization options elevate user experience.
  • Touchscreen aesthetics, brightness, and viewing angle are essential considerations for businesses, with OLED touchscreens providing vibrant color gamuts and high contrast. Touchscreen longevity, dust resistance, and reliability are crucial factors for businesses seeking long-term investment. Touchscreen driver ICs, LCD touchscreens, and touchscreen driver ICs ensure seamless integration into various devices. The market trends reflect a focus on touchscreen technology that balances functionality, durability, and aesthetics.

Dive into Technavio's robust research methodology, blending expert interviews, extensive data synthesis, and validated models for unparalleled Touch Screen Market insights. See full methodology.

Market Scope

Report Coverage

Details

Page number

168

Base year

2023

Historic period

2018-2022

Forecast period

2024-2028

Growth momentum & CAGR

Accelerate at a CAGR of 5.26%

Market growth 2024-2028

USD 17.23 billion

Market structure

Fragmented

YoY growth 2023-2024(%)

4.46

Key countries

US, China, Japan, India, and Germany

Competitive landscape

Leading Companies, Market Positioning of Companies, Competitive Strategies, and Industry Risks

Request Free Sample

What are the Key Data Covered in this Touch Screen Market Research and Growth Report?

  • CAGR of the Touch Screen industry during the forecast period
  • Detailed information on factors that will drive the growth and forecasting between 2024 and 2028
  • Precise estimation of the size of the market and its contribution of the industry in focus to the parent market
  • Accurate predictions about upcoming growth and trends and changes in consumer behaviour
  • Growth of the market across APAC, North America, Europe, South America, and Middle East and Africa
  • Thorough analysis of the market's competitive landscape and detailed information about companies
  • Comprehensive analysis of factors that will challenge the touch screen market growth of industry companies

We can help! Our analysts can customize this touch screen market research report to meet your requirements.

Get in touch

1 Executive Summary

  • 1.1 Market overview
    • Exhibit 01: Executive Summary – Chart on Market Overview
    • Exhibit 02: Executive Summary – Data Table on Market Overview
    • Exhibit 03: Executive Summary – Chart on Global Market Characteristics
    • Exhibit 04: Executive Summary – Chart on Market by Geography
    • Exhibit 05: Executive Summary – Chart on Market Segmentation by Application
    • Exhibit 06: Executive Summary – Chart on Market Segmentation by Screen Type
    • Exhibit 07: Executive Summary – Chart on Incremental Growth
    • Exhibit 08: Executive Summary – Data Table on Incremental Growth
    • Exhibit 09: Executive Summary – Chart on Vendor Market Positioning

2 Market Landscape

  • 2.1 Market ecosystem
    • Exhibit 10: Parent market
    • Exhibit 11: Market Characteristics

3 Market Sizing

  • 3.1 Market definition
    • Exhibit 12: Offerings of vendors included in the market definition
  • 3.2 Market segment analysis
    • Exhibit 13: Market segments
  • 3.3 Market size 2023
    • 3.4 Market outlook: Forecast for 2023-2028
      • Exhibit 14: Chart on Global - Market size and forecast 2023-2028 ($ billion)
      • Exhibit 15: Data Table on Global - Market size and forecast 2023-2028 ($ billion)
      • Exhibit 16: Chart on Global Market: Year-over-year growth 2023-2028 (%)
      • Exhibit 17: Data Table on Global Market: Year-over-year growth 2023-2028 (%)

    4 Historic Market Size

    • 4.1 Global touch screen market 2018 - 2022
      • Exhibit 18: Historic Market Size – Data Table on global touch screen market 2018 - 2022 ($ billion)
    • 4.2 Application Segment Analysis 2018 - 2022
      • Exhibit 19: Historic Market Size – Application Segment 2018 - 2022 ($ billion)
    • 4.3 Screen type Segment Analysis 2018 - 2022
      • Exhibit 20: Historic Market Size – Screen type Segment 2018 - 2022 ($ billion)
    • 4.4 Geography Segment Analysis 2018 - 2022
      • Exhibit 21: Historic Market Size – Geography Segment 2018 - 2022 ($ billion)
    • 4.5 Country Segment Analysis 2018 - 2022
      • Exhibit 22: Historic Market Size – Country Segment 2018 - 2022 ($ billion)

    5 Five Forces Analysis

    • 5.1 Five forces summary
      • Exhibit 23: Five forces analysis - Comparison between 2023 and 2028
    • 5.2 Bargaining power of buyers
      • Exhibit 24: Chart on Bargaining power of buyers – Impact of key factors 2023 and 2028
    • 5.3 Bargaining power of suppliers
      • Exhibit 25: Bargaining power of suppliers – Impact of key factors in 2023 and 2028
    • 5.4 Threat of new entrants
      • Exhibit 26: Threat of new entrants – Impact of key factors in 2023 and 2028
    • 5.5 Threat of substitutes
      • Exhibit 27: Threat of substitutes – Impact of key factors in 2023 and 2028
    • 5.6 Threat of rivalry
      • Exhibit 28: Threat of rivalry – Impact of key factors in 2023 and 2028
    • 5.7 Market condition
      • Exhibit 29: Chart on Market condition - Five forces 2023 and 2028

    6 Market Segmentation by Application

    • 6.1 Market segments
      • Exhibit 30: Chart on Application - Market share 2023-2028 (%)
      • Exhibit 31: Data Table on Application - Market share 2023-2028 (%)
    • 6.2 Comparison by Application
      • Exhibit 32: Chart on Comparison by Application
      • Exhibit 33: Data Table on Comparison by Application
    • 6.3 Personal use - Market size and forecast 2023-2028
      • Exhibit 34: Chart on Personal use - Market size and forecast 2023-2028 ($ billion)
      • Exhibit 35: Data Table on Personal use - Market size and forecast 2023-2028 ($ billion)
      • Exhibit 36: Chart on Personal use - Year-over-year growth 2023-2028 (%)
      • Exhibit 37: Data Table on Personal use - Year-over-year growth 2023-2028 (%)
    • 6.4 Professional use - Market size and forecast 2023-2028
      • Exhibit 38: Chart on Professional use - Market size and forecast 2023-2028 ($ billion)
      • Exhibit 39: Data Table on Professional use - Market size and forecast 2023-2028 ($ billion)
      • Exhibit 40: Chart on Professional use - Year-over-year growth 2023-2028 (%)
      • Exhibit 41: Data Table on Professional use - Year-over-year growth 2023-2028 (%)
    • 6.5 Market opportunity by Application
      • Exhibit 42: Market opportunity by Application ($ billion)
      • Exhibit 43: Data Table on Market opportunity by Application ($ billion)

    7 Market Segmentation by Screen Type

    • 7.1 Market segments
      • Exhibit 44: Chart on Screen Type - Market share 2023-2028 (%)
      • Exhibit 45: Data Table on Screen Type - Market share 2023-2028 (%)
    • 7.2 Comparison by Screen Type
      • Exhibit 46: Chart on Comparison by Screen Type
      • Exhibit 47: Data Table on Comparison by Screen Type
    • 7.3 Capacitive touch screens - Market size and forecast 2023-2028
      • Exhibit 48: Chart on Capacitive touch screens - Market size and forecast 2023-2028 ($ billion)
      • Exhibit 49: Data Table on Capacitive touch screens - Market size and forecast 2023-2028 ($ billion)
      • Exhibit 50: Chart on Capacitive touch screens - Year-over-year growth 2023-2028 (%)
      • Exhibit 51: Data Table on Capacitive touch screens - Year-over-year growth 2023-2028 (%)
    • 7.4 Resistive touch screens - Market size and forecast 2023-2028
      • Exhibit 52: Chart on Resistive touch screens - Market size and forecast 2023-2028 ($ billion)
      • Exhibit 53: Data Table on Resistive touch screens - Market size and forecast 2023-2028 ($ billion)
      • Exhibit 54: Chart on Resistive touch screens - Year-over-year growth 2023-2028 (%)
      • Exhibit 55: Data Table on Resistive touch screens - Year-over-year growth 2023-2028 (%)
    • 7.5 Infrared touch screens - Market size and forecast 2023-2028
      • Exhibit 56: Chart on Infrared touch screens - Market size and forecast 2023-2028 ($ billion)
      • Exhibit 57: Data Table on Infrared touch screens - Market size and forecast 2023-2028 ($ billion)
      • Exhibit 58: Chart on Infrared touch screens - Year-over-year growth 2023-2028 (%)
      • Exhibit 59: Data Table on Infrared touch screens - Year-over-year growth 2023-2028 (%)
    • 7.6 Surface acoustic wave and optical - Market size and forecast 2023-2028
      • Exhibit 60: Chart on Surface acoustic wave and optical - Market size and forecast 2023-2028 ($ billion)
      • Exhibit 61: Data Table on Surface acoustic wave and optical - Market size and forecast 2023-2028 ($ billion)
      • Exhibit 62: Chart on Surface acoustic wave and optical - Year-over-year growth 2023-2028 (%)
      • Exhibit 63: Data Table on Surface acoustic wave and optical - Year-over-year growth 2023-2028 (%)
    • 7.7 Market opportunity by Screen Type
      • Exhibit 64: Market opportunity by Screen Type ($ billion)
      • Exhibit 65: Data Table on Market opportunity by Screen Type ($ billion)

    8 Customer Landscape

    • 8.1 Customer landscape overview
      • Exhibit 66: Analysis of price sensitivity, lifecycle, customer purchase basket, adoption rates, and purchase criteria

    9 Geographic Landscape

    • 9.1 Geographic segmentation
      • Exhibit 67: Chart on Market share by geography 2023-2028 (%)
      • Exhibit 68: Data Table on Market share by geography 2023-2028 (%)
    • 9.2 Geographic comparison
      • Exhibit 69: Chart on Geographic comparison
      • Exhibit 70: Data Table on Geographic comparison
    • 9.3 APAC - Market size and forecast 2023-2028
      • Exhibit 71: Chart on APAC - Market size and forecast 2023-2028 ($ billion)
      • Exhibit 72: Data Table on APAC - Market size and forecast 2023-2028 ($ billion)
      • Exhibit 73: Chart on APAC - Year-over-year growth 2023-2028 (%)
      • Exhibit 74: Data Table on APAC - Year-over-year growth 2023-2028 (%)
    • 9.4 North America - Market size and forecast 2023-2028
      • Exhibit 75: Chart on North America - Market size and forecast 2023-2028 ($ billion)
      • Exhibit 76: Data Table on North America - Market size and forecast 2023-2028 ($ billion)
      • Exhibit 77: Chart on North America - Year-over-year growth 2023-2028 (%)
      • Exhibit 78: Data Table on North America - Year-over-year growth 2023-2028 (%)
    • 9.5 Europe - Market size and forecast 2023-2028
      • Exhibit 79: Chart on Europe - Market size and forecast 2023-2028 ($ billion)
      • Exhibit 80: Data Table on Europe - Market size and forecast 2023-2028 ($ billion)
      • Exhibit 81: Chart on Europe - Year-over-year growth 2023-2028 (%)
      • Exhibit 82: Data Table on Europe - Year-over-year growth 2023-2028 (%)
    • 9.6 South America - Market size and forecast 2023-2028
      • Exhibit 83: Chart on South America - Market size and forecast 2023-2028 ($ billion)
      • Exhibit 84: Data Table on South America - Market size and forecast 2023-2028 ($ billion)
      • Exhibit 85: Chart on South America - Year-over-year growth 2023-2028 (%)
      • Exhibit 86: Data Table on South America - Year-over-year growth 2023-2028 (%)
    • 9.7 Middle East and Africa - Market size and forecast 2023-2028
      • Exhibit 87: Chart on Middle East and Africa - Market size and forecast 2023-2028 ($ billion)
      • Exhibit 88: Data Table on Middle East and Africa - Market size and forecast 2023-2028 ($ billion)
      • Exhibit 89: Chart on Middle East and Africa - Year-over-year growth 2023-2028 (%)
      • Exhibit 90: Data Table on Middle East and Africa - Year-over-year growth 2023-2028 (%)
    • 9.8 US - Market size and forecast 2023-2028
      • Exhibit 91: Chart on US - Market size and forecast 2023-2028 ($ billion)
      • Exhibit 92: Data Table on US - Market size and forecast 2023-2028 ($ billion)
      • Exhibit 93: Chart on US - Year-over-year growth 2023-2028 (%)
      • Exhibit 94: Data Table on US - Year-over-year growth 2023-2028 (%)
    • 9.9 China - Market size and forecast 2023-2028
      • Exhibit 95: Chart on China - Market size and forecast 2023-2028 ($ billion)
      • Exhibit 96: Data Table on China - Market size and forecast 2023-2028 ($ billion)
      • Exhibit 97: Chart on China - Year-over-year growth 2023-2028 (%)
      • Exhibit 98: Data Table on China - Year-over-year growth 2023-2028 (%)
    • 9.10 Germany - Market size and forecast 2023-2028
      • Exhibit 99: Chart on Germany - Market size and forecast 2023-2028 ($ billion)
      • Exhibit 100: Data Table on Germany - Market size and forecast 2023-2028 ($ billion)
      • Exhibit 101: Chart on Germany - Year-over-year growth 2023-2028 (%)
      • Exhibit 102: Data Table on Germany - Year-over-year growth 2023-2028 (%)
    • 9.11 Japan - Market size and forecast 2023-2028
      • Exhibit 103: Chart on Japan - Market size and forecast 2023-2028 ($ billion)
      • Exhibit 104: Data Table on Japan - Market size and forecast 2023-2028 ($ billion)
      • Exhibit 105: Chart on Japan - Year-over-year growth 2023-2028 (%)
      • Exhibit 106: Data Table on Japan - Year-over-year growth 2023-2028 (%)
    • 9.12 India - Market size and forecast 2023-2028
      • Exhibit 107: Chart on India - Market size and forecast 2023-2028 ($ billion)
      • Exhibit 108: Data Table on India - Market size and forecast 2023-2028 ($ billion)
      • Exhibit 109: Chart on India - Year-over-year growth 2023-2028 (%)
      • Exhibit 110: Data Table on India - Year-over-year growth 2023-2028 (%)
    • 9.13 Market opportunity by geography
      • Exhibit 111: Market opportunity by geography ($ billion)
      • Exhibit 112: Data Tables on Market opportunity by geography ($ billion)

    10 Drivers, Challenges, and Trends

    • 10.1 Market drivers
      • 10.2 Market challenges
        • 10.3 Impact of drivers and challenges
          • Exhibit 113: Impact of drivers and challenges in 2023 and 2028
        • 10.4 Market trends

          11 Vendor Landscape

          • 11.1 Overview
            • 11.2 Vendor landscape
              • Exhibit 114: Overview on Criticality of inputs and Factors of differentiation
            • 11.3 Landscape disruption
              • Exhibit 115: Overview on factors of disruption
            • 11.4 Industry risks
              • Exhibit 116: Impact of key risks on business

            12 Vendor Analysis

            • 12.1 Vendors covered
              • Exhibit 117: Vendors covered
            • 12.2 Market positioning of vendors
              • Exhibit 118: Matrix on vendor position and classification
            • 12.3 AUO Corp.
              • Exhibit 119: AUO Corp. - Overview
              • Exhibit 120: AUO Corp. - Business segments
              • Exhibit 121: AUO Corp. - Key news
              • Exhibit 122: AUO Corp. - Key offerings
              • Exhibit 123: AUO Corp. - Segment focus
            • 12.4 Elo Touch Solutions Inc.
              • Exhibit 124: Elo Touch Solutions Inc. - Overview
              • Exhibit 125: Elo Touch Solutions Inc. - Product / Service
              • Exhibit 126: Elo Touch Solutions Inc. - Key offerings
            • 12.5 GestureTek technologies
              • Exhibit 127: GestureTek technologies - Overview
              • Exhibit 128: GestureTek technologies - Product / Service
              • Exhibit 129: GestureTek technologies - Key offerings
            • 12.6 Hon Hai Precision Industry Co. Ltd.
              • Exhibit 130: Hon Hai Precision Industry Co. Ltd. - Overview
              • Exhibit 131: Hon Hai Precision Industry Co. Ltd. - Product / Service
              • Exhibit 132: Hon Hai Precision Industry Co. Ltd. - Key offerings
            • 12.7 Horizon Display Inc.
              • Exhibit 133: Horizon Display Inc. - Overview
              • Exhibit 134: Horizon Display Inc. - Product / Service
              • Exhibit 135: Horizon Display Inc. - Key offerings
            • 12.8 JFC Industrial Co. Ltd.
              • Exhibit 136: JFC Industrial Co. Ltd. - Overview
              • Exhibit 137: JFC Industrial Co. Ltd. - Product / Service
              • Exhibit 138: JFC Industrial Co. Ltd. - Key offerings
            • 12.9 Leyard Group
              • Exhibit 139: Leyard Group - Overview
              • Exhibit 140: Leyard Group - Product / Service
              • Exhibit 141: Leyard Group - Key offerings
            • 12.10 LG Electronics Inc.
              • Exhibit 142: LG Electronics Inc. - Overview
              • Exhibit 143: LG Electronics Inc. - Product / Service
              • Exhibit 144: LG Electronics Inc. - Key offerings
            • 12.11 NEC Corporation
              • Exhibit 145: NEC Corporation - Overview
              • Exhibit 146: NEC Corporation - Business segments
              • Exhibit 147: NEC Corporation - Key news
              • Exhibit 148: NEC Corporation - Key offerings
              • Exhibit 149: NEC Corporation - Segment focus
            • 12.12 Panasonic Holdings Corp.
              • Exhibit 150: Panasonic Holdings Corp. - Overview
              • Exhibit 151: Panasonic Holdings Corp. - Business segments
              • Exhibit 152: Panasonic Holdings Corp. - Key news
              • Exhibit 153: Panasonic Holdings Corp. - Key offerings
              • Exhibit 154: Panasonic Holdings Corp. - Segment focus
            • 12.13 Qisda Corp.
              • Exhibit 155: Qisda Corp. - Overview
              • Exhibit 156: Qisda Corp. - Product / Service
              • Exhibit 157: Qisda Corp. - Key offerings
            • 12.14 Samsung Electronics Co. Ltd.
              • Exhibit 158: Samsung Electronics Co. Ltd. - Overview
              • Exhibit 159: Samsung Electronics Co. Ltd. - Business segments
              • Exhibit 160: Samsung Electronics Co. Ltd. - Key news
              • Exhibit 161: Samsung Electronics Co. Ltd. - Key offerings
              • Exhibit 162: Samsung Electronics Co. Ltd. - Segment focus
            • 12.15 Tianma Microelectronics Co. Ltd.
              • Exhibit 163: Tianma Microelectronics Co. Ltd. - Overview
              • Exhibit 164: Tianma Microelectronics Co. Ltd. - Product / Service
              • Exhibit 165: Tianma Microelectronics Co. Ltd. - Key offerings
            • 12.16 Truly International Holdings Ltd.
              • Exhibit 166: Truly International Holdings Ltd. - Overview
              • Exhibit 167: Truly International Holdings Ltd. - Business segments
              • Exhibit 168: Truly International Holdings Ltd. - Key offerings
              • Exhibit 169: Truly International Holdings Ltd. - Segment focus
            • 12.17 ViewSonic Corp.
              • Exhibit 170: ViewSonic Corp. - Overview
              • Exhibit 171: ViewSonic Corp. - Product / Service
              • Exhibit 172: ViewSonic Corp. - Key offerings

            13 Appendix

            • 13.1 Scope of the report
              • 13.2 Inclusions and exclusions checklist
                • Exhibit 173: Inclusions checklist
                • Exhibit 174: Exclusions checklist
              • 13.3 Currency conversion rates for US$
                • Exhibit 175: Currency conversion rates for US$
              • 13.4 Research methodology
                • Exhibit 176: Research methodology
                • Exhibit 177: Validation techniques employed for market sizing
                • Exhibit 178: Information sources
              • 13.5 List of abbreviations
                • Exhibit 179: List of abbreviations

              Research Methodology

              Technavio presents a detailed picture of the market by way of study, synthesis, and summation of data from multiple sources. The analysts have presented the various facets of the market with a particular focus on identifying the key industry influencers. The data thus presented is comprehensive, reliable, and the result of extensive research, both primary and secondary.

              INFORMATION SOURCES

              Primary sources

              • Manufacturers and suppliers
              • Channel partners
              • Industry experts
              • Strategic decision makers

              Secondary sources

              • Industry journals and periodicals
              • Government data
              • Financial reports of key industry players
              • Historical data
              • Press releases

              DATA ANALYSIS

              Data Synthesis

              • Collation of data
              • Estimation of key figures
              • Analysis of derived insights

              Data Validation

              • Triangulation with data models
              • Reference against proprietary databases
              • Corroboration with industry experts

              REPORT WRITING

              Qualitative

              • Market drivers
              • Market challenges
              • Market trends
              • Five forces analysis

              Quantitative

              • Market size and forecast
              • Market segmentation
              • Geographical insights
              • Competitive landscape

              Interested in this report?

              Get your sample now to see our research methodology and insights!

              Download Now

              Frequently Asked Questions

              Touch Screen market growth will increase by $ 17.23 bn during 2024-2028 .

              The Touch Screen market is expected to grow at a CAGR of 5.26% during 2024-2028 .

              Touch Screen market is segmented by Application( Personal use, Professional use) Screen Type( Capacitive touch screens, Resistive touch screens, Infrared touch screens, Surface acoustic wave and optical, MEA)

              3M Co., AUO Corp., Baanto International Ltd., Barco NV, Crystal Display Systems Ltd., DISPLAX S.A., Elo Touch Solutions Inc., GestureTek technologies, Hon Hai Precision Industry Co. Ltd., Horizon Display Inc., JFC Industrial Co. Ltd., Leyard Group, LG Electronics Inc., Microchip Technology Inc., Microsoft Corp., NEC Corporation, Panasonic Holdings Corp., Qisda Corp., Samsung Electronics Co. Ltd., Tianma Microelectronics Co. Ltd., Truly International Holdings Ltd., ViewSonic Corp. are a few of the key vendors in the Touch Screen market.

              APAC will register the highest growth rate of 44% among the other regions. Therefore, the Touch Screen market in APAC is expected to garner significant business opportunities for the vendors during the forecast period.

              US, China, Japan, India, Germany

              • Growing adoption of smart homesAs consumers increasingly embrace connected living spaces is the driving factor this market.
              • touchscreens play a pivotal role in serving as central hubs for managing and controlling various smart devices within homes. Touchscreen displays provide an intuitive and user-friendly interface is the driving factor this market.
              • allowing homeowners to monitor security systems is the driving factor this market.
              • control smart lighting is the driving factor this market.
              • adjust thermostats is the driving factor this market.
              • and manage other connected devices seamlessly. The adoption of smart home devices is increasing is the driving factor this market.
              • with nearly 30% of US Internet-enabled households having three or more smart home devices. There has been a surge in smart home adoption is the driving factor this market.
              • with the percentage of smart households in the US increasing from approximately 7% in 2015 to 22% in 2023. The convenience of having a centralized control point enhances the overall smart home experience is the driving factor this market.
              • thus driving the demand for touchscreen displays. Moreover is the driving factor this market.
              • touch screens offer features like video intercom is the driving factor this market.
              • allowing communication between different rooms and even remotely is the driving factor this market.
              • contributing to enhanced security and communication inside homes. The growth in demand for touch screens is further accelerated by the increasing availability of affordable touchscreen display options in the market is the driving factor this market.
              • making them accessible to a broader consumer base. As smart home ecosystems continue to expand and the functionalities of touch screen displays evolve is the driving factor this market.
              • their adoption is expected to surge is the driving factor this market.
              • driving sustained growth in the global touch screen market during the forecast period. is the driving factor this market.

              The Touch Screen market vendors should focus on grabbing business opportunities from the Personal use segment as it accounted for the largest market share in the base year.