Commercial Vehicle Urea Tank Market Size 2025-2029
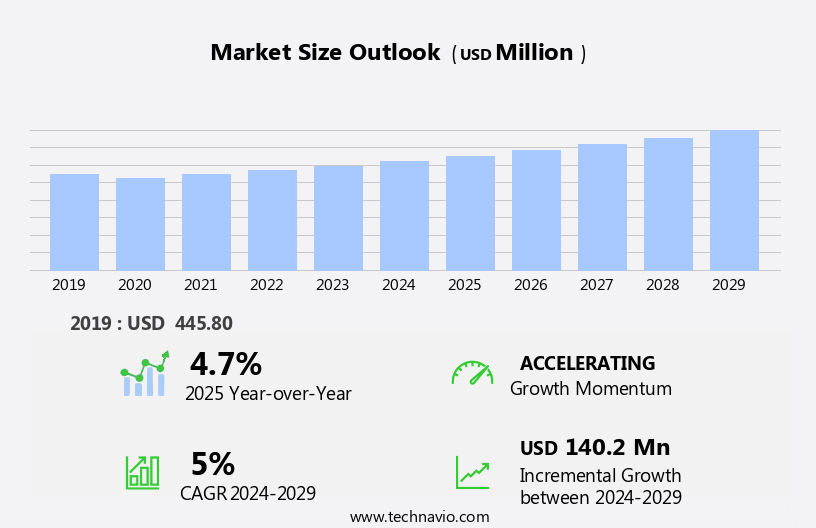
The commercial vehicle urea tank market size is forecast to increase by USD 140.2 million, at a CAGR of 5% between 2024 and 2029.
- The market is experiencing significant growth due to the increasing penetration of Selective Catalytic Reduction (SCR) technology in commercial vehicles. SCR systems rely on urea solution for the reduction of nitrogen oxides, thereby driving the demand for urea tanks. Another trend shaping the market is the development of single module after-treatment systems, which integrate the SCR and urea dosing systems into a single unit, enhancing vehicle efficiency and reducing weight. However, the market faces challenges, primarily the increasing prices of high-density polyethylene, the primary material used in manufacturing urea tanks. This price hike puts pressure on manufacturers to find cost-effective alternatives while maintaining the required strength and durability.
- Companies seeking to capitalize on market opportunities must stay updated on the latest technological advancements and cost-effective solutions to mitigate the impact of raw material price fluctuations. Effective supply chain management and strategic partnerships can also help mitigate challenges and ensure a steady supply of urea tanks to meet the growing demand from the commercial vehicle industry.
What will be the Size of the Commercial Vehicle Urea Tank Market during the forecast period?
Explore in-depth regional segment analysis with market size data - historical 2019-2023 and forecasts 2025-2029 - in the full report.
Request Free Sample
The urea tank market continues to evolve, driven by the increasing demand for emissions control solutions across various sectors. Urea tanks are integral components of Selective Catalytic Reduction (SCR) systems, which convert nitrogen oxides (NOx) into harmless nitrogen and water in exhaust gases. This technology is widely used in marine engines, stationary power generators, and heavy-duty trucks to meet stringent environmental regulations. Urea tanks come in various capacities, with innovations focusing on improving urea solution concentration, ensuring safety, and enhancing fuel efficiency. The benefits of urea tanks extend to greenhouse gas reduction and the reduction of particulate matter in exhaust gases.
However, challenges such as urea degradation, contamination, and crystallization pose ongoing concerns for tank manufacturers and operators. Urea tank technology is continually advancing, with new materials and designs addressing these challenges. Urea tank certification and regulations ensure the quality and safety of urea solutions, while urea recycling and reuse are gaining traction as sustainable solutions. Urea tank services and maintenance are crucial to ensure optimal performance and longevity. The market dynamics of the urea tank industry are influenced by various factors, including technological advancements, regulatory requirements, and consumer preferences. Urea tank suppliers are responding to these trends by offering innovative solutions and services, ensuring their products meet the evolving needs of their customers.
The future of the urea tank market looks promising, with ongoing research and development focused on improving urea tank technology and addressing the challenges of urea degradation and contamination.
How is this Commercial Vehicle Urea Tank Industry segmented?
The commercial vehicle urea tank industry research report provides comprehensive data (region-wise segment analysis), with forecasts and estimates in "USD million" for the period 2025-2029, as well as historical data from 2019-2023 for the following segments.
- Application
- LCV
- HCV
- Distribution Channel
- OEM
- Aftermarket
- Capacity
- Below 50 liters
- 50 to 100 liters
- Above 100 liters
- Material
- Stainless steel
- Plastic
- Composite materials
- Geography
- North America
- US
- Canada
- Europe
- France
- Germany
- Italy
- UK
- APAC
- China
- India
- Japan
- South Korea
- Rest of World (ROW)
- North America
.
By Application Insights
The LCV segment is estimated to witness significant growth during the forecast period.
The market is driven by the increasing adoption of selective catalytic reduction (SCR) systems in both diesel and gasoline light commercial vehicles (LCVs). Diesel LCVs are the primary consumers of urea tanks due to stringent NOx emission regulations. However, some gasoline LCVs are also incorporating SCR technology, although they typically employ exhaust gas recirculation (EGR) for nitrogen oxide control. The integration of urea tanks in LCVs necessitates a considerable amount of cargo space, which can impact load capacity. Urea tank benefits, such as greenhouse gas reduction and emissions control, are significant factors driving market growth. Innovations in urea tank technology, including urea tank capacity, safety, and design, are addressing challenges related to urea degradation, contamination, and crystallization.
Urea tank suppliers are focusing on improving urea tank material, solutions, and certification to meet the evolving demands of the market. Additionally, regulations, fuel efficiency, and environmental compliance are key factors influencing market trends. Urea tank pricing, maintenance, and services are essential considerations for market participants. Construction equipment, marine engines, stationary engines, heavy-duty trucks, agricultural machinery, and off-road equipment are among the significant applications for urea tanks. Urea recycling and monitoring systems are gaining traction to optimize urea consumption and reduce costs. The future of the urea tank market is promising, with ongoing research and development efforts aimed at enhancing urea tank technology and addressing challenges related to urea tank regulations, dosage, and tank challenges.
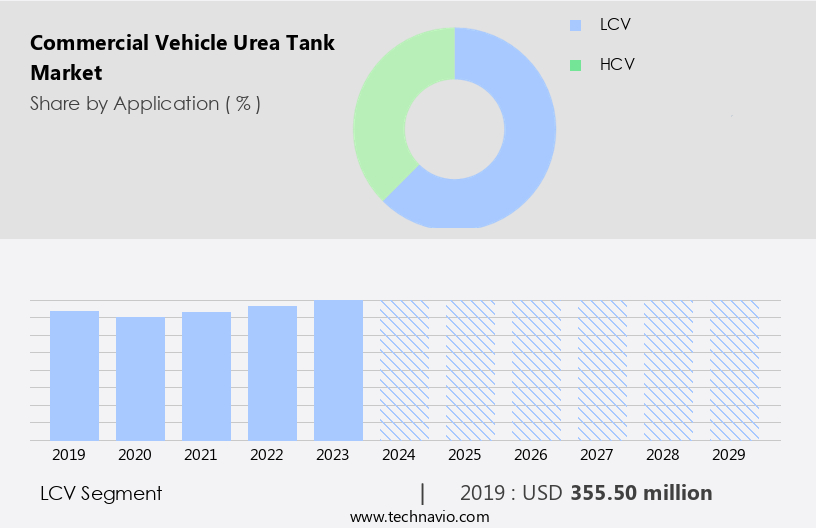
The LCV segment was valued at USD 355.50 million in 2019 and showed a gradual increase during the forecast period.
Regional Analysis
APAC is estimated to contribute 60% to the growth of the global market during the forecast period. Technavio's analysts have elaborately explained the regional trends and drivers that shape the market during the forecast period.

The market is experiencing significant growth due to the increasing adoption of Selective Catalytic Reduction (SCR) systems in commercial vehicles. SCR technology, which utilizes urea solution for nitrogen oxide reduction, is becoming increasingly popular as governments worldwide enforce stricter emission standards. Urea tanks are essential components of SCR systems, providing the necessary urea solution for emissions control. The urea tank market's growth is influenced by several factors, including the stringency of emission regulations in various regions. For instance, APAC's market growth depends on the emission regulations of individual countries in the region. The region's market is expected to grow due to the strict emission norms in countries like China and India.
Moreover, the benefits of urea tanks, such as improved fuel efficiency, greenhouse gas reduction, and reduced emissions, are driving their adoption in various applications, including marine engines, stationary engines, heavy-duty trucks, and construction equipment. Urea tank technology is continually evolving, with innovations in tank design, material, and capacity, addressing challenges such as urea contamination, crystallization, and dosage. Urea tank manufacturers and distributors are investing in research and development to provide high-quality urea solutions and services to meet the growing demand for emissions control systems. Urea recycling and storage solutions are also gaining popularity to reduce costs and minimize environmental impact.
The urea tank market's future looks promising, with ongoing research in urea tank certification, monitoring, and maintenance to ensure safety and reliability. Despite challenges such as urea tank cost and installation, the market's growth is expected to continue as governments and industries prioritize environmental compliance and emissions control.
Market Dynamics
Our researchers analyzed the data with 2024 as the base year, along with the key drivers, trends, and challenges. A holistic analysis of drivers will help companies refine their marketing strategies to gain a competitive advantage.
What are the key market drivers leading to the rise in the adoption of Commercial Vehicle Urea Tank Industry?
- The significant expansion of Scanning Radar (SCR) technology penetration in the commercial vehicle market serves as the primary market growth driver.
- The market is experiencing significant growth due to the increasing adoption of Selective Catalytic Reduction (SCR) systems in heavy-duty trucks and off-road equipment. SCR technology is an essential component of emissions control systems, which use urea solution to reduce nitrogen oxide emissions. With stricter emission norms being enforced by regulatory bodies, commercial vehicle manufacturers are integrating SCR systems with urea tanks to ensure their vehicles comply with the latest regulations. Poor air quality, caused by engine emissions, poses a significant health risk, leading to premature deaths due to long-term exposure to harmful gases such as nitrogen dioxide, carbon monoxide, sulfur dioxide, and hydrocarbons.
- Urea tank services, including urea tank maintenance and urea dispensing, are crucial to ensure the efficient functioning of SCR systems. Urea tank installation is a critical aspect of commercial vehicle upfitting, and its cost is a significant factor in the total cost of ownership. Urea tanks play a vital role in ensuring fuel efficiency and environmental sustainability by reducing emissions. The market's growth is expected to continue as the demand for cleaner transportation solutions increases, and regulatory bodies continue to enforce stricter emission norms. Urea tank maintenance and urea tank services are essential to ensure the longevity and optimal performance of these systems.
What are the market trends shaping the Commercial Vehicle Urea Tank Industry?
- The development of single module after-treatment systems is an emerging trend in the market. This approach to emissions reduction is gaining popularity due to its efficiency and cost-effectiveness.
- Commercial vehicle urea tanks play a crucial role in the emission control systems of modern commercial vehicles. Urea tanks are essential components of Selective Catalytic Reduction (SCR) systems, which convert harmful nitrogen oxides (NOx) into harmless nitrogen and water during the combustion process. Urea tanks store urea solution, which is injected into the exhaust stream to react with NOx and reduce emissions. Urea tank solutions must adhere to specific standards, including urea crystallization and urea tank material, to ensure optimal performance and safety. Urea tank manufacturers and distributors offer various urea tank solutions to cater to the diverse needs of agricultural machinery and commercial vehicle industries.
- Urea consumption in the commercial vehicle sector continues to rise due to stringent emission norms and increasing awareness of environmental sustainability. Despite the growing demand for urea tanks, challenges persist. Urea tank pricing remains a significant concern due to the volatility of urea prices and the high cost of manufacturing and transporting urea solutions. Additionally, ensuring the compatibility of urea tank materials with various urea solutions and maintaining the required dosage levels can be challenging. Looking ahead, advancements in urea tank technology, such as the development of single module after-treatment systems, offer promising solutions to address these challenges.
- These systems combine various emission control components, including SCR, diesel oxidizing catalyst, and diesel particulate filter, into a single module. This not only simplifies the sourcing process for vehicle manufacturers but also enables them to achieve better prices and improved system performance.
What challenges does the Commercial Vehicle Urea Tank Industry face during its growth?
- The escalating costs of high-density polyethylene pose a significant challenge to the expansion and growth of the industry.
- Commercial vehicle urea tanks are essential components for the operation of Selective Catalytic Reduction (SCR) systems, which reduce harmful emissions. The primary material used in manufacturing these tanks is high-density polyethylene (HDPE), due to its lightweight property. However, the use of heavier materials like stainless steel increases the weight of the tank, negatively impacting the vehicle's load-carrying capacity and fuel efficiency. The cost of manufacturing commercial vehicle urea tanks has risen due to the escalating cost of HDPE in the automotive industry.
- The demand for HDPE, particularly in the Asia Pacific region, has led to a significant increase in its price by approximately USD10/unit. This trend poses a challenge for the commercial vehicle industry, necessitating the exploration of alternative, cost-effective materials for urea tank manufacturing.
Exclusive Customer Landscape
The commercial vehicle urea tank market forecasting report includes the adoption lifecycle of the market, covering from the innovator's stage to the laggard's stage. It focuses on adoption rates in different regions based on penetration. Furthermore, the commercial vehicle urea tank market report also includes key purchase criteria and drivers of price sensitivity to help companies evaluate and develop their market growth analysis strategies.
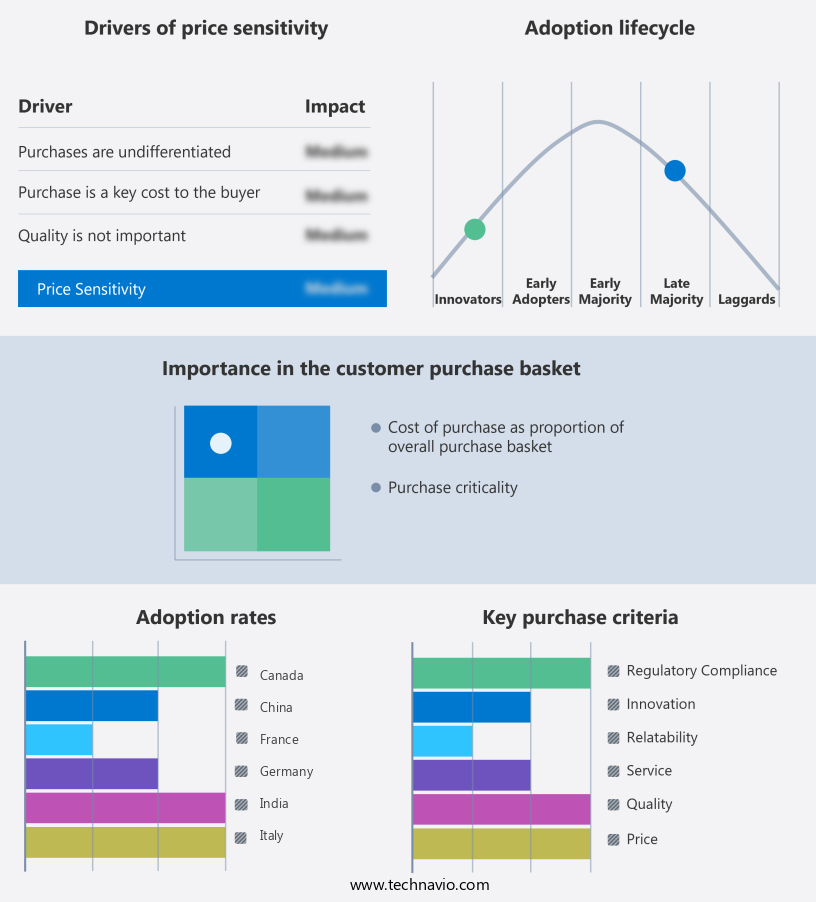
Customer Landscape
Key Companies & Market Insights
Companies are implementing various strategies, such as strategic alliances, commercial vehicle urea tank market forecast, partnerships, mergers and acquisitions, geographical expansion, and product/service launches, to enhance their presence in the industry.
ACGB France - Commercial vehicles require compliance with stringent emission regulations, such as EURO IV to EURO VI. To address this need, the company provides urea tanks for these applications.
The industry research and growth report includes detailed analyses of the competitive landscape of the market and information about key companies, including:
- ACGB France
- Amphenol Corp.
- Centro Inc.
- Cummins Inc.
- DGL Group LTD.
- Elkamet Kunststofftechnik GmbH
- Gemini Group Inc.
- KaiLong
- Kingspan Group Plc
- KUS Technology Corp.
- Myers Industries Inc.
- Robert Bosch GmbH
- Rochling SE and Co. KG
- Salzburger Aluminium AG
- Scania AB
- Shaw Development LLC
- Solar Plastics LLC
- The ITB Group Ltd.
- Yara International ASA
- Zhejiang Fomay Industrial Machinery Co. Ltd.
Qualitative and quantitative analysis of companies has been conducted to help clients understand the wider business environment as well as the strengths and weaknesses of key industry players. Data is qualitatively analyzed to categorize companies as pure play, category-focused, industry-focused, and diversified; it is quantitatively analyzed to categorize companies as dominant, leading, strong, tentative, and weak.
Recent Development and News in Commercial Vehicle Urea Tank Market
- In February 2023, Daimler Truck AG, the world's largest commercial vehicle manufacturer, announced the launch of its new urea tank system for heavy-duty trucks, named "BlueTec 6," which offers improved fuel efficiency and reduced emissions (Daimler Truck AG Press Release, 2023). This innovation is expected to significantly boost the demand for commercial vehicle urea tanks.
- In March 2024, Linde plc, a leading industrial gases provider, entered into a strategic partnership with Volvo Group to develop and supply urea solutions for Volvo's entire range of heavy-duty trucks (Linde plc Press Release, 2024). This collaboration aims to strengthen Linde's market position in the commercial vehicle urea tank industry.
- In July 2024, Cummins Inc., a global power solutions provider, completed the acquisition of Emission Solutions, a leading provider of aftermarket urea solutions and services (Cummins Inc. SEC Filing, 2024). This acquisition is expected to expand Cummins' product offerings and strengthen its presence in the market.
Research Analyst Overview
- The commercial vehicle urea market is characterized by a complex supply chain that impacts urea tank optimization and compliance. Regulations governing urea tank reliability and compatibility are crucial in ensuring safety and efficiency in the urea tank lifecycle. Urea tank standards and certification play a significant role in maintaining sustainability and durability, while urea tank performance and efficiency are key drivers of urea market dynamics. Urea tank automation and telematics enable real-time monitoring and optimization of urea distribution and transportation, reducing costs and enhancing operational efficiency. Urea technology advancements and innovations continue to shape the market, with a focus on integration and compatibility with various vehicle systems.
- Urea tank sustainability remains a top priority, with an increasing emphasis on reducing emissions and improving overall environmental performance. Price volatility in the urea market adds complexity to the tank lifecycle, necessitating effective management strategies. Overall, the urea tank market is dynamic and evolving, requiring continuous innovation and adaptation to meet the changing needs of the commercial vehicle industry.
Dive into Technavio's robust research methodology, blending expert interviews, extensive data synthesis, and validated models for unparalleled Commercial Vehicle Urea Tank Market insights. See full methodology.
|
Market Scope |
|
|
Report Coverage |
Details |
|
Page number |
233 |
|
Base year |
2024 |
|
Historic period |
2019-2023 |
|
Forecast period |
2025-2029 |
|
Growth momentum & CAGR |
Accelerate at a CAGR of 5% |
|
Market growth 2025-2029 |
USD 140.2 million |
|
Market structure |
Fragmented |
|
YoY growth 2024-2025(%) |
4.7 |
|
Key countries |
China, US, Japan, India, South Korea, Canada, Germany, UK, France, and Italy |
|
Competitive landscape |
Leading Companies, Market Positioning of Companies, Competitive Strategies, and Industry Risks |
What are the Key Data Covered in this Commercial Vehicle Urea Tank Market Research and Growth Report?
- CAGR of the Commercial Vehicle Urea Tank industry during the forecast period
- Detailed information on factors that will drive the growth and forecasting between 2025 and 2029
- Precise estimation of the size of the market and its contribution of the industry in focus to the parent market
- Accurate predictions about upcoming growth and trends and changes in consumer behaviour
- Growth of the market across APAC, North America, Europe, South America, and Middle East and Africa
- Thorough analysis of the market's competitive landscape and detailed information about companies
- Comprehensive analysis of factors that will challenge the commercial vehicle urea tank market growth of industry companies
We can help! Our analysts can customize this commercial vehicle urea tank market research report to meet your requirements.
 RIA -
RIA - 
