Compostable Plastic Market Analysis Europe, North America, APAC, South America, Middle East and Africa - US, Germany, UK, France, China - Size and Forecast 2024-2028

Compostable Plastic Market Analysis Europe, North America, APAC, South America, Middle East and Africa - US, Germany, UK, France, China - Size and Forecast 2024-2028

Published: Jun 2024 201 Pages SKU: IRTNTR75207

Market Overview at a Glance

$2.89 B
Market Opportunity
19.16%
CAGR
15.6
YoY growth 2023-2024(%)

Compostable Plastic Market Size 2024-2028 

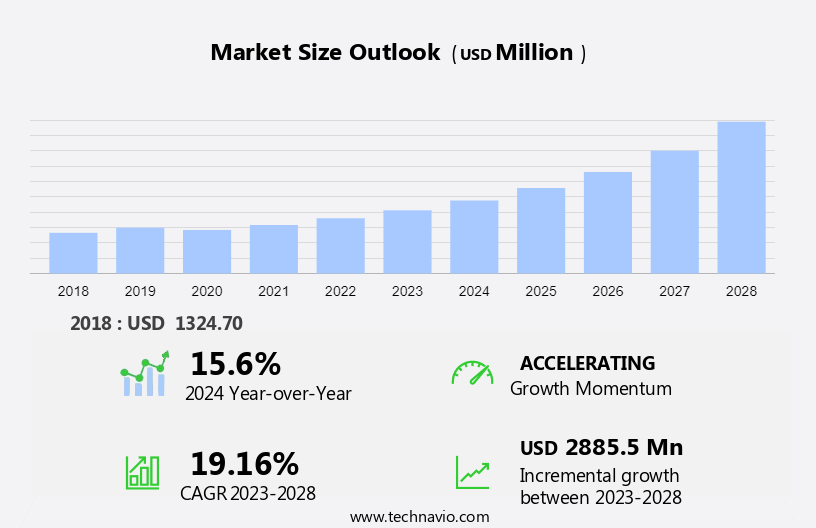
The compostable plastic market size is forecast to increase by USD 2.89 billion at a CAGR of 19.16% between 2023 and 2028. The market is experiencing significant growth due to increasing concerns over plastic pollution and the need for ethical waste management. This trend is particularly prominent in the e-commerce industry, where the demand for environmentally friendly packaging, shipping materials, and mailing bags is on the rise. As online shopping continues to rise, the carbon footprint of delivery services becomes a major concern. In response, governments and businesses are encouraging the adoption of compostable plastics as a sustainable alternative to conventional plastics. However, the high costs associated with compostable plastics remain a challenge, which may hinder their widespread adoption. Key market growth factors include the growing use of compostable packaging and government initiatives encouraging the replacement of conventional plastics. Despite the challenges, the benefits of compostable plastics in reducing plastic pollution make them an attractive option for businesses and consumers seeking to minimize their environmental impact.

Compostable Plastic Market Size

 Request Free Sample

The market for compostable plastics is gaining momentum due to increasing environmental concerns and governmental initiatives towards sustainable waste management. These eco-friendly alternatives to conventional plastics are made from biodegradable materials, such as polylactic acid (PLA) and starch-based plastics, which decompose naturally under specific conditions. Municipal waste management is a significant contributor to the compostable plastics market. As governments and organizations focus on reducing landfill waste and promoting green procurement policies, the demand for compostable plastic products, such as bags, containers, and silverware, is on the rise. Biobased products derived from renewable feedstocks like sugarcane and corn starch are increasingly replacing traditional polymers and petrochemical counterparts.

Furthermore, the extraction and refining processes for these plant-based materials and Aerobic and anaerobic decomposition are becoming more efficient, making them a cost-effective alternative to conventional plastics. The compostable plastics market is witnessing growth in various sectors, including electronics, medical, and consumer goods. In the electronics industry, compostable plastics are used in packaging and insulation materials. In the medical sector, they are used for disposable medical equipment and single-use medical devices. Consumer awareness regarding the environmental impact of plastic waste is also driving the demand for compostable plastic packaging in the food and beverage industry.  With rising environmental awareness, the demand for plant based materials and bio based materials is increasing, as they offer sustainable alternatives to traditional materials, reducing environmental impact and supporting a more eco-friendly future.

Market Segmentation

The market research report provides comprehensive data (region-wise segment analysis), with forecasts and estimates in "USD billion" for the period 2024-2028, as well as historical data from 2018-2022 for the following segments.

  • End-user
    • Packaging
    • Consumer goods
    • Textiles
    • Agriculture
    • Others
  • Product
    • Compostable bag
    • Compostable cutlery
    • Compostable gloves
    • Compostable straw
    • Others
  • Geography
    • Europe
      • Germany
      • UK
      • France
    • North America
      • US
    • APAC
      • China
    • South America
    • Middle East and Africa

By End-user Insights

The packaging segment is estimated to witness significant growth during the forecast period. Compostable plastics, also known as biodegradable plastics, have gained significant attention in the US market due to increasing governmental initiatives towards reducing municipal waste and promoting the use of biobased products. Two primary types of compostable packaging are rigid and flexible, which are utilized in various applications such as bottles, cups, pots, films, and bags. The food industry is a significant consumer of compostable packaging, with its usage in fresh food, dry snacks, candy, bakery goods, juice bottles, and meat trays. Additionally, compostable packaging is preferred for premium and branded products with specific requirements. According to industry reports, over 60% of bioplastics are used in packaging applications.

Furthermore, biodegradable plastics, including polylactic acid (PLA) and starch bags, are subjected to various standards such as BS N13432. These plastics are derived from renewable feedstocks like sugarcane and corn. Biobased packaging offers several advantages, including reduced carbon footprint and compatibility with existing recycling infrastructure. The US market for compostable plastics is expected to grow significantly due to increasing consumer awareness and governmental initiatives. 

Compostable Plastic Market Size

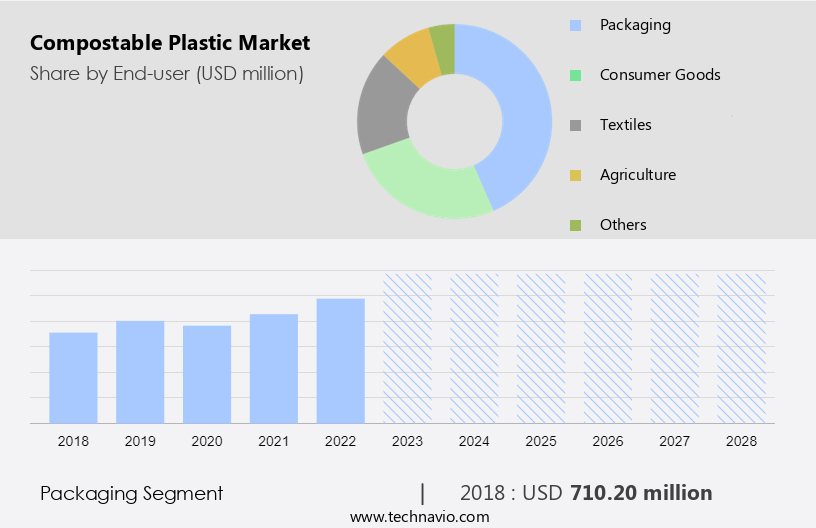
Get a glance at the market share of various segments Request Free Sample

The Packaging segment was valued at USD 710.20 million in 2018 and showed a gradual increase during the forecast period.

Regional Insights

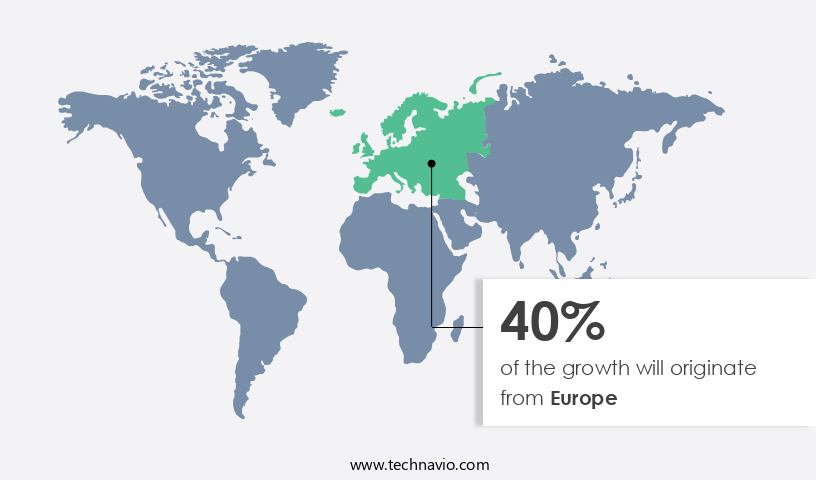
Europe is estimated to contribute 40% to the growth of the global market during the forecast period. Technavio's analysts have elaborately explained the regional trends and drivers that shape the market during the forecast period.

Compostable Plastic Market Share by Geography

For more insights on the market share of various regions Request Free Sample

The market in Europe holds a substantial share in the global industry due to the increasing consumer awareness and environmental concerns. The demand for eco-friendly alternatives to traditional plastic products, such as biodegradable sutures and drug delivery systems, is driving market growth. Europe's commitment to sustainability is further reinforced by governments establishing composting infrastructure to encourage the use of bioplastics. Germany and France are leading markets within Europe, with a significant number of medium and large-sized companies contributing to the industry. The German plastic industry comprises three main sectors: plastic materials production, plastic processing, and plastic machinery production. Key applications of compostable plastics include construction materials, biodegradable insulation, and niche products. As the market continues to expand, it is expected to bring about innovative solutions to address plastic waste concerns.

Our researchers analyzed the data with 2023 as the base year, along with the key drivers, trends, and challenges. A holistic analysis of drivers will help companies refine their marketing strategies to gain a competitive advantage.

Market Driver

Growing use of compostable packaging is the key driver of the market. Compostable plastic packaging has gained significant traction in the business world as a viable alternative to traditional single-use plastic packaging. With increasing environmental consciousness, there is a growing demand for eco-friendly solutions, leading to the compostable packaging industry's expansion.

Furthermore, this growth is driven by large corporations prioritizing sustainability, consumer preferences, and regulatory initiatives such as the EU Single-Use Plastics Directive. Compostable containers, silverware, and bags offer the advantage of biodegrading into carbon dioxide, water, inorganic compounds, and biomass, which can be used as natural fertilizers in agriculture. This end-of-life performance makes compostable packaging an attractive choice for restaurants, grocery shops, and other businesses seeking to reduce their environmental footprint.

Market Trends

Growing government initiatives encouraging replacement of conventional plastics with compostable plastics is the upcoming trend in the market. The global issue of plastic pollution has gained significant attention due to the alarming increase in plastic consumption, particularly in the packaging industry. The environmental impact of plastic use is evident at every stage of its life cycle. Governments and consumers are responding to this crisis by advocating for eco-friendly alternatives to traditional plastic packaging.

Furthermore, bioplastics, also known as compostable plastics, are gaining popularity due to their potential to reduce plastic waste and minimize environmental harm. However, the adoption of these materials is not without challenges. Durability and shelf life are critical considerations in the transportation and use of compostable packaging. Consumer education and labeling are essential to ensure proper disposal and maximize the benefits of using bioplastics. Material technology is advancing to address these challenges, with companies investing in research and development to improve the performance and sustainability of compostable plastics. As the market for compostable packaging continues to grow, it is important for stakeholders to work together to address the complexities of implementing this solution at scale.

Market Challenge

High costs of compostable plastics compared with conventional plastics is a key challenge affecting the market growth. Compostable plastic, an alternative to conventional plastic, is gaining traction in various industries due to growing concerns over plastic pollution and the need for ethical waste management. In the e-commerce sector, particularly online shopping, the demand for environmentally friendly packaging and shipping materials, including mailing bags, is on the rise. However, the production cost of compostable plastic is higher than that of conventional plastic, ranging from 25% to 75%, primarily due to the high polymerization cost. Additionally, most compostable plastic production processes are still in the development stage and have not yet reached economies of scale. Another challenge is the lack of a comprehensive supply chain network at upcoming capacity locations.

Furthermore, the technology behind compostable plastic production is not yet fully convincing as it is still in its infancy, with various raw materials being tested for optimal production. Despite these challenges, the market for compostable plastic is expected to grow as consumers and businesses prioritize reducing their carbon footprint and contributing to sustainable waste management solutions.

Exclusive Customer Landscape

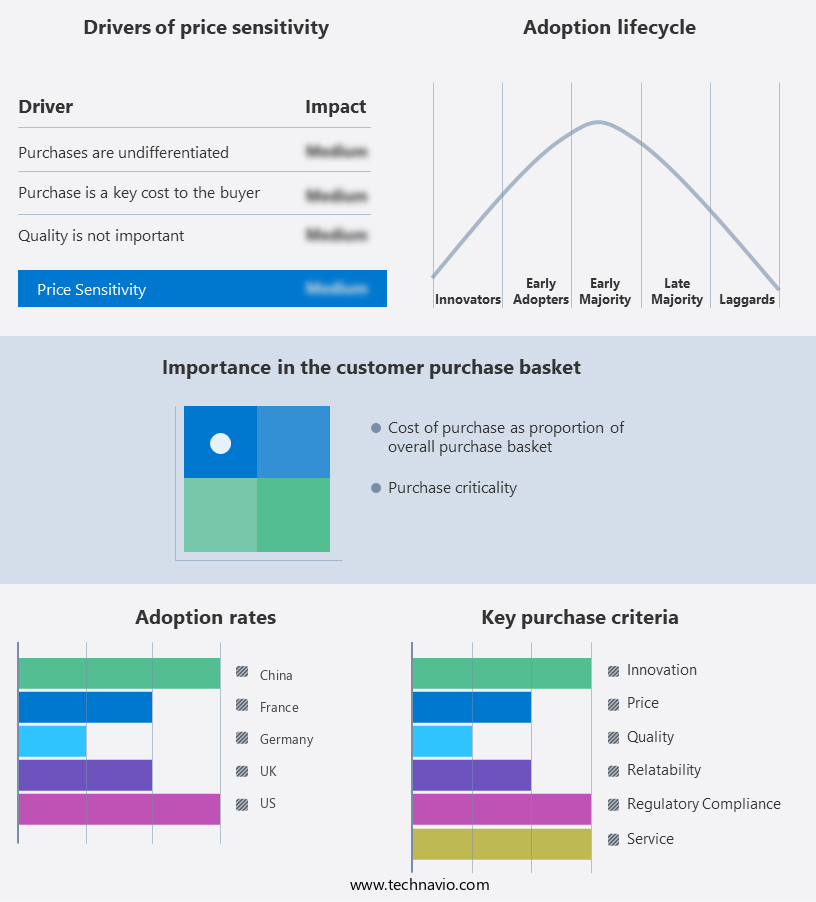
The market forecasting report includes the adoption lifecycle of the market, covering from the innovator's stage to the laggard's stage. It focuses on adoption rates in different regions based on penetration. Furthermore, the report also includes key purchase criteria and drivers of price sensitivity to help companies evaluate and develop their market growth analysis strategies.

Compostable Plastic Market Share by Geography

 Customer Landscape

Key Companies & Market Insights

Companies are implementing various strategies, such as strategic alliances, partnerships, mergers and acquisitions, geographical expansion, and product/service launches, to enhance their presence in the market.

Green Dot Bioplastics Inc. - The company focuses on offering bio-composites, biodegradable, elastomers, starch composites and wood composites. The key offerings of the company include compostable plastics under its brand RENEW.

The market research and growth report includes detailed analyses of the competitive landscape of the market and information about key companies, including:

  • BASF SE
  • BEWI ASA
  • Biome Technologies plc
  • BioTec Bags India Pvt. Ltd.
  • BOSK Bioproducts
  • Cargill Inc.
  • Danimer Scientific Inc.
  • Eastman Chemical Co.
  • Fkur Kunststoff GmbH
  • Futerro SA
  • Green Dot Bioplastics Inc.
  • Kaneka Corp.
  • KURARAY Co. Ltd.
  • Mitsubishi Chemical Corp.
  • Neste Corp.
  • Northern Technologies International Corp.
  • Novamont S.p.A.
  • SK Chemicals Co. Ltd.
  • Toray Industries Inc.
  • TotalEnergies SE
  • Trinseo PLC

Qualitative and quantitative analysis of companies has been conducted to help clients understand the wider business environment as well as the strengths and weaknesses of key market players. Data is qualitatively analyzed to categorize companies as pure play, category-focused, industry-focused, and diversified; it is quantitatively analyzed to categorize companies as dominant, leading, strong, tentative, and weak.

Research Analyst Overview

Biodegradable plastics have gained significant attention in recent years due to growing municipal waste and environmental concerns. The production of biodegradable plastics utilizes renewable feedstocks such as plant-based materials, including polylactic acid (PLA) derived from sugarcane feedstock, and starch bags. The biodegradable plastics market is driven by governmental initiatives and the increasing demand for eco-friendly alternatives to conventional plastics. The BS EN 13432 standard sets the criteria for compostable plastics, ensuring they biodegrade under controlled composting conditions. Biodegradable plastics are used in various industries, including electronics, medical, and construction, for applications such as biodegradable sutures, drug delivery systems, and insulation.

Consumer awareness and ethical waste management practices have led to the adoption of biodegradable plastics in sectors like restaurants, grocery shops, and the e-commerce industry for compostable packaging, silverware, bags, and shipping materials. The durability and shelf life of biodegradable plastics are comparable to their petrochemical counterparts, making them a viable alternative for various applications. The production of biodegradable plastics involves the extraction and refining of plant-based materials, which may include corn starch and the conversion of these materials into biobased polymers. The use of biodegradable plastics reduces plastic pollution and carbon footprint in transportation and material technology applications.

Market Scope

Report Coverage

Details

Page number

201

Base year

2023

Historic period

2018-2022

Forecast period

2024-2028

Growth momentum & CAGR

Accelerate at a CAGR of 19.16%

Market growth 2024-2028

USD 2.88 billion

Market structure

Fragmented

YoY growth 2023-2024(%)

15.6

Regional analysis

Europe, North America, APAC, South America, and Middle East and Africa

Performing market contribution

Europe at 40%

Key countries

US, Germany, UK, France, and China

Competitive landscape

Leading Companies, Market Positioning of Companies, Competitive Strategies, and Industry Risks

Key companies profiled

BASF SE, BEWI ASA, Biome Technologies plc, BioTec Bags India Pvt. Ltd., BOSK Bioproducts, Cargill Inc., Danimer Scientific Inc., Eastman Chemical Co., Fkur Kunststoff GmbH, Futerro SA, Green Dot Bioplastics Inc., Kaneka Corp., KURARAY Co. Ltd., Mitsubishi Chemical Corp., Neste Corp., Northern Technologies International Corp., Novamont S.p.A., SK Chemicals Co. Ltd., Toray Industries Inc., TotalEnergies SE, and Trinseo PLC

Market dynamics

Parent market analysis, market growth inducers and obstacles, market forecast, fast-growing and slow-growing segment analysis, COVID-19 impact and recovery analysis and future consumer dynamics, market condition analysis for the forecast period

Customization purview

If our market report has not included the data that you are looking for, you can reach out to our analysts and get segments customized.

Request Free Sample

What are the Key Data Covered in this Market Research and Growth Report?

  • CAGR of the market during the forecast period
  • Detailed information on factors that will drive the market growth and forecasting between 2024 and 2028
  • Precise estimation of the size of the market  and its contribution of the market in focus to the parent market
  • Accurate predictions about upcoming market growth and trends and changes in consumer behaviour
  • Growth of the market across Europe, North America, APAC, South America, and Middle East and Africa
  • Thorough analysis of the market's competitive landscape and detailed information about companies
  • Comprehensive analysis of factors that will challenge the growth of market companies

We can help! Our analysts can customize this market research report to meet your requirements. Get in touch

1 Executive Summary

  • 1.1 Market overview
    • Executive Summary - Chart on Market Overview
    • Executive Summary - Data Table on Market Overview
    • Executive Summary - Chart on Global Market Characteristics
    • Executive Summary - Chart on Market by Geography
    • Executive Summary - Chart on Market Segmentation by End-user
    • Executive Summary - Chart on Market Segmentation by Product
    • Executive Summary - Chart on Incremental Growth
    • Executive Summary - Data Table on Incremental Growth
    • Executive Summary - Chart on Company Market Positioning

2 Market Landscape

  • 2.1 Market ecosystem
    • Parent Market
    • Data Table on - Parent Market
  • 2.2 Market characteristics
    • Market characteristics analysis
  • 2.3 Value chain analysis
    • Value Chain Analysis

3 Market Sizing

  • 3.1 Market definition
    • Offerings of companies included in the market definition
  • 3.2 Market segment analysis
    • Market segments
  • 3.3 Market size 2023
    • 3.4 Market outlook: Forecast for 2023-2028
      • Chart on Global - Market size and forecast 2023-2028 ($ million)
      • Data Table on Global - Market size and forecast 2023-2028 ($ million)
      • Chart on Global Market: Year-over-year growth 2023-2028 (%)
      • Data Table on Global Market: Year-over-year growth 2023-2028 (%)

    4 Historic Market Size

    • 4.1 Global Compostable Plastic Market 2018 - 2022
      • Historic Market Size - Data Table on Global Compostable Plastic Market 2018 - 2022 ($ million)
    • 4.2 End-user segment analysis 2018 - 2022
      • Historic Market Size - End-user Segment 2018 - 2022 ($ million)
    • 4.3 Product segment analysis 2018 - 2022
      • Historic Market Size - Product Segment 2018 - 2022 ($ million)
    • 4.4 Geography segment analysis 2018 - 2022
      • Historic Market Size - Geography Segment 2018 - 2022 ($ million)
    • 4.5 Country segment analysis 2018 - 2022
      • Historic Market Size - Country Segment 2018 - 2022 ($ million)

    5 Five Forces Analysis

    • 5.1 Five forces summary
      • Five forces analysis - Comparison between 2023 and 2028
    • 5.2 Bargaining power of buyers
      • Bargaining power of buyers - Impact of key factors 2023 and 2028
    • 5.3 Bargaining power of suppliers
      • Bargaining power of suppliers - Impact of key factors in 2023 and 2028
    • 5.4 Threat of new entrants
      • Threat of new entrants - Impact of key factors in 2023 and 2028
    • 5.5 Threat of substitutes
      • Threat of substitutes - Impact of key factors in 2023 and 2028
    • 5.6 Threat of rivalry
      • Threat of rivalry - Impact of key factors in 2023 and 2028
    • 5.7 Market condition
      • Chart on Market condition - Five forces 2023 and 2028

    6 Market Segmentation by End-user

    • 6.1 Market segments
      • Chart on End-user - Market share 2023-2028 (%)
      • Data Table on End-user - Market share 2023-2028 (%)
    • 6.2 Comparison by End-user
      • Chart on Comparison by End-user
      • Data Table on Comparison by End-user
    • 6.3 Packaging - Market size and forecast 2023-2028
      • Chart on Packaging - Market size and forecast 2023-2028 ($ million)
      • Data Table on Packaging - Market size and forecast 2023-2028 ($ million)
      • Chart on Packaging - Year-over-year growth 2023-2028 (%)
      • Data Table on Packaging - Year-over-year growth 2023-2028 (%)
    • 6.4 Consumer goods - Market size and forecast 2023-2028
      • Chart on Consumer goods - Market size and forecast 2023-2028 ($ million)
      • Data Table on Consumer goods - Market size and forecast 2023-2028 ($ million)
      • Chart on Consumer goods - Year-over-year growth 2023-2028 (%)
      • Data Table on Consumer goods - Year-over-year growth 2023-2028 (%)
    • 6.5 Textiles - Market size and forecast 2023-2028
      • Chart on Textiles - Market size and forecast 2023-2028 ($ million)
      • Data Table on Textiles - Market size and forecast 2023-2028 ($ million)
      • Chart on Textiles - Year-over-year growth 2023-2028 (%)
      • Data Table on Textiles - Year-over-year growth 2023-2028 (%)
    • 6.6 Agriculture - Market size and forecast 2023-2028
      • Chart on Agriculture - Market size and forecast 2023-2028 ($ million)
      • Data Table on Agriculture - Market size and forecast 2023-2028 ($ million)
      • Chart on Agriculture - Year-over-year growth 2023-2028 (%)
      • Data Table on Agriculture - Year-over-year growth 2023-2028 (%)
    • 6.7 Others - Market size and forecast 2023-2028
      • Chart on Others - Market size and forecast 2023-2028 ($ million)
      • Data Table on Others - Market size and forecast 2023-2028 ($ million)
      • Chart on Others - Year-over-year growth 2023-2028 (%)
      • Data Table on Others - Year-over-year growth 2023-2028 (%)
    • 6.8 Market opportunity by End-user
      • Market opportunity by End-user ($ million)
      • Data Table on Market opportunity by End-user ($ million)

    7 Market Segmentation by Product

    • 7.1 Market segments
      • Chart on Product - Market share 2023-2028 (%)
      • Data Table on Product - Market share 2023-2028 (%)
    • 7.2 Comparison by Product
      • Chart on Comparison by Product
      • Data Table on Comparison by Product
    • 7.3 Compostable bag - Market size and forecast 2023-2028
      • Chart on Compostable bag - Market size and forecast 2023-2028 ($ million)
      • Data Table on Compostable bag - Market size and forecast 2023-2028 ($ million)
      • Chart on Compostable bag - Year-over-year growth 2023-2028 (%)
      • Data Table on Compostable bag - Year-over-year growth 2023-2028 (%)
    • 7.4 Compostable cutlery - Market size and forecast 2023-2028
      • Chart on Compostable cutlery - Market size and forecast 2023-2028 ($ million)
      • Data Table on Compostable cutlery - Market size and forecast 2023-2028 ($ million)
      • Chart on Compostable cutlery - Year-over-year growth 2023-2028 (%)
      • Data Table on Compostable cutlery - Year-over-year growth 2023-2028 (%)
    • 7.5 Compostable gloves - Market size and forecast 2023-2028
      • Chart on Compostable gloves - Market size and forecast 2023-2028 ($ million)
      • Data Table on Compostable gloves - Market size and forecast 2023-2028 ($ million)
      • Chart on Compostable gloves - Year-over-year growth 2023-2028 (%)
      • Data Table on Compostable gloves - Year-over-year growth 2023-2028 (%)
    • 7.6 Compostable straw - Market size and forecast 2023-2028
      • Chart on Compostable straw - Market size and forecast 2023-2028 ($ million)
      • Data Table on Compostable straw - Market size and forecast 2023-2028 ($ million)
      • Chart on Compostable straw - Year-over-year growth 2023-2028 (%)
      • Data Table on Compostable straw - Year-over-year growth 2023-2028 (%)
    • 7.7 Others - Market size and forecast 2023-2028
      • Chart on Others - Market size and forecast 2023-2028 ($ million)
      • Data Table on Others - Market size and forecast 2023-2028 ($ million)
      • Chart on Others - Year-over-year growth 2023-2028 (%)
      • Data Table on Others - Year-over-year growth 2023-2028 (%)
    • 7.8 Market opportunity by Product
      • Market opportunity by Product ($ million)
      • Data Table on Market opportunity by Product ($ million)

    8 Customer Landscape

    • 8.1 Customer landscape overview
      • Analysis of price sensitivity, lifecycle, customer purchase basket, adoption rates, and purchase criteria

    9 Geographic Landscape

    • 9.1 Geographic segmentation
      • Chart on Market share by geography 2023-2028 (%)
      • Data Table on Market share by geography 2023-2028 (%)
    • 9.2 Geographic comparison
      • Chart on Geographic comparison
      • Data Table on Geographic comparison
    • 9.3 Europe - Market size and forecast 2023-2028
      • Chart on Europe - Market size and forecast 2023-2028 ($ million)
      • Data Table on Europe - Market size and forecast 2023-2028 ($ million)
      • Chart on Europe - Year-over-year growth 2023-2028 (%)
      • Data Table on Europe - Year-over-year growth 2023-2028 (%)
    • 9.4 North America - Market size and forecast 2023-2028
      • Chart on North America - Market size and forecast 2023-2028 ($ million)
      • Data Table on North America - Market size and forecast 2023-2028 ($ million)
      • Chart on North America - Year-over-year growth 2023-2028 (%)
      • Data Table on North America - Year-over-year growth 2023-2028 (%)
    • 9.5 APAC - Market size and forecast 2023-2028
      • Chart on APAC - Market size and forecast 2023-2028 ($ million)
      • Data Table on APAC - Market size and forecast 2023-2028 ($ million)
      • Chart on APAC - Year-over-year growth 2023-2028 (%)
      • Data Table on APAC - Year-over-year growth 2023-2028 (%)
    • 9.6 South America - Market size and forecast 2023-2028
      • Chart on South America - Market size and forecast 2023-2028 ($ million)
      • Data Table on South America - Market size and forecast 2023-2028 ($ million)
      • Chart on South America - Year-over-year growth 2023-2028 (%)
      • Data Table on South America - Year-over-year growth 2023-2028 (%)
    • 9.7 Middle East and Africa - Market size and forecast 2023-2028
      • Chart on Middle East and Africa - Market size and forecast 2023-2028 ($ million)
      • Data Table on Middle East and Africa - Market size and forecast 2023-2028 ($ million)
      • Chart on Middle East and Africa - Year-over-year growth 2023-2028 (%)
      • Data Table on Middle East and Africa - Year-over-year growth 2023-2028 (%)
    • 9.8 US - Market size and forecast 2023-2028
      • Chart on US - Market size and forecast 2023-2028 ($ million)
      • Data Table on US - Market size and forecast 2023-2028 ($ million)
      • Chart on US - Year-over-year growth 2023-2028 (%)
      • Data Table on US - Year-over-year growth 2023-2028 (%)
    • 9.9 Germany - Market size and forecast 2023-2028
      • Chart on Germany - Market size and forecast 2023-2028 ($ million)
      • Data Table on Germany - Market size and forecast 2023-2028 ($ million)
      • Chart on Germany - Year-over-year growth 2023-2028 (%)
      • Data Table on Germany - Year-over-year growth 2023-2028 (%)
    • 9.10 UK - Market size and forecast 2023-2028
      • Chart on UK - Market size and forecast 2023-2028 ($ million)
      • Data Table on UK - Market size and forecast 2023-2028 ($ million)
      • Chart on UK - Year-over-year growth 2023-2028 (%)
      • Data Table on UK - Year-over-year growth 2023-2028 (%)
    • 9.11 France - Market size and forecast 2023-2028
      • Chart on France - Market size and forecast 2023-2028 ($ million)
      • Data Table on France - Market size and forecast 2023-2028 ($ million)
      • Chart on France - Year-over-year growth 2023-2028 (%)
      • Data Table on France - Year-over-year growth 2023-2028 (%)
    • 9.12 China - Market size and forecast 2023-2028
      • Chart on China - Market size and forecast 2023-2028 ($ million)
      • Data Table on China - Market size and forecast 2023-2028 ($ million)
      • Chart on China - Year-over-year growth 2023-2028 (%)
      • Data Table on China - Year-over-year growth 2023-2028 (%)
    • 9.13 Market opportunity by geography
      • Market opportunity by geography ($ million)
      • Data Tables on Market opportunity by geography ($ million)

    10 Drivers, Challenges, and Opportunity/Restraints

    • 10.1 Market drivers
      • 10.2 Market challenges
        • 10.3 Impact of drivers and challenges
          • Impact of drivers and challenges in 2023 and 2028
        • 10.4 Market opportunities/restraints

          11 Competitive Landscape

          • 11.1 Overview
            • 11.2 Competitive Landscape
              • Overview on criticality of inputs and factors of differentiation
            • 11.3 Landscape disruption
              • Overview on factors of disruption
            • 11.4 Industry risks
              • Impact of key risks on business

            12 Competitive Analysis

            • 12.1 Companies profiled
              • Companies covered
            • 12.2 Market positioning of companies
              • Matrix on companies position and classification
            • 12.3 BASF SE
              • BASF SE - Overview
              • BASF SE - Business segments
              • BASF SE - Key news
              • BASF SE - Key offerings
              • BASF SE - Segment focus
            • 12.4 BEWI ASA
              • BEWI ASA - Overview
              • BEWI ASA - Business segments
              • BEWI ASA - Key news
              • BEWI ASA - Key offerings
              • BEWI ASA - Segment focus
            • 12.5 Biome Technologies plc
              • Biome Technologies plc - Overview
              • Biome Technologies plc - Business segments
              • Biome Technologies plc - Key offerings
              • Biome Technologies plc - Segment focus
            • 12.6 Cargill Inc.
              • Cargill Inc. - Overview
              • Cargill Inc. - Product / Service
              • Cargill Inc. - Key news
              • Cargill Inc. - Key offerings
            • 12.7 Danimer Scientific Inc.
              • Danimer Scientific Inc. - Overview
              • Danimer Scientific Inc. - Product / Service
              • Danimer Scientific Inc. - Key offerings
            • 12.8 Futerro SA
              • Futerro SA - Overview
              • Futerro SA - Product / Service
              • Futerro SA - Key offerings
            • 12.9 Green Dot Bioplastics Inc.
              • Green Dot Bioplastics Inc. - Overview
              • Green Dot Bioplastics Inc. - Product / Service
              • Green Dot Bioplastics Inc. - Key offerings
            • 12.10 Kaneka Corp.
              • Kaneka Corp. - Overview
              • Kaneka Corp. - Business segments
              • Kaneka Corp. - Key news
              • Kaneka Corp. - Key offerings
              • Kaneka Corp. - Segment focus
            • 12.11 KURARAY Co. Ltd.
              • KURARAY Co. Ltd. - Overview
              • KURARAY Co. Ltd. - Business segments
              • KURARAY Co. Ltd. - Key news
              • KURARAY Co. Ltd. - Key offerings
              • KURARAY Co. Ltd. - Segment focus
            • 12.12 Mitsubishi Chemical Corp.
              • Mitsubishi Chemical Corp. - Overview
              • Mitsubishi Chemical Corp. - Business segments
              • Mitsubishi Chemical Corp. - Key offerings
              • Mitsubishi Chemical Corp. - Segment focus
            • 12.13 Northern Technologies International Corp.
              • Northern Technologies International Corp. - Overview
              • Northern Technologies International Corp. - Business segments
              • Northern Technologies International Corp. - Key offerings
              • Northern Technologies International Corp. - Segment focus
            • 12.14 Novamont S.p.A.
              • Novamont S.p.A. - Overview
              • Novamont S.p.A. - Product / Service
              • Novamont S.p.A. - Key offerings
            • 12.15 SK Chemicals Co. Ltd.
              • SK Chemicals Co. Ltd. - Overview
              • SK Chemicals Co. Ltd. - Product / Service
              • SK Chemicals Co. Ltd. - Key news
              • SK Chemicals Co. Ltd. - Key offerings
            • 12.16 Toray Industries Inc.
              • Toray Industries Inc. - Overview
              • Toray Industries Inc. - Business segments
              • Toray Industries Inc. - Key news
              • Toray Industries Inc. - Key offerings
              • Toray Industries Inc. - Segment focus
            • 12.17 TotalEnergies SE
              • TotalEnergies SE - Overview
              • TotalEnergies SE - Business segments
              • TotalEnergies SE - Key news
              • TotalEnergies SE - Key offerings
              • TotalEnergies SE - Segment focus

            13 Appendix

            • 13.1 Scope of the report
              • 13.2 Inclusions and exclusions checklist
                • Inclusions checklist
                • Exclusions checklist
              • 13.3 Currency conversion rates for US$
                • Currency conversion rates for US$
              • 13.4 Research methodology
                • Research methodology
              • 13.5 Data procurement
                • Information sources
              • 13.6 Data validation
                • Data validation
              • 13.7 Validation techniques employed for market sizing
                • Validation techniques employed for market sizing
              • 13.8 Data synthesis
                • Data synthesis
              • 13.9 360 degree market analysis
                • 360 degree market analysis
              • 13.10 List of abbreviations
                • List of abbreviations

              Research Methodology

              Technavio presents a detailed picture of the market by way of study, synthesis, and summation of data from multiple sources. The analysts have presented the various facets of the market with a particular focus on identifying the key industry influencers. The data thus presented is comprehensive, reliable, and the result of extensive research, both primary and secondary.

              INFORMATION SOURCES

              Primary sources

              • Manufacturers and suppliers
              • Channel partners
              • Industry experts
              • Strategic decision makers

              Secondary sources

              • Industry journals and periodicals
              • Government data
              • Financial reports of key industry players
              • Historical data
              • Press releases

              DATA ANALYSIS

              Data Synthesis

              • Collation of data
              • Estimation of key figures
              • Analysis of derived insights

              Data Validation

              • Triangulation with data models
              • Reference against proprietary databases
              • Corroboration with industry experts

              REPORT WRITING

              Qualitative

              • Market drivers
              • Market challenges
              • Market trends
              • Five forces analysis

              Quantitative

              • Market size and forecast
              • Market segmentation
              • Geographical insights
              • Competitive landscape

              Interested in this report?

              Get your sample now to see our research methodology and insights!

              Download Now

              Frequently Asked Questions

              Compostable Plastic market growth will increase by $ 2885.5 mn during 2024-2028.

              The Compostable Plastic market is expected to grow at a CAGR of 19.16% during 2024-2028.

              Compostable Plastic market is segmented by End-user( Packaging, Consumer goods, Textiles, Agriculture, Others) Product( Compostable bag, Compostable cutlery, Compostable gloves, Compostable straw, Others)

              BASF SE, BEWI ASA, Biome Technologies plc, BioTec Bags India Pvt. Ltd., BOSK Bioproducts, Cargill Inc., Danimer Scientific Inc., Eastman Chemical Co., Fkur Kunststoff GmbH, Futerro SA, Green Dot Bioplastics Inc., Kaneka Corp., KURARAY Co. Ltd., Mitsubishi Chemical Corp., Neste Corp., Northern Technologies International Corp., Novamont S.p.A., SK Chemicals Co. Ltd., Toray Industries Inc., TotalEnergies SE, Trinseo PLC are a few of the key vendors in the Compostable Plastic market.

              Europe will register the highest growth rate of 40% among the other regions. Therefore, the Compostable Plastic market in Europe is expected to garner significant business opportunities for the vendors during the forecast period.

              US, Germany, UK, France, China

              • Growing use of compostable packagingLarge corporations are switching to compostable packaging because they see it as a direct replacement for the current single-use plastic packaging. The compostable packaging industry had a value of US$ 104 billion in 2023 is the driving factor this market.
              • and by 2027 is the driving factor this market.
              • it is projected to have grown by  6.35% annually to reach US$ 198 billion. This growth has been fueled by multinational corporations (MNCs) putting more emphasis on sustainability is the driving factor this market.
              • growing consumer concerns is the driving factor this market.
              • and legislation such as the EU Single-Use Plastics Directive banning the use of single-use plastics.Due to its end-of-life performance is the driving factor this market.
              • which allows for the materials to be broken down by microorganisms into carbon dioxide is the driving factor this market.
              • water is the driving factor this market.
              • inorganic compounds is the driving factor this market.
              • and biomass that can be used as natural fertilizers for agriculture is the driving factor this market.
              • compostable packaging is growing in popularity. This happens at a rate typical of similar organic materials is the driving factor this market.
              • and the process is typically given a time limit is the driving factor this market.
              • approximately 180 days.Compostable packaging offers a great sustainable option in certain circumstances is the driving factor this market.
              • enabling a route to end-of-life without enduring environmental pollution. Particularly is the driving factor this market.
              • those produced using renewable resources or is the driving factor this market.
              • better yet is the driving factor this market.
              • recycled materials are more in line with the circular economy. A high-quality finished compost acts as a natural fertilizer is the driving factor this market.
              • enriching the soil is the driving factor this market.
              • assisting in the retention of moisture is the driving factor this market.
              • and thwarting pests and plant diseases. Additionally is the driving factor this market.
              • it lessens the need for chemical fertilizers is the driving factor this market.
              • many of which have negative environmental effects. Thus is the driving factor this market.
              • the growing use of compostable packaging is one of the major drivers is the driving factor this market.
              • which are expected to drive the growth of the global compostable plastic market during the forecast period. is the driving factor this market.

              The Compostable Plastic market vendors should focus on grabbing business opportunities from the Packaging segment as it accounted for the largest market share in the base year.
              RIA - Research AI Assistant
              Ask RIA