Compound Semiconductor Market Analysis APAC, North America, Europe, South America, Middle East and Africa - US, China, Japan, South Korea, Germany - Size and Forecast 2024-2028

Compound Semiconductor Market Analysis APAC, North America, Europe, South America, Middle East and Africa - US, China, Japan, South Korea, Germany - Size and Forecast 2024-2028

Published: Feb 2024 186 Pages SKU: IRTNTR44692

Market Overview at a Glance

$17.56 B
Market Opportunity
7.03%
CAGR
6.59
YoY growth 2023-2024(%)

Compound Semiconductor Market Size 2024-2028

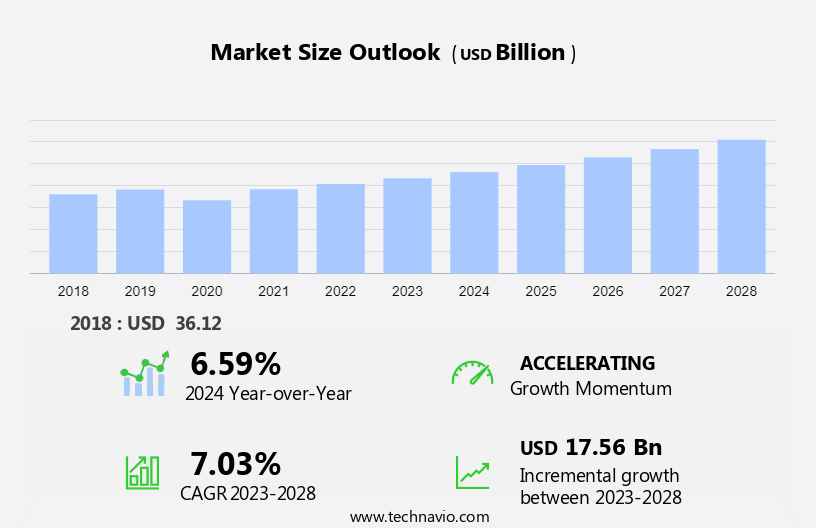
The compound semiconductor market size is forecast to increase by USD 17.56 billion at a CAGR of 7.03% between 2023 and 2028. The market's growth rate hinges on various factors, notably the escalating demand for enhanced power density, driven by technological advancements and the proliferation of portable devices. Additionally, the rising adoption of smartphones fuels market expansion, reflecting increased consumer reliance on mobile technology. Moreover, the growing need for enhanced communication networks, driven by evolving connectivity requirements, contributes significantly to market growth, shaping the trajectory of the industry.

The market growth and forecasting report includes key player's detailed analyses of the competitive landscape of the market and information about 20 market companies, including Broadcom Inc., Infineon Technologies AG, IQE Plc, Microchip Technology Inc., Micron Technology Inc., Mitsubishi Electric Corp., Nichia Corp., NXP Semiconductors NV, Qorvo Inc., Qualcomm Inc., Renesas Electronics Corp., Samsung Electronics Co. Ltd., Skyworks Solutions Inc., Sony Group Corp., STMicroelectronics International NV, Texas Instruments Inc., Toshiba Corp., and Wolfspeed Inc. Additionally, Advanced Wireless Semiconductor Co. s key company, offers compound semiconductor such as InGaP HBT, Switch pHEMT, Cu Pillar Bump, 0.5um ED pHEMT, 0.25um ED pHEMT, 0.15um E pHEMT, 0.25um ED BiHEMT, and VCSEL.

What will be the Size of the Market During the Forecast Period?

Compound Semiconductor Market Size

For More Highlights About this Report, Download Free Sample in a Minute 

Market Segmentation By Type, End-user and Geography

The Compound Semiconductor Market exhibits a diverse landscape shaped by various factors. Expenditure in research and development drives innovation, particularly in sectors like aerospace and medical applications. These semiconductors boast superior conductivity and thermal conductivity, critical for advancements such as miniaturization and battery-powered products. The advent of 5G technology underscores the demand for efficient amplifiers and transmission systems. However, challenges such as addressing production complexities persist, highlighting the need for continuous innovation in the market.

Type Analysis

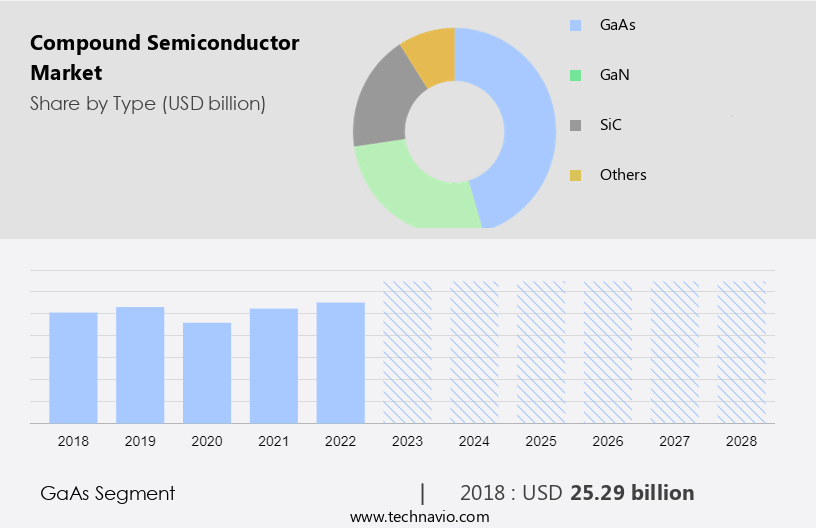
The GaAs segment is estimated to witness significant growth during the forecast period. The growth of this segment is fuelled by the enhanced durability, efficient power consumption, and superior performance of GaAs components. In addition, these benefits make these components an attractive solution in sectors such as consumer electronics and communications. Furthermore, this will ultimately increase market revenue during the forecast period. However, the share of GaAs components, such as amplifiers and switches, is expected to decline. 

Compound Semiconductor Market Size

Get a glance at the market contribution of various segments Download the PDF Sample

The GaAs segment was the largest segment and was valued at USD 25.29 billion in 2018. Moreover, this is primarily due to the saturation of the global smartphone market, which is a major revenue contributor for GaAs components. In addition, GaAs-based semiconductors hold a major share of the global compound semiconductor market. Furthermore, this is because they are widely used in smartphones and have witnessed a high demand in recent years, proportionally with the growth of the smartphone industry. In addition, the need for GaA components is rising because of the rapid development of wireless communication devices. Hence, such factors are fuelling the growth of this segment which in turn drives the market during the forecast period.

End-user Analysis 

The growing adoption of smartphones will fuel the consumer electronics segment, which in turn will increase the market. Smartphones comprise power amplifiers and switches that generally use GaAs. In addition, with the increasing global smartphone shipments, the demand for GaAs components will also rise during the forecast period. Most of the content in a handset is made of silicon, but power amplifiers and switches use GaAs devices. Moreover, prominent smartphone vendors, such as Apple and Samsung Electronics, are increasingly using GaAs-based amplifiers and switches in their new products. In addition, consumer electronic devices are the largest source of energy consumption. Hence, such factors are fuelling this segment which in turn drives the market during the forecast period.

Regional Overview

Compound Semiconductor Market Share by Geography

For more insights on the market share of various regions Download PDF Sample now!

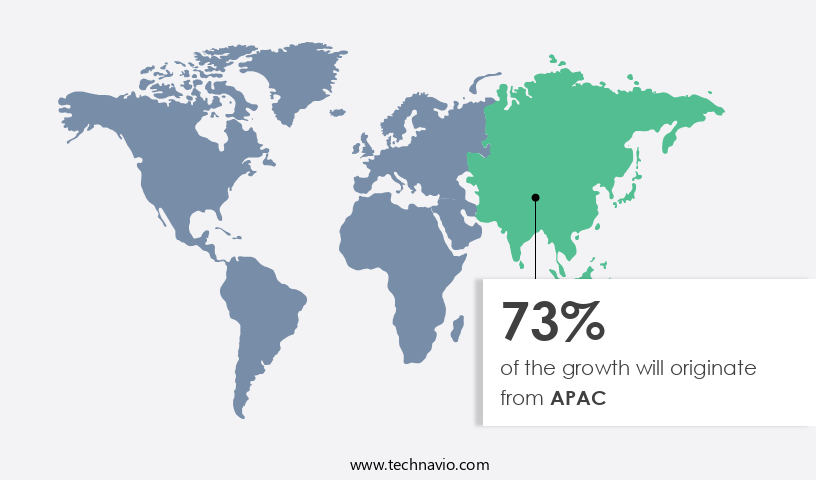
APAC is estimated to contribute 73% to the growth of the global market during the forecast period. Technavio's analysts have provided extensive insight into the market forecast, detailing the regional trends and drivers influencing the market's trajectory throughout the forecast period. The growing urbanization coupled with stable economic growth, the increasing presence of automotive manufacturers, coupled with the increasing demand for advanced automobiles, the growing demand for semiconductors from the aerospace, electronics, and other end-user industries in developing countries such as China and India, and the presence of global and local companies are the major factors driving the market in APAC. In addition, the demand in the urban population, coupled with stable economic growth, has increased the demand for passenger cars integrated with advanced automotive components such as silicon carbide (SiC) for energy efficiency, which is fueling the compound semiconductor market in the region. Moreover, automobile manufacturers such as Mahindra and Mahindra Ltd., Tata Motors Ltd., Isuzu Motors Ltd., Mitsubishi Motors Corp., Nissan Motor Co. Ltd., and Suzuki Motor Corp. have a major presence in APAC. Hence, such factors are driving the market in APAC during the forecast period.

Market Dynamics and Customer Landscape

The compound semiconductor market is experiencing significant growth across various sectors including telecommunications, electronics, and consumer goods. group III-V segment and group IV-IV segment, along with materials like Gallium Phosphide (GaP), are pivotal in the development of high-performance devices for wireless communication technologies and power electronics. These semiconductors, known for their superior breakdown electric field strength and suitability for high-voltage applications, are crucial in RF components, solar inverters, and power supplies. The GaN ecosystem and silicon-based devices drive innovation in the compound semiconductor industry, addressing the increasing device complexity and performance demands in sectors such as Defense & Aerospace, Healthcare, and Information and Communication Technology. As the demand for advanced semiconductor wafers and epitaxial materials grows, the compound semiconductor market continues to expand globally.

Key Market Driver

The market is witnessing robust growth, driven by escalating demand for superior power density across various industries like the automotive, aerospace, and consumer electronics sectors. This demand surge is fueled by the need for heightened productivity and additional functionalities in compound semiconductor applications, necessitating elevated power densities. Compound semiconductor materials, renowned for their unique properties, including high temperature resistance and thermal conductivity, are pivotal in addressing these requirements, particularly in critical sectors like aerospace and medical industries. As the industry continues its trajectory towards miniaturization and adopts technologies like 5G, the importance of compound semiconductors becomes even more pronounced. This dynamic landscape, marked by increased expenditure and evolving semiconductor requirements, is driving the market growth significantly during the forecast period, with technological advancements and innovation in electric vehicles and LED technology playing crucial roles.

Significant Market Trends

The growing adoption of renewable energy sources is an emerging trend in the market. The growing focus on renewable energy sources will fuel the market. In addition, renewable energy is expected to produce more than one-fourth of global gross power generation. Furthermore, governments in several countries are making renewable energy a part of their long-term development strategies.

Moreover, the expense of renewable sources such as solar and wind energy has been reduced by more than 50% over the past decade because of technological improvements and economies of scale. In addition, this tremendous implementation of renewable electricity sources is inducing opportunities for business for compound semiconductors, especially SiC devices and GaN. Furthermore, several other countries are deploying ways to encourage clean energy production as it helps in reducing the carbon footprint. Hence, such factors are driving the market growth during the forecast period.

Major Market Restrain

Manufacturing complexities of compound semiconductors are a major challenge hindering the market. Compound semiconductor technology has a complex manufacturing procedure that needs high-end equipment and highly skilled labor. In addition, companies need to invest heavily in R&D to solve complexities regarding manufacturing and mass production to address the rising demand for compound semiconductors and to get the benefit of economies of scale.

Moreover, compound semiconductor fabrication requires many processing steps, starting with the preparation of substrates. In addition, the following processing steps may include the epitaxial growth of a thin semiconductor layer, etching and lithography, ion implantation, deposition techniques, and deposition of metallic conductors. Furthermore, compound semiconductors require special crystal growth methods and processing procedures for further development. Hence, such factors are hindering the market during the forecast period.

Market Customer Landscape

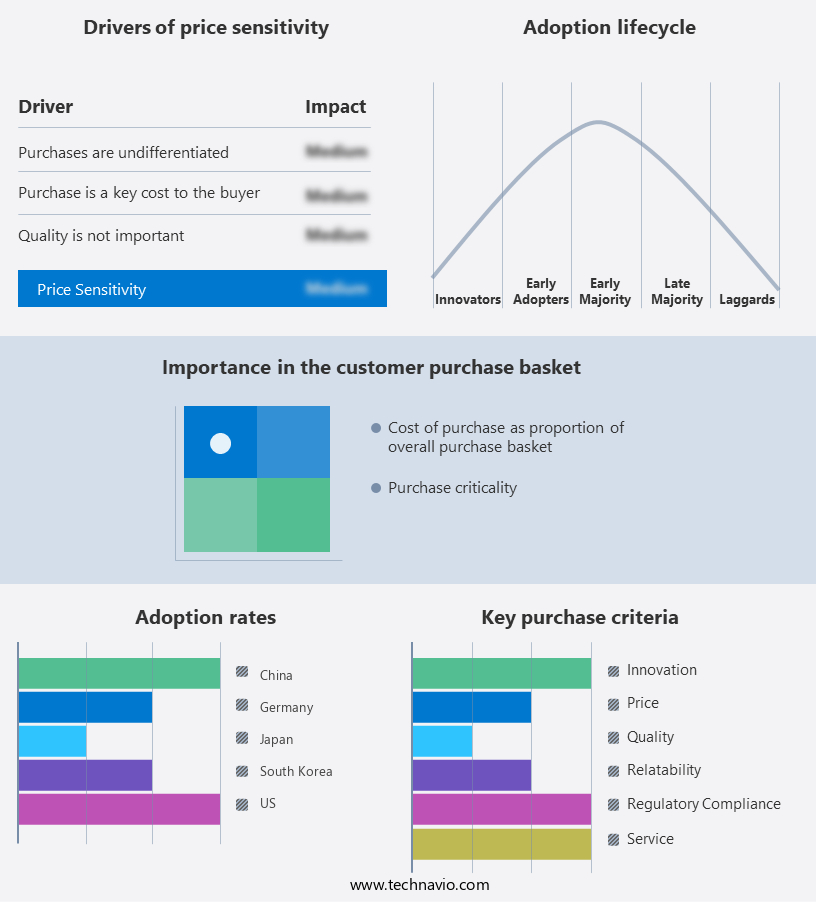
The market forecasting report includes the adoption lifecycle of the market research and growth, covering from the innovator’s stage to the laggard’s stage. It focuses on adoption rates in different regions based on penetration. Furthermore, the report also includes key purchase criteria and drivers of price sensitivity to help companies evaluate and develop their market growth and trends strategies.

Compound Semiconductor Market Share by Geography

Global Market Customer Landscape

MarketPlayers

Companies are implementing various strategies, such as strategic alliances, partnerships, mergers and acquisitions, geographical expansion, and product/service launches, to enhance their presence in the market.

AXT Inc: The company offers compound semiconductors for major electronic and opto electronic applications and a line of industry critical raw materials.

Market analysis and report of qualitative and quantitative analysis of companies has been conducted to help clients understand the wider business environment as well as the strengths and weaknesses of key market players. Data is qualitatively analyzed to categorize companies as pure play, category-focused, industry-focused, and diversified; it is quantitatively analyzed to categorize companies as dominant, leading, strong, tentative, and weak.

Segment Overview

The market research report provides comprehensive data (region wise segment analysis), with forecasts and estimates in "USD Billion" for the period 2024-2028, as well as historical data from 2018-2022 for the following segments.

  • Type Outlook
    • GaAs
    • GaN
    • SiC
    • Others
  • End-user Outlook
    • Consumer electronics
    • Communications
    • Defense and aerospace
    • Automotive
    • Others
  • Region Outlook
    • North America
      • The U.S.
      • Canada
    • Europe
      • The U.K.
      • Germany
      • France
      • Rest of Europe
    • APAC
      • China
      • India
    • South America
      • Chile
      • Argentina
      • Brazil
    • Middle East & Africa
      • Saudi Arabia
      • South Africa
      • Rest of the Middle East & Africa

You may also be interested in:

  • Semiconductor Market - Semiconductor Market Analysis North America, APAC, Europe, Middle East and Africa, South America - US, China, India, Germany, France - Size and Forecast
  • Vietnam - Semiconductors Market - Vietnam - Semiconductors Market by Application, End-user, and Device - Forecast and Analysis
  • Semiconductor Manufacturing Equipment Market - Semiconductor Manufacturing Equipment Market Analysis APAC, Europe, North America, Middle East and Africa, South America - US, China, India, Taiwan, Germany - Size and Forecast 

Market Analyst Overview

The market is experiencing a surge in demand driven by innovation in electric vehicles (EVs), renewable energy industry, and wireless communications. Key drivers include investment in semiconductor fabrication facilities and government initiatives promoting infrastructure development and green charger stations. These initiatives are bolstered by investments from commercial enterprises and government in 5G networks and IoT adoption. The market sees a rise in compound semiconductors like gallium nitride (GAN) and gallium arsenide (GaAs), offering high electron mobility and heat resistance. Moreover, integration of semiconductor components in smart technologies and wearable technology is driving market growth. With unique properties like temperature stability and wide bandgap, compound semiconductors are poised to revolutionize industries ranging from consumer electronics to aerospace & defense. The Automotive industry, Aerospace industry, and consumer electronics industries, along with factory floor operations, rely on various elements. Key driving factors in these sectors include innovation, demand for efficiency, and technological advancements. Understanding the Periodic Table of Elements is crucial for optimizing processes and developing cutting-edge products in these fields.

Moreover, the market is experiencing substantial growth, driven by a myriad of factors across industries such as aerospace, automobile, consumer electronics, and solar photovoltaic energy. Key drivers include advancements in Gallium Nitride (GaN)-based transistors, high electron mobility transistors (HEMTs), and optoelectronic components. Innovations in atomic layer deposition (ALD) and chemical vapor deposition (CVD) enable precise fabrication of semiconductor materials like Gallium Phosphide (GAP) and Indium Phosphide (INP). This market growth is further propelled by investments in semiconductor fabrication facilities, facilitating the production of cutting-edge integrated circuits (ICs) and radio frequency devices. Additionally, the proliferation of 5G subscriptions and Internet of Things (IoT) devices drives demand for wide bandgap semiconductors and high-frequency components. With everlight on the horizon, the compound semiconductor market continues to expand, offering solutions for edge computing systems, optical data processing, and quantum computing technologies.

Market Scope

Report Coverage

Details

Page number

186

Base year

2023

Historic period

2018-2022

Forecast period

2024-2028

Growth momentum & CAGR

Accelerate at a CAGR of 7.03%

Market Growth 2024-2028

USD 17.56 billion

Market structure

Fragmented

YoY growth 2023-2024(%)

6.59

Regional analysis

APAC, North America, Europe, South America, and the Middle East and Africa

Performing market contribution

APAC at 73%

Key countries

US, China, Japan, South Korea, and Germany

Competitive landscape

Leading Companies, Market Positioning of Companies, Competitive Strategies, and Industry Risks

Key companies profiled

Advanced Wireless Semiconductor Co., AXT Inc., Broadcom Inc., Infineon Technologies AG, IQE Plc, Microchip Technology Inc., Micron Technology Inc., Mitsubishi Electric Corp., Nichia Corp., NXP Semiconductors NV, Qorvo Inc., Qualcomm Inc., Renesas Electronics Corp., Samsung Electronics Co. Ltd., Skyworks Solutions Inc., Sony Group Corp., STMicroelectronics International NV, Texas Instruments Inc., Toshiba Corp., and Wolfspeed Inc.

Market dynamics

Parent market analysis, Market growth inducers and obstacles, Fast-growing and slow-growing segment analysis, COVID-19 impact and recovery analysis and future consumer dynamics, and Market condition analysis for the forecast period.

Customization purview

If our report has not included the data that you are looking for, you can reach out to our analysts and get segments customized.

Download PDF Sample

What are the Key Data Covered in this Compound Semiconductor Market Research Report?

  • CAGR of the market report forecast during the forecast period
  • Detailed information on factors that will drive the growth of the market  between 2023 and 2028
  • Precise estimation of the market  size and its contribution to the market in focus on the parent market
  • Accurate predictions about upcoming trends and changes in consumer behavior
  • Growth of the market industry across APAC, North America, Europe, South America, and the Middle East and Africa
  • Thorough market analysis and report of the market’s competitive landscape and detailed information about companies
  • Comprehensive market growth analysis of factors that will challenge the growth of Industry companies


We can help! Our analysts can customize this market research report to meet your requirements. Get in touch


1 Executive Summary

  • 1.1 Market overview
    • Exhibit 01: Executive Summary – Chart on Market Overview
    • Exhibit 02: Executive Summary – Data Table on Market Overview
    • Exhibit 03: Executive Summary – Chart on Global Market Characteristics
    • Exhibit 04: Executive Summary – Chart on Market by Geography
    • Exhibit 05: Executive Summary – Chart on Market Segmentation by Type
    • Exhibit 06: Executive Summary – Chart on Market Segmentation by End-user
    • Exhibit 07: Executive Summary – Chart on Incremental Growth
    • Exhibit 08: Executive Summary – Data Table on Incremental Growth
    • Exhibit 09: Executive Summary – Chart on Vendor Market Positioning

2 Market Landscape

  • 2.1 Market ecosystem
    • Exhibit 10: Parent market
    • Exhibit 11: Market Characteristics

3 Market Sizing

  • 3.1 Market definition
    • Exhibit 12: Offerings of vendors included in the market definition
  • 3.2 Market segment analysis
    • Exhibit 13: Market segments
  • 3.3 Market size 2023
    • 3.4 Market outlook: Forecast for 2023-2028
      • Exhibit 14: Chart on Global - Market size and forecast 2023-2028 ($ billion)
      • Exhibit 15: Data Table on Global - Market size and forecast 2023-2028 ($ billion)
      • Exhibit 16: Chart on Global Market: Year-over-year growth 2023-2028 (%)
      • Exhibit 17: Data Table on Global Market: Year-over-year growth 2023-2028 (%)

    4 Historic Market Size

    • 4.1 Global compound semiconductor market 2018 - 2022
      • Exhibit 18: Historic Market Size – Data Table on global compound semiconductor market 2018 - 2022 ($ billion)
    • 4.2 Type Segment Analysis 2018 - 2022
      • Exhibit 19: Historic Market Size – Type Segment 2018 - 2022 ($ billion)
    • 4.3 End-user Segment Analysis 2018 - 2022
      • Exhibit 20: Historic Market Size – End-user Segment 2018 - 2022 ($ billion)
    • 4.4 Geography Segment Analysis 2018 - 2022
      • Exhibit 21: Historic Market Size – Geography Segment 2018 - 2022 ($ billion)
    • 4.5 Country Segment Analysis 2018 - 2022
      • Exhibit 22: Historic Market Size – Country Segment 2018 - 2022 ($ billion)

    5 Five Forces Analysis

    • 5.1 Five forces summary
      • Exhibit 23: Five forces analysis - Comparison between 2023 and 2028
    • 5.2 Bargaining power of buyers
      • Exhibit 24: Chart on Bargaining power of buyers – Impact of key factors 2023 and 2028
    • 5.3 Bargaining power of suppliers
      • Exhibit 25: Bargaining power of suppliers – Impact of key factors in 2023 and 2028
    • 5.4 Threat of new entrants
      • Exhibit 26: Threat of new entrants – Impact of key factors in 2023 and 2028
    • 5.5 Threat of substitutes
      • Exhibit 27: Threat of substitutes – Impact of key factors in 2023 and 2028
    • 5.6 Threat of rivalry
      • Exhibit 28: Threat of rivalry – Impact of key factors in 2023 and 2028
    • 5.7 Market condition
      • Exhibit 29: Chart on Market condition - Five forces 2023 and 2028

    6 Market Segmentation by Type

    • 6.1 Market segments
      • Exhibit 30: Chart on Type - Market share 2023-2028 (%)
      • Exhibit 31: Data Table on Type - Market share 2023-2028 (%)
    • 6.2 Comparison by Type
      • Exhibit 32: Chart on Comparison by Type
      • Exhibit 33: Data Table on Comparison by Type
    • 6.3 GaAs - Market size and forecast 2023-2028
      • Exhibit 34: Chart on GaAs - Market size and forecast 2023-2028 ($ billion)
      • Exhibit 35: Data Table on GaAs - Market size and forecast 2023-2028 ($ billion)
      • Exhibit 36: Chart on GaAs - Year-over-year growth 2023-2028 (%)
      • Exhibit 37: Data Table on GaAs - Year-over-year growth 2023-2028 (%)
    • 6.4 GaN - Market size and forecast 2023-2028
      • Exhibit 38: Chart on GaN - Market size and forecast 2023-2028 ($ billion)
      • Exhibit 39: Data Table on GaN - Market size and forecast 2023-2028 ($ billion)
      • Exhibit 40: Chart on GaN - Year-over-year growth 2023-2028 (%)
      • Exhibit 41: Data Table on GaN - Year-over-year growth 2023-2028 (%)
    • 6.5 SiC - Market size and forecast 2023-2028
      • Exhibit 42: Chart on SiC - Market size and forecast 2023-2028 ($ billion)
      • Exhibit 43: Data Table on SiC - Market size and forecast 2023-2028 ($ billion)
      • Exhibit 44: Chart on SiC - Year-over-year growth 2023-2028 (%)
      • Exhibit 45: Data Table on SiC - Year-over-year growth 2023-2028 (%)
    • 6.6 Others - Market size and forecast 2023-2028
      • Exhibit 46: Chart on Others - Market size and forecast 2023-2028 ($ billion)
      • Exhibit 47: Data Table on Others - Market size and forecast 2023-2028 ($ billion)
      • Exhibit 48: Chart on Others - Year-over-year growth 2023-2028 (%)
      • Exhibit 49: Data Table on Others - Year-over-year growth 2023-2028 (%)
    • 6.7 Market opportunity by Type
      • Exhibit 50: Market opportunity by Type ($ billion)
      • Exhibit 51: Data Table on Market opportunity by Type ($ billion)

    7 Market Segmentation by End-user

    • 7.1 Market segments
      • Exhibit 52: Chart on End-user - Market share 2023-2028 (%)
      • Exhibit 53: Data Table on End-user - Market share 2023-2028 (%)
    • 7.2 Comparison by End-user
      • Exhibit 54: Chart on Comparison by End-user
      • Exhibit 55: Data Table on Comparison by End-user
    • 7.3 Consumer electronics - Market size and forecast 2023-2028
      • Exhibit 56: Chart on Consumer electronics - Market size and forecast 2023-2028 ($ billion)
      • Exhibit 57: Data Table on Consumer electronics - Market size and forecast 2023-2028 ($ billion)
      • Exhibit 58: Chart on Consumer electronics - Year-over-year growth 2023-2028 (%)
      • Exhibit 59: Data Table on Consumer electronics - Year-over-year growth 2023-2028 (%)
    • 7.4 Communications - Market size and forecast 2023-2028
      • Exhibit 60: Chart on Communications - Market size and forecast 2023-2028 ($ billion)
      • Exhibit 61: Data Table on Communications - Market size and forecast 2023-2028 ($ billion)
      • Exhibit 62: Chart on Communications - Year-over-year growth 2023-2028 (%)
      • Exhibit 63: Data Table on Communications - Year-over-year growth 2023-2028 (%)
    • 7.5 Defense and aerospace - Market size and forecast 2023-2028
      • Exhibit 64: Chart on Defense and aerospace - Market size and forecast 2023-2028 ($ billion)
      • Exhibit 65: Data Table on Defense and aerospace - Market size and forecast 2023-2028 ($ billion)
      • Exhibit 66: Chart on Defense and aerospace - Year-over-year growth 2023-2028 (%)
      • Exhibit 67: Data Table on Defense and aerospace - Year-over-year growth 2023-2028 (%)
    • 7.6 Automotive - Market size and forecast 2023-2028
      • Exhibit 68: Chart on Automotive - Market size and forecast 2023-2028 ($ billion)
      • Exhibit 69: Data Table on Automotive - Market size and forecast 2023-2028 ($ billion)
      • Exhibit 70: Chart on Automotive - Year-over-year growth 2023-2028 (%)
      • Exhibit 71: Data Table on Automotive - Year-over-year growth 2023-2028 (%)
    • 7.7 Others - Market size and forecast 2023-2028
      • Exhibit 72: Chart on Others - Market size and forecast 2023-2028 ($ billion)
      • Exhibit 73: Data Table on Others - Market size and forecast 2023-2028 ($ billion)
      • Exhibit 74: Chart on Others - Year-over-year growth 2023-2028 (%)
      • Exhibit 75: Data Table on Others - Year-over-year growth 2023-2028 (%)
    • 7.8 Market opportunity by End-user
      • Exhibit 76: Market opportunity by End-user ($ billion)
      • Exhibit 77: Data Table on Market opportunity by End-user ($ billion)

    8 Customer Landscape

    • 8.1 Customer landscape overview
      • Exhibit 78: Analysis of price sensitivity, lifecycle, customer purchase basket, adoption rates, and purchase criteria

    9 Geographic Landscape

    • 9.1 Geographic segmentation
      • Exhibit 79: Chart on Market share by geography 2023-2028 (%)
      • Exhibit 80: Data Table on Market share by geography 2023-2028 (%)
    • 9.2 Geographic comparison
      • Exhibit 81: Chart on Geographic comparison
      • Exhibit 82: Data Table on Geographic comparison
    • 9.3 APAC - Market size and forecast 2023-2028
      • Exhibit 83: Chart on APAC - Market size and forecast 2023-2028 ($ billion)
      • Exhibit 84: Data Table on APAC - Market size and forecast 2023-2028 ($ billion)
      • Exhibit 85: Chart on APAC - Year-over-year growth 2023-2028 (%)
      • Exhibit 86: Data Table on APAC - Year-over-year growth 2023-2028 (%)
    • 9.4 North America - Market size and forecast 2023-2028
      • Exhibit 87: Chart on North America - Market size and forecast 2023-2028 ($ billion)
      • Exhibit 88: Data Table on North America - Market size and forecast 2023-2028 ($ billion)
      • Exhibit 89: Chart on North America - Year-over-year growth 2023-2028 (%)
      • Exhibit 90: Data Table on North America - Year-over-year growth 2023-2028 (%)
    • 9.5 Europe - Market size and forecast 2023-2028
      • Exhibit 91: Chart on Europe - Market size and forecast 2023-2028 ($ billion)
      • Exhibit 92: Data Table on Europe - Market size and forecast 2023-2028 ($ billion)
      • Exhibit 93: Chart on Europe - Year-over-year growth 2023-2028 (%)
      • Exhibit 94: Data Table on Europe - Year-over-year growth 2023-2028 (%)
    • 9.6 South America - Market size and forecast 2023-2028
      • Exhibit 95: Chart on South America - Market size and forecast 2023-2028 ($ billion)
      • Exhibit 96: Data Table on South America - Market size and forecast 2023-2028 ($ billion)
      • Exhibit 97: Chart on South America - Year-over-year growth 2023-2028 (%)
      • Exhibit 98: Data Table on South America - Year-over-year growth 2023-2028 (%)
    • 9.7 Middle East and Africa - Market size and forecast 2023-2028
      • Exhibit 99: Chart on Middle East and Africa - Market size and forecast 2023-2028 ($ billion)
      • Exhibit 100: Data Table on Middle East and Africa - Market size and forecast 2023-2028 ($ billion)
      • Exhibit 101: Chart on Middle East and Africa - Year-over-year growth 2023-2028 (%)
      • Exhibit 102: Data Table on Middle East and Africa - Year-over-year growth 2023-2028 (%)
    • 9.8 China - Market size and forecast 2023-2028
      • Exhibit 103: Chart on China - Market size and forecast 2023-2028 ($ billion)
      • Exhibit 104: Data Table on China - Market size and forecast 2023-2028 ($ billion)
      • Exhibit 105: Chart on China - Year-over-year growth 2023-2028 (%)
      • Exhibit 106: Data Table on China - Year-over-year growth 2023-2028 (%)
    • 9.9 US - Market size and forecast 2023-2028
      • Exhibit 107: Chart on US - Market size and forecast 2023-2028 ($ billion)
      • Exhibit 108: Data Table on US - Market size and forecast 2023-2028 ($ billion)
      • Exhibit 109: Chart on US - Year-over-year growth 2023-2028 (%)
      • Exhibit 110: Data Table on US - Year-over-year growth 2023-2028 (%)
    • 9.10 Japan - Market size and forecast 2023-2028
      • Exhibit 111: Chart on Japan - Market size and forecast 2023-2028 ($ billion)
      • Exhibit 112: Data Table on Japan - Market size and forecast 2023-2028 ($ billion)
      • Exhibit 113: Chart on Japan - Year-over-year growth 2023-2028 (%)
      • Exhibit 114: Data Table on Japan - Year-over-year growth 2023-2028 (%)
    • 9.11 South Korea - Market size and forecast 2023-2028
      • Exhibit 115: Chart on South Korea - Market size and forecast 2023-2028 ($ billion)
      • Exhibit 116: Data Table on South Korea - Market size and forecast 2023-2028 ($ billion)
      • Exhibit 117: Chart on South Korea - Year-over-year growth 2023-2028 (%)
      • Exhibit 118: Data Table on South Korea - Year-over-year growth 2023-2028 (%)
    • 9.12 Germany - Market size and forecast 2023-2028
      • Exhibit 119: Chart on Germany - Market size and forecast 2023-2028 ($ billion)
      • Exhibit 120: Data Table on Germany - Market size and forecast 2023-2028 ($ billion)
      • Exhibit 121: Chart on Germany - Year-over-year growth 2023-2028 (%)
      • Exhibit 122: Data Table on Germany - Year-over-year growth 2023-2028 (%)
    • 9.13 Market opportunity by geography
      • Exhibit 123: Market opportunity by geography ($ billion)
      • Exhibit 124: Data Tables on Market opportunity by geography ($ billion)

    10 Drivers, Challenges, and Trends

    • 10.1 Market drivers
      • 10.2 Market challenges
        • 10.3 Impact of drivers and challenges
          • Exhibit 125: Impact of drivers and challenges in 2023 and 2028
        • 10.4 Market trends

          11 Vendor Landscape

          • 11.1 Overview
            • 11.2 Vendor landscape
              • Exhibit 126: Overview on Criticality of inputs and Factors of differentiation
            • 11.3 Landscape disruption
              • Exhibit 127: Overview on factors of disruption
            • 11.4 Industry risks
              • Exhibit 128: Impact of key risks on business

            12 Vendor Analysis

            • 12.1 Vendors covered
              • Exhibit 129: Vendors covered
            • 12.2 Market positioning of vendors
              • Exhibit 130: Matrix on vendor position and classification
            • 12.3 Advanced Wireless Semiconductor Co.
              • Exhibit 131: Advanced Wireless Semiconductor Co. - Overview
              • Exhibit 132: Advanced Wireless Semiconductor Co. - Product / Service
              • Exhibit 133: Advanced Wireless Semiconductor Co. - Key offerings
            • 12.4 AXT Inc.
              • Exhibit 134: AXT Inc. - Overview
              • Exhibit 135: AXT Inc. - Product / Service
              • Exhibit 136: AXT Inc. - Key offerings
            • 12.5 Broadcom Inc.
              • Exhibit 137: Broadcom Inc. - Overview
              • Exhibit 138: Broadcom Inc. - Business segments
              • Exhibit 139: Broadcom Inc. - Key news
              • Exhibit 140: Broadcom Inc. - Key offerings
              • Exhibit 141: Broadcom Inc. - Segment focus
            • 12.6 Infineon Technologies AG
              • Exhibit 142: Infineon Technologies AG - Overview
              • Exhibit 143: Infineon Technologies AG - Business segments
              • Exhibit 144: Infineon Technologies AG - Key news
              • Exhibit 145: Infineon Technologies AG - Key offerings
              • Exhibit 146: Infineon Technologies AG - Segment focus
            • 12.7 IQE Plc
              • Exhibit 147: IQE Plc - Overview
              • Exhibit 148: IQE Plc - Business segments
              • Exhibit 149: IQE Plc - Key offerings
              • Exhibit 150: IQE Plc - Segment focus
            • 12.8 Microchip Technology Inc.
              • Exhibit 151: Microchip Technology Inc. - Overview
              • Exhibit 152: Microchip Technology Inc. - Business segments
              • Exhibit 153: Microchip Technology Inc. - Key offerings
              • Exhibit 154: Microchip Technology Inc. - Segment focus
            • 12.9 Micron Technology Inc.
              • Exhibit 155: Micron Technology Inc. - Overview
              • Exhibit 156: Micron Technology Inc. - Business segments
              • Exhibit 157: Micron Technology Inc. - Key offerings
              • Exhibit 158: Micron Technology Inc. - Segment focus
            • 12.10 Mitsubishi Electric Corp.
              • Exhibit 159: Mitsubishi Electric Corp. - Overview
              • Exhibit 160: Mitsubishi Electric Corp. - Business segments
              • Exhibit 161: Mitsubishi Electric Corp. - Key news
              • Exhibit 162: Mitsubishi Electric Corp. - Key offerings
              • Exhibit 163: Mitsubishi Electric Corp. - Segment focus
            • 12.11 Nichia Corp.
              • Exhibit 164: Nichia Corp. - Overview
              • Exhibit 165: Nichia Corp. - Product / Service
              • Exhibit 166: Nichia Corp. - Key offerings
            • 12.12 NXP Semiconductors NV
              • Exhibit 167: NXP Semiconductors NV - Overview
              • Exhibit 168: NXP Semiconductors NV - Product / Service
              • Exhibit 169: NXP Semiconductors NV - Key news
              • Exhibit 170: NXP Semiconductors NV - Key offerings
            • 12.13 Qorvo Inc.
              • Exhibit 171: Qorvo Inc. - Overview
              • Exhibit 172: Qorvo Inc. - Business segments
              • Exhibit 173: Qorvo Inc. - Key news
              • Exhibit 174: Qorvo Inc. - Key offerings
              • Exhibit 175: Qorvo Inc. - Segment focus
            • 12.14 Qualcomm Inc.
              • Exhibit 176: Qualcomm Inc. - Overview
              • Exhibit 177: Qualcomm Inc. - Business segments
              • Exhibit 178: Qualcomm Inc. - Key news
              • Exhibit 179: Qualcomm Inc. - Key offerings
              • Exhibit 180: Qualcomm Inc. - Segment focus
            • 12.15 Renesas Electronics Corp.
              • Exhibit 181: Renesas Electronics Corp. - Overview
              • Exhibit 182: Renesas Electronics Corp. - Business segments
              • Exhibit 183: Renesas Electronics Corp. - Key news
              • Exhibit 184: Renesas Electronics Corp. - Key offerings
              • Exhibit 185: Renesas Electronics Corp. - Segment focus
            • 12.16 Samsung Electronics Co. Ltd.
              • Exhibit 186: Samsung Electronics Co. Ltd. - Overview
              • Exhibit 187: Samsung Electronics Co. Ltd. - Business segments
              • Exhibit 188: Samsung Electronics Co. Ltd. - Key news
              • Exhibit 189: Samsung Electronics Co. Ltd. - Key offerings
              • Exhibit 190: Samsung Electronics Co. Ltd. - Segment focus
            • 12.17 Skyworks Solutions Inc.
              • Exhibit 191: Skyworks Solutions Inc. - Overview
              • Exhibit 192: Skyworks Solutions Inc. - Product / Service
              • Exhibit 193: Skyworks Solutions Inc. - Key offerings

            13 Appendix

            • 13.1 Scope of the report
              • 13.2 Inclusions and exclusions checklist
                • Exhibit 194: Inclusions checklist
                • Exhibit 195: Exclusions checklist
              • 13.3 Currency conversion rates for US$
                • Exhibit 196: Currency conversion rates for US$
              • 13.4 Research methodology
                • Exhibit 197: Research methodology
                • Exhibit 198: Validation techniques employed for market sizing
                • Exhibit 199: Information sources
              • 13.5 List of abbreviations
                • Exhibit 200: List of abbreviations

              Research Methodology

              Technavio presents a detailed picture of the market by way of study, synthesis, and summation of data from multiple sources. The analysts have presented the various facets of the market with a particular focus on identifying the key industry influencers. The data thus presented is comprehensive, reliable, and the result of extensive research, both primary and secondary.

              INFORMATION SOURCES

              Primary sources

              • Manufacturers and suppliers
              • Channel partners
              • Industry experts
              • Strategic decision makers

              Secondary sources

              • Industry journals and periodicals
              • Government data
              • Financial reports of key industry players
              • Historical data
              • Press releases

              DATA ANALYSIS

              Data Synthesis

              • Collation of data
              • Estimation of key figures
              • Analysis of derived insights

              Data Validation

              • Triangulation with data models
              • Reference against proprietary databases
              • Corroboration with industry experts

              REPORT WRITING

              Qualitative

              • Market drivers
              • Market challenges
              • Market trends
              • Five forces analysis

              Quantitative

              • Market size and forecast
              • Market segmentation
              • Geographical insights
              • Competitive landscape

              Interested in this report?

              Get your sample now to see our research methodology and insights!

              Download Now

              Frequently Asked Questions

              Compound Semiconductor market growth will increase by $ 17.56 bn during 2024-2028 .

              The Compound Semiconductor market is expected to grow at a CAGR of 7.03% during 2024-2028 .

              Compound Semiconductor market is segmented by Type( GaAs, GaN, SiC, Others, others) End-user( Consumer electronics, Communications, Defense and aerospace, Automotive, Others)

              Advanced Wireless Semiconductor Co., AXT Inc., Broadcom Inc., Infineon Technologies AG, IQE Plc, Microchip Technology Inc., Micron Technology Inc., Mitsubishi Electric Corp., Nichia Corp., NXP Semiconductors NV, Qorvo Inc., Qualcomm Inc., Renesas Electronics Corp., Samsung Electronics Co. Ltd., Skyworks Solutions Inc., Sony Group Corp., STMicroelectronics International NV, Texas Instruments Inc., Toshiba Corp., Wolfspeed Inc. are a few of the key vendors in the Compound Semiconductor market.

              APAC will register the highest growth rate of 73% among the other regions. Therefore, the Compound Semiconductor market in APAC is expected to garner significant business opportunities for the vendors during the forecast period.

              US, China, Japan, South Korea, Germany

              • Increasing demand for enhanced power densityThe increasing demand for productivity with the use of compound semiconductor requires several extra functionalities to be installed in a particular piece of equipment. Thus is the driving factor this market.
              • compound semiconductor devices require high power densities to operate. As a result is the driving factor this market.
              • the global demand for high-power solutions is increasing at a rapid rate. This is driving the need for superior semiconductor materials as silicon-based devices are unable to showcase the desired results. Compound semiconductor materials are suited to perform at high power densities due to inherent material properties that enable them to handle high temperatures. Thus is the driving factor this market.
              • the need for compound semiconductor cooling systems gets eliminated is the driving factor this market.
              • which results in the compact size of applications and lesser cost. In addition is the driving factor this market.
              • compound semiconductor materials offer higher switching rates and energy efficiency is the driving factor this market.
              • ultimately resulting in low system costs. Applications such as inverter systems is the driving factor this market.
              • electric rail traction drives is the driving factor this market.
              • wind power generators is the driving factor this market.
              • and solar power generators use power electronics devices to improve their operational efficiency. However is the driving factor this market.
              • silicon-based power devices are unable to provide the required performance is the driving factor this market.
              • which fuels the need for compound semiconductor materials. Vendors are investing heavily in R and D to develop power semiconductor devices based on compound semiconductor materials such as GaN and SiC is the driving factor this market.
              • which can operate at high power levels. They also offer various advantages is the driving factor this market.
              • such as low noise and compact applications. Thus is the driving factor this market.
              • the growing demand for higher power density in high-power applications will drive the global compound semiconductor market during the forecast period. is the driving factor this market.

              The Compound Semiconductor market vendors should focus on grabbing business opportunities from the GaAs segment as it accounted for the largest market share in the base year.