Computer Vision In Healthcare Market Analysis, Size, and Forecast 2026-2030: North America (US, Canada, and Mexico), APAC (China, Japan, and India), Europe (Germany, France, and UK), South America (Brazil), Middle East and Africa (Saudi Arabia, South Africa, and UAE), Asia, Rest of World (ROW)

Computer Vision In Healthcare Market Analysis, Size, and Forecast 2026-2030:
North America (US, Canada, and Mexico), APAC (China, Japan, and India), Europe (Germany, France, and UK), South America (Brazil), Middle East and Africa (Saudi Arabia, South Africa, and UAE), Asia, Rest of World (ROW)

Published: Jan 2026 303 Pages SKU: IRTNTR81231

Market Overview at a Glance

$10.97 B
Market Opportunity
31.1%
CAGR 2025 - 2030
38.3%
North America Growth
$1.49 B
Healthcare providers segment 2024

Computer Vision In Healthcare Market Size 2026-2030

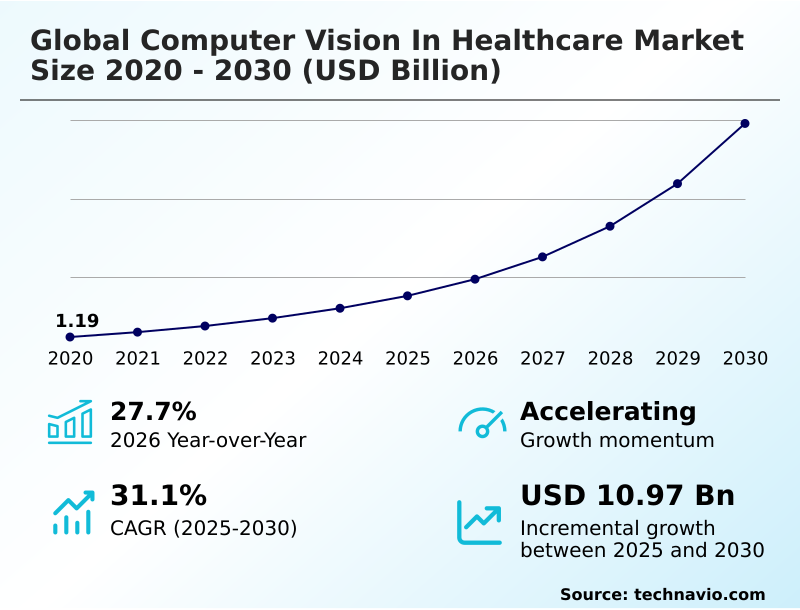
The computer vision in healthcare market size is valued to increase by USD 10.97 billion, at a CAGR of 31.1% from 2025 to 2030. Accelerated advancements in AI and ML algorithms will drive the computer vision in healthcare market.

Major Market Trends & Insights

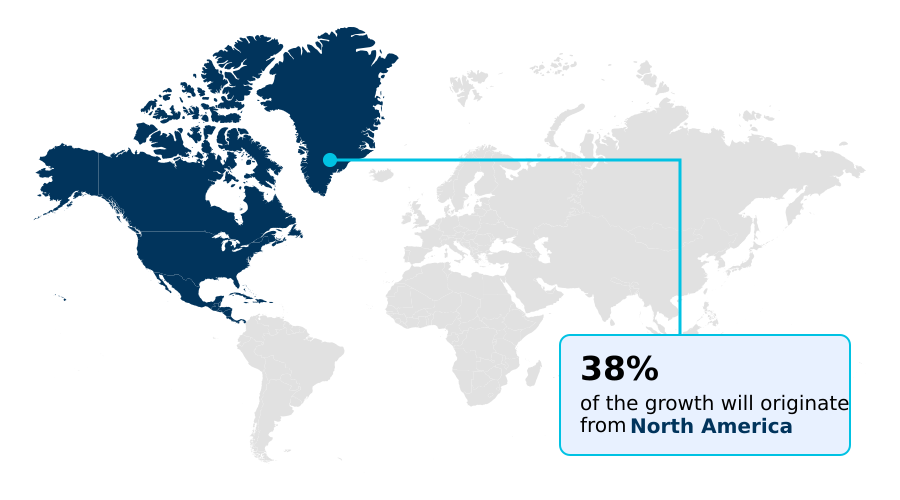
  • North America dominated the market and accounted for a 38.3% growth during the forecast period.
  • By End-user - Healthcare providers segment was valued at USD 1.49 billion in 2024
  • By Component - Software segment accounted for the largest market revenue share in 2024

Market Size & Forecast

  • Market Opportunities: USD 13.59 billion
  • Market Future Opportunities: USD 10.97 billion
  • CAGR from 2025 to 2030 : 31.1%

Market Summary

  • The computer vision in healthcare market is undergoing transformative expansion, driven by the need for greater diagnostic precision and clinical efficiency. This field leverages sophisticated algorithms like convolutional neural networks to analyze medical imagery, enabling capabilities from automated triage in emergency settings to enhanced precision in robotic-assisted surgery.
  • Key applications include medical image analysis for early disease detection and digital pathology, where AI assists in identifying malignancies. A significant trend is the shift towards edge computing in healthcare, allowing for real-time analysis on devices without cloud latency. For instance, a hospital network can implement an AI-powered monitoring system for in-patient wards.
  • This system uses contactless patient monitoring for fall detection and alerts staff, improving patient safety and optimizing nursing workflows without requiring additional personnel. This scenario highlights the technology's practical impact, moving beyond research to deliver tangible improvements in care quality and operational efficiency through tools like AI-powered workflow tools and AI-driven surgical video analytics.
  • The development of explainable AI techniques is also crucial for building clinical trust and navigating regulatory hurdles.

What will be the Size of the Computer Vision In Healthcare Market during the forecast period?

Get Key Insights on Market Forecast (PDF) Request Free Sample

How is the Computer Vision In Healthcare Market Segmented?

The computer vision in healthcare industry research report provides comprehensive data (region-wise segment analysis), with forecasts and estimates in "USD million" for the period 2026-2030, as well as historical data from 2020-2024 for the following segments.

  • End-user
    • Healthcare providers
    • Diagnostic centers
    • Research and academic institutes
    • Others
  • Component
    • Software
    • Hardware
    • Services
  • Application
    • Medical imaging and diagnostics
    • Pathology and laboratory automation
    • Surgeries and robotics
    • Hospital management and patient monitoring
    • Others
  • Geography
    • North America
      • US
      • Canada
      • Mexico
    • Asia
    • Europe
      • Germany
      • France
      • UK
    • Rest of World (ROW)

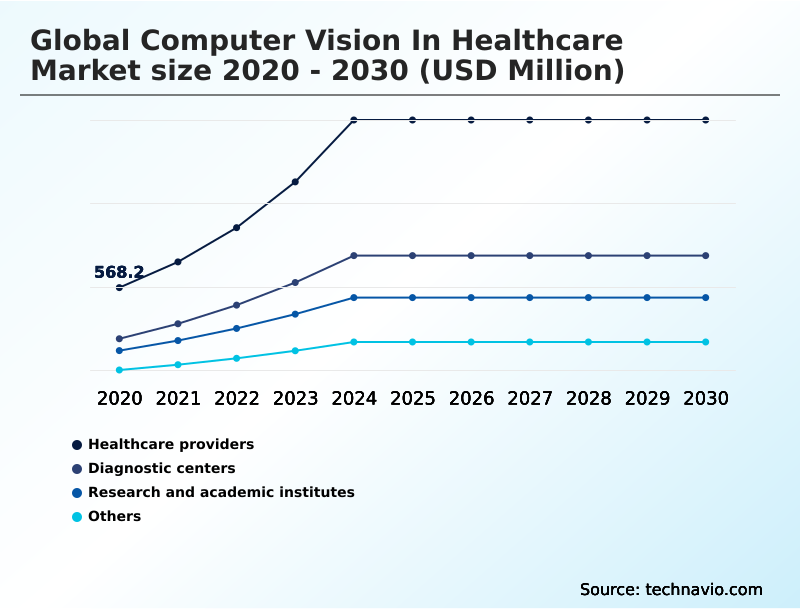
By End-user Insights

The healthcare providers segment is estimated to witness significant growth during the forecast period.

Healthcare providers are central to the market's expansion, driven by the need to optimize hospital workflows and improve clinical outcomes.

This segment is adopting systems for AI-powered care coordination and AI-driven surgical video analytics to manage staff shortages and complex patient needs. The use of ambient intelligence in patient rooms for contactless patient monitoring is becoming a standard.

These AI-enabled diagnostic tools analyze video feeds to detect adverse events like falls, enabling immediate intervention. In operating rooms, surgical navigation systems leveraging real-time surgical intelligence and augmented reality overlays reduce procedural times.

Integrating this visual data with EHRs creates a comprehensive patient view. For instance, facilities implementing these technologies report up to a 20% reduction in specific adverse events, showcasing clear operational gains from AI-powered workflow tools.

Request Free Sample

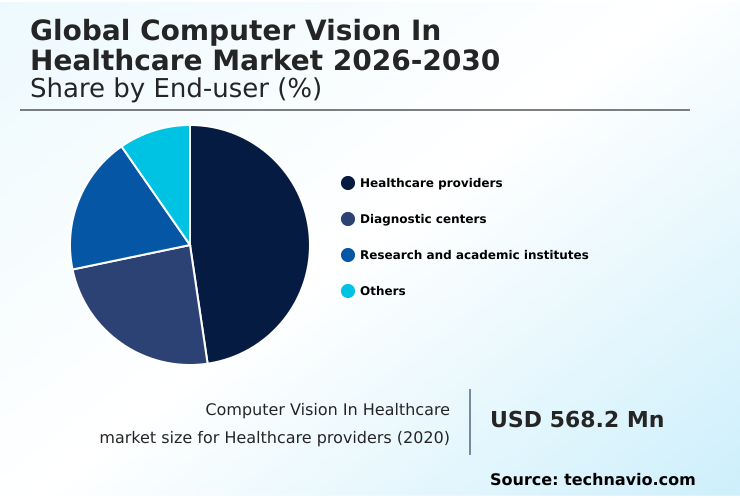
The Healthcare providers segment was valued at USD 1.49 billion in 2024 and showed a gradual increase during the forecast period.

Request Free Sample

Regional Analysis

North America is estimated to contribute 38.3% to the growth of the global market during the forecast period.Technavio’s analysts have elaborately explained the regional trends and drivers that shape the market during the forecast period.

See How Computer Vision In Healthcare Market Demand is Rising in North America Request Free Sample

North America continues to dominate the market, driven by high investment in digital health infrastructure and a favorable regulatory environment that has accelerated approvals for AI-driven software. The region accounts for over 38% of the market's incremental growth.

Asia is the fastest-growing region, with a CAGR of 32.4%, fueled by government initiatives promoting AI-based tuberculosis screening and leveraging technology to address physician shortages.

In Europe, the health data hub initiative fosters collaboration, though strict data privacy regulations add complexity. The adoption of AI-powered diagnostic assays in this region is often linked to national reimbursement schemes.

These regional dynamics show a global shift towards integrating AI-powered imaging into standard care.

Market Dynamics

Our researchers analyzed the data with 2025 as the base year, along with the key drivers, trends, and challenges. A holistic analysis of drivers will help companies refine their marketing strategies to gain a competitive advantage.

  • The market's future is being shaped by highly specific applications designed to solve complex clinical problems. The demand for computer vision for early disease detection is paramount, driving innovation in tools for the automated detection of Alzheimer's biomarkers from routine scans, a task that was previously impossible to scale.
  • In surgery, the focus is on integrating edge computing for real-time surgical guidance, where real-time analytics for surgical video feeds provide surgeons with unprecedented situational awareness, a core component of advanced computer vision in robotic-assisted surgery.
  • In diagnostics, deep learning for radiologic image analysis is becoming standard, while the use of generative AI for synthetic pathology data is overcoming the critical bottleneck of data scarcity. This allows for the training of more robust algorithms for applications like AI tools for dermatological skin assessment.
  • The push for computer vision for contactless patient monitoring and its use in computer vision applications in telehealth is expanding care beyond hospital walls. Navigating the AI medical device regulatory approval process and ensuring AI model validation for demographic inclusivity are key to success.
  • A key operational metric shows that systems addressing the interoperability with electronic health records are adopted three times faster than siloed solutions, underscoring the importance of seamless integration.

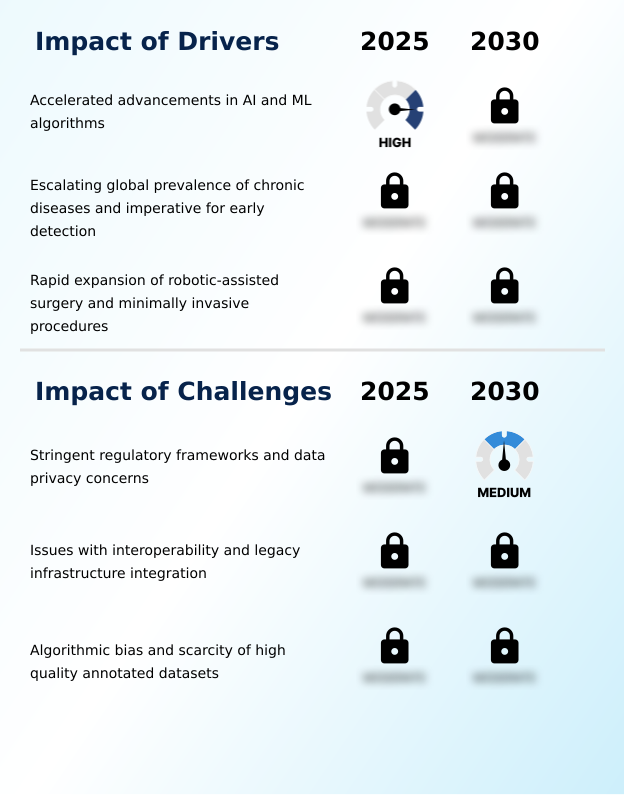
What are the key market drivers leading to the rise in the adoption of Computer Vision In Healthcare Industry?

  • Accelerated advancements in artificial intelligence and machine learning algorithms are a key driver for market growth.

  • Accelerated advancements in convolutional neural networks and vision transformers are the primary market driver. These algorithms enable a new class of AI-powered radiology solutions to perform tasks like semantic segmentation with superhuman accuracy.
  • The escalating prevalence of chronic diseases creates a compelling demand for the early detection capabilities offered by AI-assisted diagnostics. For example, systems utilizing computational fluid dynamics derived from scans can non-invasively assess cardiovascular risk, improving diagnostic yields by over 25%.
  • This technological push allows for the automation of routine tasks, freeing clinicians to focus on complex cases. Furthermore, the expansion of robotic-assisted surgery relies on these technologies for precise instrument tracking and navigation, solidifying their role in modern medicine.

What are the market trends shaping the Computer Vision In Healthcare Industry?

  • A key market trend is the convergence of edge computing with real-time surgical intelligence. This integration is essential for enabling low-latency decision support during critical procedures.

  • A dominant trend is the migration of processing to the edge, enabling real-time surgical intelligence on medical devices. This shift, powered by low-latency AI libraries, is crucial for robotic-assisted surgery, where immediate feedback from vision-guided robotic platforms improves safety and precision. The use of generative adversarial networks and diffusion models to create synthetic medical data is another transformative trend.
  • It addresses data scarcity for training robust models for AI-powered cancer diagnostics and other applications, reducing dependency on limited high-quality annotated datasets. This synergy of edge computing in healthcare and generative AI accelerates innovation, with some systems demonstrating a 30% faster processing time for medical image analysis at the point of care.

What challenges does the Computer Vision In Healthcare Industry face during its growth?

  • Stringent regulatory frameworks and data privacy concerns present a key challenge affecting industry growth.

  • Significant challenges hinder market adoption, primarily complex regulatory frameworks and issues of interoperability of AI systems with legacy infrastructure. The black box nature of deep learning makes model validation difficult, while the risk of algorithmic bias is a major ethical concern, as demonstrated when some AI-based dermatological assessment tools showed a 20% higher error rate on underrepresented demographics.
  • Navigating data privacy laws and the high cost of creating diverse, high-quality annotated datasets create substantial barriers. Addressing these issues requires a move towards explainable AI techniques and robust AI lifecycle management. Without transparent and unbiased systems, achieving widespread clinical trust and navigating the stringent approval processes for AI-enabled medical devices will remain a primary challenge.

Exclusive Technavio Analysis on Customer Landscape

The computer vision in healthcare market forecasting report includes the adoption lifecycle of the market, covering from the innovator’s stage to the laggard’s stage. It focuses on adoption rates in different regions based on penetration. Furthermore, the computer vision in healthcare market report also includes key purchase criteria and drivers of price sensitivity to help companies evaluate and develop their market growth analysis strategies.

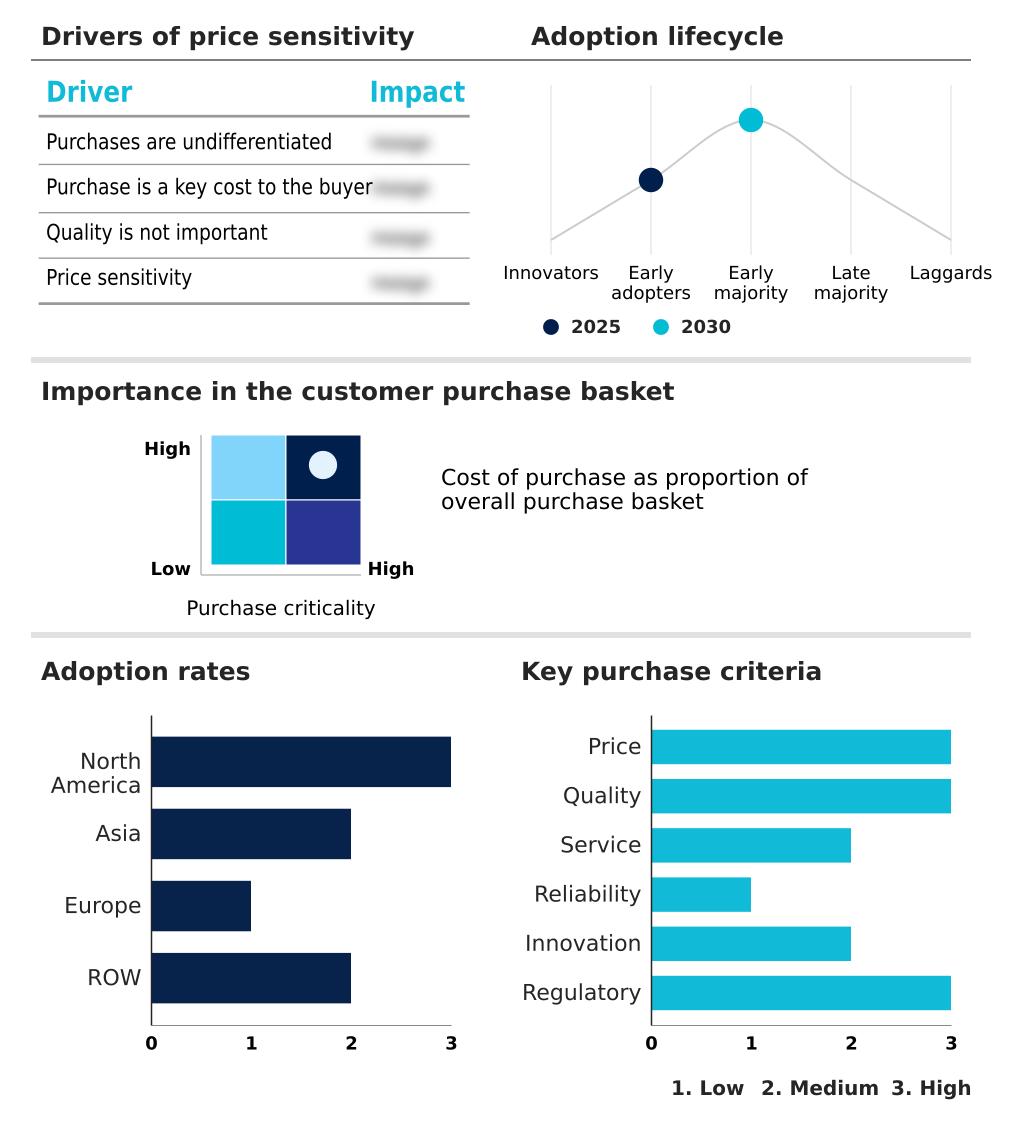
Customer Landscape of Computer Vision In Healthcare Industry

Competitive Landscape

Companies are implementing various strategies, such as strategic alliances, computer vision in healthcare market forecast, partnerships, mergers and acquisitions, geographical expansion, and product/service launches, to enhance their presence in the industry.

Aidoc Medical Ltd. - Delivers AI-powered radiology solutions for real-time detection of critical conditions, expediting patient treatment and enhancing diagnostic impact.

The industry research and growth report includes detailed analyses of the competitive landscape of the market and information about key companies, including:

  • Aidoc Medical Ltd.
  • Butterfly Network Inc.
  • Canon Medical Systems Corp.
  • Enlitic Inc.
  • GE Healthcare Technologies
  • HeartFlow Inc.
  • Ibex Medical Analytics
  • Koninklijke Philips NV
  • Lunit Inc.
  • Nano-X Imaging Ltd.
  • Oxipit
  • Qure.ai Technologies Pvt. Ltd.
  • RADLogics Inc.
  • Samsung Medison Co.Ltd.
  • Siemens Healthineers AG
  • Tempus Labs Inc.
  • Ultromics Ltd.
  • Viz.ai Inc.

Qualitative and quantitative analysis of companies has been conducted to help clients understand the wider business environment as well as the strengths and weaknesses of key industry players. Data is qualitatively analyzed to categorize companies as pure play, category-focused, industry-focused, and diversified; it is quantitatively analyzed to categorize companies as dominant, leading, strong, tentative, and weak.

Recent Development and News in Computer vision in healthcare market

  • In March 2025, NVIDIA Corp. launched its updated Clara Holoscan platform with new low-latency AI libraries to process 4K video feeds from surgical devices in real-time.
  • In March 2025, Qualcomm Technologies Inc. announced a new processor series optimized for the Internet of Medical Things, featuring built-in computer vision acceleration for next-generation portable medical devices.
  • In April 2025, HCA Healthcare announced a strategic enterprise-wide rollout of an AI-powered ambient monitoring system to analyze patient movements and predict fall risks across its acute care facilities.
  • In May 2025, Koninklijke Philips NV announced a strategic collaboration with NVIDIA Corp. to co-develop an AI-powered MRI foundational model aimed at significantly reducing scan times and improving image reconstruction quality.

Dive into Technavio’s robust research methodology, blending expert interviews, extensive data synthesis, and validated models for unparalleled Computer Vision In Healthcare Market insights. See full methodology.

Market Scope
Page number 303
Base year 2025
Historic period 2020-2024
Forecast period 2026-2030
Growth momentum & CAGR Accelerate at a CAGR of 31.1%
Market growth 2026-2030 USD 10971.9 million
Market structure Fragmented
YoY growth 2025-2026(%) 27.7%
Key countries US, Canada, Mexico, China, Japan, India, South Korea, Indonesia, Thailand, Singapore, Germany, France, UK, Italy, The Netherlands, Spain, Russia, Australia, Brazil, Saudi Arabia, South Africa, UAE and Turkey
Competitive landscape Leading Companies, Market Positioning of Companies, Competitive Strategies, and Industry Risks

Request Free Sample

Research Analyst Overview

  • The computer vision in healthcare market is defined by the practical application of advanced algorithms to solve tangible clinical challenges. Core technologies like convolutional neural networks and vision transformers are enabling a new generation of diagnostic and procedural tools. From AI-powered cancer diagnostics in digital pathology to guidance systems for robotic-assisted surgery, these solutions are becoming integral to care delivery.
  • Boardroom decisions are increasingly focused on the strategic implementation of these technologies, weighing the benefits of AI-powered care coordination against the complexities of AI lifecycle management. A key trend is the move toward real-time surgical intelligence, which has been shown to reduce procedural analysis time by over 30% in certain complex interventions.
  • The market's maturity is reflected in the development of sophisticated platforms like the AI-rad companion suite and specialized tools for AI-based dermatological assessment and automated triage. Success hinges on effective clinical workflow integration and the use of explainable AI techniques to foster trust and ensure adoption.

What are the Key Data Covered in this Computer Vision In Healthcare Market Research and Growth Report?

  • What is the expected growth of the Computer Vision In Healthcare Market between 2026 and 2030?

    • USD 10.97 billion, at a CAGR of 31.1%

  • What segmentation does the market report cover?

    • The report is segmented by End-user (Healthcare providers, Diagnostic centers, Research and academic institutes, and Others), Component (Software, Hardware, and Services), Application (Medical imaging and diagnostics, Pathology and laboratory automation, Surgeries and robotics, Hospital management and patient monitoring, and Others) and Geography (North America, Asia, Europe, Rest of World (ROW))

  • Which regions are analyzed in the report?

    • North America, Asia, Europe and Rest of World (ROW)

  • What are the key growth drivers and market challenges?

    • Accelerated advancements in AI and ML algorithms, Stringent regulatory frameworks and data privacy concerns

  • Who are the major players in the Computer Vision In Healthcare Market?

    • Aidoc Medical Ltd., Butterfly Network Inc., Canon Medical Systems Corp., Enlitic Inc., GE Healthcare Technologies, HeartFlow Inc., Ibex Medical Analytics, Koninklijke Philips NV, Lunit Inc., Nano-X Imaging Ltd., Oxipit, Qure.ai Technologies Pvt. Ltd., RADLogics Inc., Samsung Medison Co.Ltd., Siemens Healthineers AG, Tempus Labs Inc., Ultromics Ltd. and Viz.ai Inc.

Market Research Insights

  • Market dynamics are shaped by the imperative to enhance diagnostic accuracy and operational efficiency. The adoption of AI-powered radiology solutions and AI-assisted diagnostics is accelerating, with some applications reducing radiologist review times by up to 30%. AI-driven software is moving beyond pilot programs, as clinical workflow integration becomes a key purchasing criterion.
  • Platforms offering AI-powered care coordination demonstrate significant value, correlating with a 15% reduction in patient readmission rates in certain high-risk cohorts. However, the success of these AI-assisted diagnostic tools depends heavily on seamless interoperability of AI systems with existing hospital IT, a factor that differentiates leading vendors. The market is clearly transitioning toward enterprise-scale, outcome-driven implementations.

We can help! Our analysts can customize this computer vision in healthcare market research report to meet your requirements.

Get in touch

1. Executive Summary

1.1 Market overview

Executive Summary - Chart on Market Overview
Executive Summary - Data Table on Market Overview
Executive Summary - Chart on Global Market Characteristics
Executive Summary - Chart on Market by Geography
Executive Summary - Chart on Market Segmentation by End-user
Executive Summary - Chart on Market Segmentation by Component
Executive Summary - Chart on Market Segmentation by Application
Executive Summary - Chart on Incremental Growth
Executive Summary - Data Table on Incremental Growth
Executive Summary - Chart on Company Market Positioning

2. Technavio Analysis

2.1 Analysis of price sensitivity, lifecycle, customer purchase basket, adoption rates, and purchase criteria

2.2 Criticality of inputs and Factors of differentiation

Chart on Overview on criticality of inputs and factors of differentiation

2.3 Factors of disruption

Chart on Overview on factors of disruption

2.4 Impact of drivers and challenges

Chart on Impact of drivers and challenges in 2025 and 2030

3. Market Landscape

3.1 Market ecosystem

Chart on Parent Market
Data Table on - Parent Market

3.2 Market characteristics

Chart on Market characteristics analysis

3.3 Value chain analysis

Chart on Value chain analysis

4. Market Sizing

4.1 Market definition

Data Table on Offerings of companies included in the market definition

4.2 Market segment analysis

Market segments

4.3 Market size 2025

4.4 Market outlook: Forecast for 2025-2030

Chart on Global - Market size and forecast 2025-2030 ($ million)
Data Table on Global - Market size and forecast 2025-2030 ($ million)
Chart on Global Market: Year-over-year growth 2025-2030 (%)
Data Table on Global Market: Year-over-year growth 2025-2030 (%)

5. Historic Market Size

5.1 Global Computer Vision In Healthcare Market 2020 - 2024

Historic Market Size - Data Table on Global Computer Vision In Healthcare Market 2020 - 2024 ($ million)

5.2 End-user segment analysis 2020 - 2024

Historic Market Size - End-user Segment 2020 - 2024 ($ million)

5.3 Component segment analysis 2020 - 2024

Historic Market Size - Component Segment 2020 - 2024 ($ million)

5.4 Application segment analysis 2020 - 2024

Historic Market Size - Application Segment 2020 - 2024 ($ million)

5.5 Geography segment analysis 2020 - 2024

Historic Market Size - Geography Segment 2020 - 2024 ($ million)

5.6 Country segment analysis 2020 - 2024

Historic Market Size - Country Segment 2020 - 2024 ($ million)

6. Qualitative Analysis

6.1 The AI impact on global computer vision in healthcare market

7. Five Forces Analysis

7.1 Five forces summary

Five forces analysis - Comparison between 2025 and 2030

7.2 Bargaining power of buyers

Bargaining power of buyers - Impact of key factors 2025 and 2030

7.3 Bargaining power of suppliers

Bargaining power of suppliers - Impact of key factors in 2025 and 2030

7.4 Threat of new entrants

Threat of new entrants - Impact of key factors in 2025 and 2030

7.5 Threat of substitutes

Threat of substitutes - Impact of key factors in 2025 and 2030

7.6 Threat of rivalry

Threat of rivalry - Impact of key factors in 2025 and 2030

7.7 Market condition

Chart on Market condition - Five forces 2025 and 2030

8. Market Segmentation by End-user

8.1 Market segments

Chart on End-user - Market share 2025-2030 (%)
Data Table on End-user - Market share 2025-2030 (%)

8.2 Comparison by End-user

Chart on Comparison by End-user
Data Table on Comparison by End-user

8.3 Healthcare providers - Market size and forecast 2025-2030

Chart on Healthcare providers - Market size and forecast 2025-2030 ($ million)
Data Table on Healthcare providers - Market size and forecast 2025-2030 ($ million)
Chart on Healthcare providers - Year-over-year growth 2025-2030 (%)
Data Table on Healthcare providers - Year-over-year growth 2025-2030 (%)

8.4 Diagnostic centers - Market size and forecast 2025-2030

Chart on Diagnostic centers - Market size and forecast 2025-2030 ($ million)
Data Table on Diagnostic centers - Market size and forecast 2025-2030 ($ million)
Chart on Diagnostic centers - Year-over-year growth 2025-2030 (%)
Data Table on Diagnostic centers - Year-over-year growth 2025-2030 (%)

8.5 Research and academic institutes - Market size and forecast 2025-2030

Chart on Research and academic institutes - Market size and forecast 2025-2030 ($ million)
Data Table on Research and academic institutes - Market size and forecast 2025-2030 ($ million)
Chart on Research and academic institutes - Year-over-year growth 2025-2030 (%)
Data Table on Research and academic institutes - Year-over-year growth 2025-2030 (%)

8.6 Others - Market size and forecast 2025-2030

Chart on Others - Market size and forecast 2025-2030 ($ million)
Data Table on Others - Market size and forecast 2025-2030 ($ million)
Chart on Others - Year-over-year growth 2025-2030 (%)
Data Table on Others - Year-over-year growth 2025-2030 (%)

8.7 Market opportunity by End-user

Market opportunity by End-user ($ million)
Data Table on Market opportunity by End-user ($ million)

9. Market Segmentation by Component

9.1 Market segments

Chart on Component - Market share 2025-2030 (%)
Data Table on Component - Market share 2025-2030 (%)

9.2 Comparison by Component

Chart on Comparison by Component
Data Table on Comparison by Component

9.3 Software - Market size and forecast 2025-2030

Chart on Software - Market size and forecast 2025-2030 ($ million)
Data Table on Software - Market size and forecast 2025-2030 ($ million)
Chart on Software - Year-over-year growth 2025-2030 (%)
Data Table on Software - Year-over-year growth 2025-2030 (%)

9.4 Hardware - Market size and forecast 2025-2030

Chart on Hardware - Market size and forecast 2025-2030 ($ million)
Data Table on Hardware - Market size and forecast 2025-2030 ($ million)
Chart on Hardware - Year-over-year growth 2025-2030 (%)
Data Table on Hardware - Year-over-year growth 2025-2030 (%)

9.5 Services - Market size and forecast 2025-2030

Chart on Services - Market size and forecast 2025-2030 ($ million)
Data Table on Services - Market size and forecast 2025-2030 ($ million)
Chart on Services - Year-over-year growth 2025-2030 (%)
Data Table on Services - Year-over-year growth 2025-2030 (%)

9.6 Market opportunity by Component

Market opportunity by Component ($ million)
Data Table on Market opportunity by Component ($ million)

10. Market Segmentation by Application

10.1 Market segments

Chart on Application - Market share 2025-2030 (%)
Data Table on Application - Market share 2025-2030 (%)

10.2 Comparison by Application

Chart on Comparison by Application
Data Table on Comparison by Application

10.3 Medical imaging and diagnostics - Market size and forecast 2025-2030

Chart on Medical imaging and diagnostics - Market size and forecast 2025-2030 ($ million)
Data Table on Medical imaging and diagnostics - Market size and forecast 2025-2030 ($ million)
Chart on Medical imaging and diagnostics - Year-over-year growth 2025-2030 (%)
Data Table on Medical imaging and diagnostics - Year-over-year growth 2025-2030 (%)

10.4 Pathology and laboratory automation - Market size and forecast 2025-2030

Chart on Pathology and laboratory automation - Market size and forecast 2025-2030 ($ million)
Data Table on Pathology and laboratory automation - Market size and forecast 2025-2030 ($ million)
Chart on Pathology and laboratory automation - Year-over-year growth 2025-2030 (%)
Data Table on Pathology and laboratory automation - Year-over-year growth 2025-2030 (%)

10.5 Surgeries and robotics - Market size and forecast 2025-2030

Chart on Surgeries and robotics - Market size and forecast 2025-2030 ($ million)
Data Table on Surgeries and robotics - Market size and forecast 2025-2030 ($ million)
Chart on Surgeries and robotics - Year-over-year growth 2025-2030 (%)
Data Table on Surgeries and robotics - Year-over-year growth 2025-2030 (%)

10.6 Hospital management and patient monitoring - Market size and forecast 2025-2030

Chart on Hospital management and patient monitoring - Market size and forecast 2025-2030 ($ million)
Data Table on Hospital management and patient monitoring - Market size and forecast 2025-2030 ($ million)
Chart on Hospital management and patient monitoring - Year-over-year growth 2025-2030 (%)
Data Table on Hospital management and patient monitoring - Year-over-year growth 2025-2030 (%)

10.7 Others - Market size and forecast 2025-2030

Chart on Others - Market size and forecast 2025-2030 ($ million)
Data Table on Others - Market size and forecast 2025-2030 ($ million)
Chart on Others - Year-over-year growth 2025-2030 (%)
Data Table on Others - Year-over-year growth 2025-2030 (%)

10.8 Market opportunity by Application

Market opportunity by Application ($ million)
Data Table on Market opportunity by Application ($ million)

11. Customer Landscape

11.1 Customer landscape overview

Analysis of price sensitivity, lifecycle, customer purchase basket, adoption rates, and purchase criteria

12. Geographic Landscape

12.1 Geographic segmentation

Chart on Market share by geography 2025-2030 (%)
Data Table on Market share by geography 2025-2030 (%)

12.2 Geographic comparison

Chart on Geographic comparison
Data Table on Geographic comparison

12.3 North America - Market size and forecast 2025-2030

Chart on North America - Market size and forecast 2025-2030 ($ million)
Data Table on North America - Market size and forecast 2025-2030 ($ million)
Chart on North America - Year-over-year growth 2025-2030 (%)
Data Table on North America - Year-over-year growth 2025-2030 (%)
Chart on Regional Comparison - North America
Data Table on Regional Comparison - North America

12.3.1 US - Market size and forecast 2025-2030

Chart on US - Market size and forecast 2025-2030 ($ million)
Data Table on US - Market size and forecast 2025-2030 ($ million)
Chart on US - Year-over-year growth 2025-2030 (%)
Data Table on US - Year-over-year growth 2025-2030 (%)

12.3.2 Canada - Market size and forecast 2025-2030

Chart on Canada - Market size and forecast 2025-2030 ($ million)
Data Table on Canada - Market size and forecast 2025-2030 ($ million)
Chart on Canada - Year-over-year growth 2025-2030 (%)
Data Table on Canada - Year-over-year growth 2025-2030 (%)

12.3.3 Mexico - Market size and forecast 2025-2030

Chart on Mexico - Market size and forecast 2025-2030 ($ million)
Data Table on Mexico - Market size and forecast 2025-2030 ($ million)
Chart on Mexico - Year-over-year growth 2025-2030 (%)
Data Table on Mexico - Year-over-year growth 2025-2030 (%)

12.4 Asia - Market size and forecast 2025-2030

Chart on Asia - Market size and forecast 2025-2030 ($ million)
Data Table on Asia - Market size and forecast 2025-2030 ($ million)
Chart on Asia - Year-over-year growth 2025-2030 (%)
Data Table on Asia - Year-over-year growth 2025-2030 (%)
Chart on Regional Comparison - Asia
Data Table on Regional Comparison - Asia

12.4.1 China - Market size and forecast 2025-2030

Chart on China - Market size and forecast 2025-2030 ($ million)
Data Table on China - Market size and forecast 2025-2030 ($ million)
Chart on China - Year-over-year growth 2025-2030 (%)
Data Table on China - Year-over-year growth 2025-2030 (%)

12.4.2 Japan - Market size and forecast 2025-2030

Chart on Japan - Market size and forecast 2025-2030 ($ million)
Data Table on Japan - Market size and forecast 2025-2030 ($ million)
Chart on Japan - Year-over-year growth 2025-2030 (%)
Data Table on Japan - Year-over-year growth 2025-2030 (%)

12.4.3 India - Market size and forecast 2025-2030

Chart on India - Market size and forecast 2025-2030 ($ million)
Data Table on India - Market size and forecast 2025-2030 ($ million)
Chart on India - Year-over-year growth 2025-2030 (%)
Data Table on India - Year-over-year growth 2025-2030 (%)

12.4.4 South Korea - Market size and forecast 2025-2030

Chart on South Korea - Market size and forecast 2025-2030 ($ million)
Data Table on South Korea - Market size and forecast 2025-2030 ($ million)
Chart on South Korea - Year-over-year growth 2025-2030 (%)
Data Table on South Korea - Year-over-year growth 2025-2030 (%)

12.4.5 Indonesia - Market size and forecast 2025-2030

Chart on Indonesia - Market size and forecast 2025-2030 ($ million)
Data Table on Indonesia - Market size and forecast 2025-2030 ($ million)
Chart on Indonesia - Year-over-year growth 2025-2030 (%)
Data Table on Indonesia - Year-over-year growth 2025-2030 (%)

12.4.6 Thailand - Market size and forecast 2025-2030

Chart on Thailand - Market size and forecast 2025-2030 ($ million)
Data Table on Thailand - Market size and forecast 2025-2030 ($ million)
Chart on Thailand - Year-over-year growth 2025-2030 (%)
Data Table on Thailand - Year-over-year growth 2025-2030 (%)

12.4.7 Singapore - Market size and forecast 2025-2030

Chart on Singapore - Market size and forecast 2025-2030 ($ million)
Data Table on Singapore - Market size and forecast 2025-2030 ($ million)
Chart on Singapore - Year-over-year growth 2025-2030 (%)
Data Table on Singapore - Year-over-year growth 2025-2030 (%)

12.5 Europe - Market size and forecast 2025-2030

Chart on Europe - Market size and forecast 2025-2030 ($ million)
Data Table on Europe - Market size and forecast 2025-2030 ($ million)
Chart on Europe - Year-over-year growth 2025-2030 (%)
Data Table on Europe - Year-over-year growth 2025-2030 (%)
Chart on Regional Comparison - Europe
Data Table on Regional Comparison - Europe

12.5.1 Germany - Market size and forecast 2025-2030

Chart on Germany - Market size and forecast 2025-2030 ($ million)
Data Table on Germany - Market size and forecast 2025-2030 ($ million)
Chart on Germany - Year-over-year growth 2025-2030 (%)
Data Table on Germany - Year-over-year growth 2025-2030 (%)

12.5.2 France - Market size and forecast 2025-2030

Chart on France - Market size and forecast 2025-2030 ($ million)
Data Table on France - Market size and forecast 2025-2030 ($ million)
Chart on France - Year-over-year growth 2025-2030 (%)
Data Table on France - Year-over-year growth 2025-2030 (%)

12.5.3 UK - Market size and forecast 2025-2030

Chart on UK - Market size and forecast 2025-2030 ($ million)
Data Table on UK - Market size and forecast 2025-2030 ($ million)
Chart on UK - Year-over-year growth 2025-2030 (%)
Data Table on UK - Year-over-year growth 2025-2030 (%)

12.5.4 Italy - Market size and forecast 2025-2030

Chart on Italy - Market size and forecast 2025-2030 ($ million)
Data Table on Italy - Market size and forecast 2025-2030 ($ million)
Chart on Italy - Year-over-year growth 2025-2030 (%)
Data Table on Italy - Year-over-year growth 2025-2030 (%)

12.5.5 The Netherlands - Market size and forecast 2025-2030

Chart on The Netherlands - Market size and forecast 2025-2030 ($ million)
Data Table on The Netherlands - Market size and forecast 2025-2030 ($ million)
Chart on The Netherlands - Year-over-year growth 2025-2030 (%)
Data Table on The Netherlands - Year-over-year growth 2025-2030 (%)

12.5.6 Spain - Market size and forecast 2025-2030

Chart on Spain - Market size and forecast 2025-2030 ($ million)
Data Table on Spain - Market size and forecast 2025-2030 ($ million)
Chart on Spain - Year-over-year growth 2025-2030 (%)
Data Table on Spain - Year-over-year growth 2025-2030 (%)

12.5.7 Russia - Market size and forecast 2025-2030

Chart on Russia - Market size and forecast 2025-2030 ($ million)
Data Table on Russia - Market size and forecast 2025-2030 ($ million)
Chart on Russia - Year-over-year growth 2025-2030 (%)
Data Table on Russia - Year-over-year growth 2025-2030 (%)

12.6 Rest of World (ROW) - Market size and forecast 2025-2030

Chart on Rest of World (ROW) - Market size and forecast 2025-2030 ($ million)
Data Table on Rest of World (ROW) - Market size and forecast 2025-2030 ($ million)
Chart on Rest of World (ROW) - Year-over-year growth 2025-2030 (%)
Data Table on Rest of World (ROW) - Year-over-year growth 2025-2030 (%)
Chart on Regional Comparison - Rest of World (ROW)
Data Table on Regional Comparison - Rest of World (ROW)

12.6.1 Australia - Market size and forecast 2025-2030

Chart on Australia - Market size and forecast 2025-2030 ($ million)
Data Table on Australia - Market size and forecast 2025-2030 ($ million)
Chart on Australia - Year-over-year growth 2025-2030 (%)
Data Table on Australia - Year-over-year growth 2025-2030 (%)

12.6.2 Brazil - Market size and forecast 2025-2030

Chart on Brazil - Market size and forecast 2025-2030 ($ million)
Data Table on Brazil - Market size and forecast 2025-2030 ($ million)
Chart on Brazil - Year-over-year growth 2025-2030 (%)
Data Table on Brazil - Year-over-year growth 2025-2030 (%)

12.6.3 Saudi Arabia - Market size and forecast 2025-2030

Chart on Saudi Arabia - Market size and forecast 2025-2030 ($ million)
Data Table on Saudi Arabia - Market size and forecast 2025-2030 ($ million)
Chart on Saudi Arabia - Year-over-year growth 2025-2030 (%)
Data Table on Saudi Arabia - Year-over-year growth 2025-2030 (%)

12.6.4 South Africa - Market size and forecast 2025-2030

Chart on South Africa - Market size and forecast 2025-2030 ($ million)
Data Table on South Africa - Market size and forecast 2025-2030 ($ million)
Chart on South Africa - Year-over-year growth 2025-2030 (%)
Data Table on South Africa - Year-over-year growth 2025-2030 (%)

12.6.5 UAE - Market size and forecast 2025-2030

Chart on UAE - Market size and forecast 2025-2030 ($ million)
Data Table on UAE - Market size and forecast 2025-2030 ($ million)
Chart on UAE - Year-over-year growth 2025-2030 (%)
Data Table on UAE - Year-over-year growth 2025-2030 (%)

12.6.6 Turkey - Market size and forecast 2025-2030

Chart on Turkey - Market size and forecast 2025-2030 ($ million)
Data Table on Turkey - Market size and forecast 2025-2030 ($ million)
Chart on Turkey - Year-over-year growth 2025-2030 (%)
Data Table on Turkey - Year-over-year growth 2025-2030 (%)

12.7 Market opportunity by geography

Market opportunity by geography ($ million)
Data Tables on Market opportunity by geography ($ million)

13. Drivers, Challenges, and Opportunity

13.1 Market drivers

Accelerated advancements in AI and ML algorithms
Escalating global prevalence of chronic diseases and imperative for early detection
Rapid expansion of robotic-assisted surgery and minimally invasive procedures

13.2 Market challenges

Stringent regulatory frameworks and data privacy concerns
Issues with interoperability and legacy infrastructure integration
Algorithmic bias and scarcity of high quality annotated datasets

13.3 Impact of drivers and challenges

Impact of drivers and challenges in 2025 and 2030

13.4 Market opportunities

Convergence of edge computing and real-time surgical intelligence
Adoption of generative AI for synthetic data creation and image reconstruction
Proliferation of ambient intelligence for contactless patient monitoring

14. Competitive Landscape

14.1 Overview

14.2

Overview on criticality of inputs and factors of differentiation

14.3 Landscape disruption

Overview on factors of disruption

14.4 Industry risks

Impact of key risks on business

15. Competitive Analysis

15.1 Companies profiled

Companies covered

15.2 Company ranking index

15.3 Market positioning of companies

Matrix on companies position and classification

15.4 Aidoc Medical Ltd.

Aidoc Medical Ltd. - Overview
Aidoc Medical Ltd. - Product / Service
Aidoc Medical Ltd. - Key offerings
SWOT

15.5 Butterfly Network Inc.

Butterfly Network Inc. - Overview
Butterfly Network Inc. - Product / Service
Butterfly Network Inc. - Key offerings
SWOT

15.6 Canon Medical Systems Corp.

Canon Medical Systems Corp. - Overview
Canon Medical Systems Corp. - Product / Service
Canon Medical Systems Corp. - Key offerings
SWOT

15.7 Enlitic Inc.

Enlitic Inc. - Overview
Enlitic Inc. - Product / Service
Enlitic Inc. - Key offerings
SWOT

15.8 GE Healthcare Technologies

GE Healthcare Technologies - Overview
GE Healthcare Technologies - Business segments
GE Healthcare Technologies - Key news
GE Healthcare Technologies - Key offerings
GE Healthcare Technologies - Segment focus
SWOT

15.9 HeartFlow Inc.

HeartFlow Inc. - Overview
HeartFlow Inc. - Product / Service
HeartFlow Inc. - Key news
HeartFlow Inc. - Key offerings
SWOT

15.10 Ibex Medical Analytics

Ibex Medical Analytics - Overview
Ibex Medical Analytics - Product / Service
Ibex Medical Analytics - Key offerings
SWOT

15.11 Koninklijke Philips NV

Koninklijke Philips NV - Overview
Koninklijke Philips NV - Business segments
Koninklijke Philips NV - Key news
Koninklijke Philips NV - Key offerings
Koninklijke Philips NV - Segment focus
SWOT

15.12 Lunit Inc.

Lunit Inc. - Overview
Lunit Inc. - Product / Service
Lunit Inc. - Key offerings
SWOT

15.13 Nano-X Imaging Ltd.

Nano-X Imaging Ltd. - Overview
Nano-X Imaging Ltd. - Product / Service
Nano-X Imaging Ltd. - Key offerings
SWOT

15.14 Oxipit

Oxipit - Overview
Oxipit - Product / Service
Oxipit - Key offerings
SWOT

15.15 Qure.ai Technologies Pvt. Ltd.

Qure.ai Technologies Pvt. Ltd. - Overview
Qure.ai Technologies Pvt. Ltd. - Product / Service
Qure.ai Technologies Pvt. Ltd. - Key offerings
SWOT

15.16 RADLogics Inc.

RADLogics Inc. - Overview
RADLogics Inc. - Product / Service
RADLogics Inc. - Key offerings
SWOT

15.17 Samsung Medison Co.Ltd.

Samsung Medison Co.Ltd. - Overview
Samsung Medison Co.Ltd. - Product / Service
Samsung Medison Co.Ltd. - Key offerings
SWOT

15.18 Siemens Healthineers AG

Siemens Healthineers AG - Overview
Siemens Healthineers AG - Business segments
Siemens Healthineers AG - Key news
Siemens Healthineers AG - Key offerings
Siemens Healthineers AG - Segment focus
SWOT

16. Appendix

16.1 Scope of the report

Market definition
Objectives
Notes and caveats

16.2 Inclusions and exclusions checklist

Inclusions checklist
Exclusions checklist

16.3 Currency conversion rates for US$

16.4 Research methodology

16.5 Data procurement

Information sources

16.6 Data validation

16.7 Validation techniques employed for market sizing

16.8 Data synthesis

16.9 360 degree market analysis

16.10 List of abbreviations

Research Methodology

Technavio presents a detailed picture of the market by way of study, synthesis, and summation of data from multiple sources. The analysts have presented the various facets of the market with a particular focus on identifying the key industry influencers. The data thus presented is comprehensive, reliable, and the result of extensive research, both primary and secondary.

INFORMATION SOURCES

Primary sources

  • Manufacturers and suppliers
  • Channel partners
  • Industry experts
  • Strategic decision makers

Secondary sources

  • Industry journals and periodicals
  • Government data
  • Financial reports of key industry players
  • Historical data
  • Press releases

DATA ANALYSIS

Data Synthesis

  • Collation of data
  • Estimation of key figures
  • Analysis of derived insights

Data Validation

  • Triangulation with data models
  • Reference against proprietary databases
  • Corroboration with industry experts

REPORT WRITING

Qualitative

  • Market drivers
  • Market challenges
  • Market trends
  • Five forces analysis

Quantitative

  • Market size and forecast
  • Market segmentation
  • Geographical insights
  • Competitive landscape

Interested in this report?

Get your sample now to see our research methodology and insights!

Download Now

Frequently Asked Questions

Computer Vision In Healthcare market growth will increase by USD 10971.9 million during 2026-2030 .

The Computer Vision In Healthcare market is expected to grow at a CAGR of 31.1% during 2026-2030 .

Computer Vision In Healthcare market is segmented by End-user (Healthcare providers, Diagnostic centers, Research and academic institutes, Others) Component (Software, Hardware, Services) Application (Medical imaging and diagnostics, Pathology and laboratory automation, Surgeries and robotics, Hospital management and patient monitoring, Others)

Aidoc Medical Ltd., Butterfly Network Inc., Canon Medical Systems Corp., Enlitic Inc., GE Healthcare Technologies, HeartFlow Inc., Ibex Medical Analytics, Koninklijke Philips NV, Lunit Inc., Nano-X Imaging Ltd., Oxipit, Qure.ai Technologies Pvt. Ltd., RADLogics Inc., Samsung Medison Co.Ltd., Siemens Healthineers AG, Tempus Labs Inc., Ultromics Ltd., Viz.ai Inc. are a few of the key vendors in the Computer Vision In Healthcare market.

North America will register the highest growth rate of 38.3% among the other regions. Therefore, the Computer Vision In Healthcare market in North America is expected to garner significant business opportunities for the vendors during the forecast period.

US, Canada, Mexico, China, Japan, India, South Korea, Indonesia, Thailand, Singapore, Germany, France, UK, Italy, The Netherlands, Spain, Russia, Australia, Brazil, Saudi Arabia, South Africa, UAE, Turkey

  • Accelerated advancements in AI and ML algorithms is the driving factor this market.

The Computer Vision In Healthcare market vendors should focus on grabbing business opportunities from the End-user segment as it accounted for the largest market share in the base year.