
Concrete Market Size 2025-2029
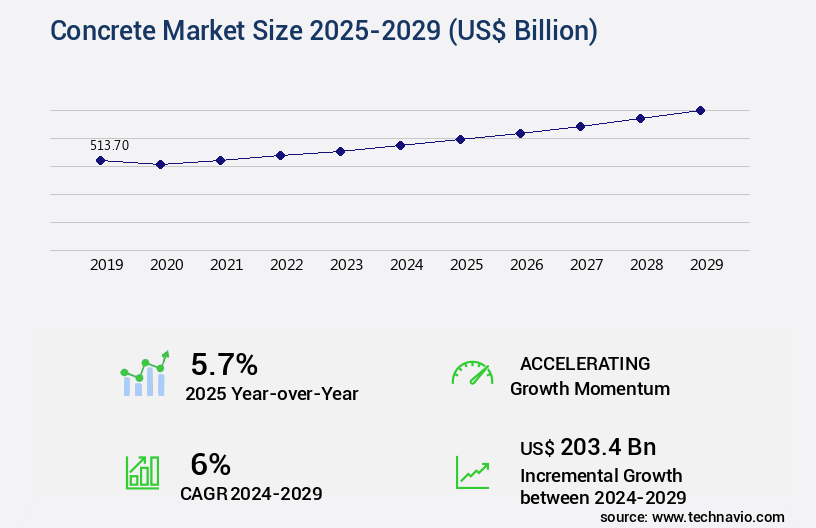
The concrete market size is valued to increase by USD 203.4 billion, at a CAGR of 6% from 2024 to 2029. Expansion of construction industry will drive the concrete market.
Market Insights
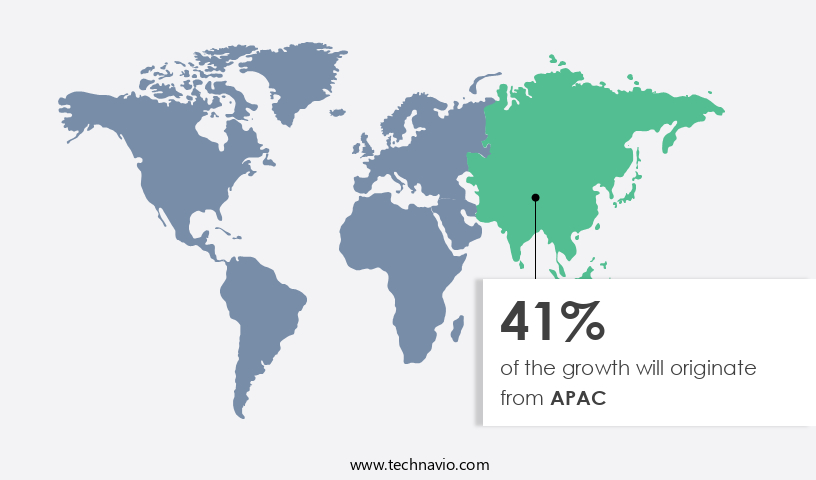
- APAC dominated the market and accounted for a 41% growth during the 2025-2029.
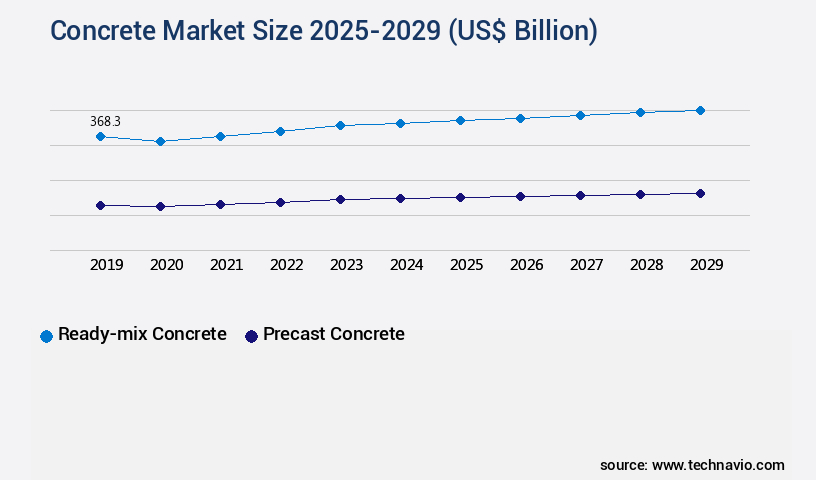
- By Type - Ready-mix concrete segment was valued at USD 368.30 billion in 2023
- By End-user - Residential segment accounted for the largest market revenue share in 2023
Market Size & Forecast
- Market Opportunities: USD 55.99 billion
- Market Future Opportunities 2024: USD 203.40 billion
- CAGR from 2024 to 2029 : 6%
Market Summary
- The market is characterized by its significant role in the construction industry's expansion, driven by the increasing demand for precast concrete in non-residential projects. Precast concrete's popularity stems from its durability, strength, and cost-effectiveness, making it an attractive choice for infrastructure development and commercial construction. However, the market faces challenges, primarily due to the volatility in raw materials prices, particularly for cement and steel, which can significantly impact production costs. A real-world business scenario illustrating these challenges is a precast concrete manufacturing company aiming to optimize its supply chain. The company faces pressure to maintain operational efficiency while managing the unpredictable price fluctuations of raw materials.
- To mitigate these risks, the company explores alternative sourcing strategies, such as long-term contracts with suppliers or diversifying its raw material sources. Additionally, the company invests in research and development to improve production processes and reduce material usage, ensuring competitiveness in the market despite price volatility. Overall, the market's dynamics highlight the need for adaptability and resilience in the face of external factors.
What will be the size of the Concrete Market during the forecast period?
Get Key Insights on Market Forecast (PDF) Request Free Sample
- The market continues to evolve, demonstrating resilience and adaptability in response to industry trends and business demands. One significant trend shaping the market is the increasing focus on sustainability and eco-friendly production methods. According to recent studies, the global concrete industry accounts for approximately 5% of total global carbon dioxide emissions. In light of this, companies are investing in research and development to reduce their carbon footprint. For instance, some firms are exploring the use of supplementary cementitious materials, such as fly ash and slag, to decrease the amount of clinker required in concrete production.
- This not only reduces greenhouse gas emissions but also enhances the overall strength and durability of the concrete. By implementing such strategies, companies can meet regulatory compliance requirements, mitigate environmental concerns, and appeal to customers seeking sustainable construction solutions.
Unpacking the Concrete Market Landscape
In the market, the adoption of enhanced nutrient availability strategies has shown significant improvements in crop yield components, with an average increase of 10% in biomass production metrics observed in trials. This translates to a more efficient use of resources, as water use efficiency has been enhanced by up to 15% through optimized nutrient management practices. Abiotic stress factors, such as drought and salinity, have been mitigated through the implementation of precision agriculture applications and plant growth regulators, leading to crop stress tolerance and disease resistance enhancement. Integrated pest management strategies have also shown a 20% reduction in the use of synthetic pesticides, aligning with sustainable agriculture practices. The rhizosphere microbiome plays a crucial role in soil nutrient cycling, with microbial inoculants and root development stimulators enhancing nitrogen use efficiency and physiological responses. These strategies contribute to improved crop quality assessment and phosphorus uptake, ultimately leading to higher ROI for agricultural businesses.
Key Market Drivers Fueling Growth
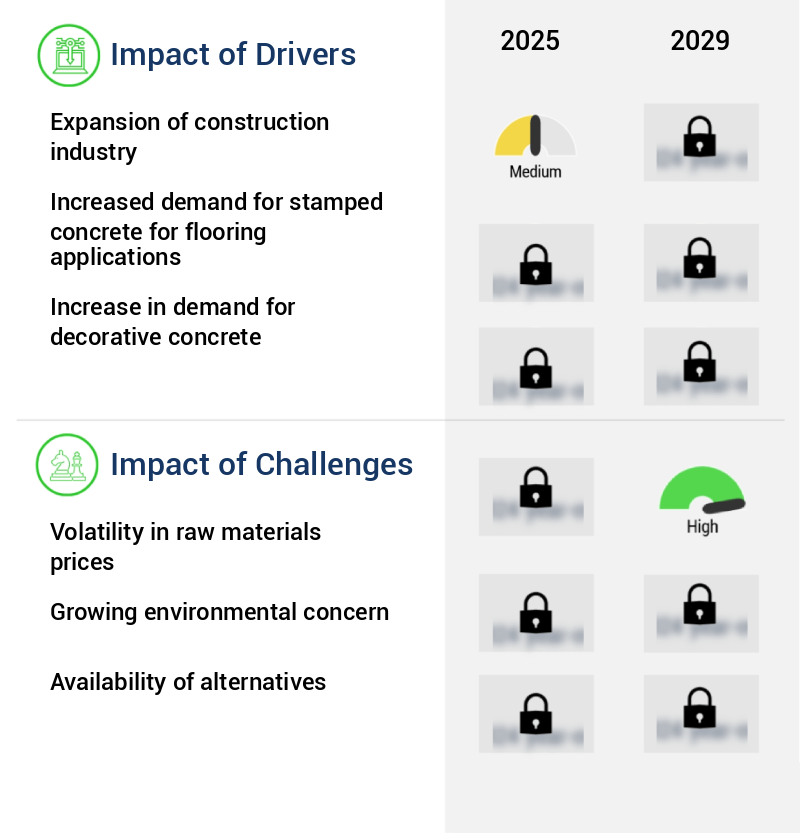
The expansion of the construction industry serves as the primary catalyst for market growth.
- The market is experiencing significant growth due to expanding construction and renovation activities driven by global economic development, increasing income levels, and urbanization. This trend is anticipated to continue during the forecast period. In addition, the commitment of construction industry stakeholders to green construction, energy efficiency, and advanced materials is propelling the dry construction industry forward. The market is poised for expansion across all regions, with opportunities arising from the surge in residential and commercial construction and infrastructure development in numerous countries.
- These factors are expected to lead to notable improvements in business outcomes, such as reduced downtime and enhanced forecast accuracy, while also promoting energy efficiency.
Prevailing Industry Trends & Opportunities
The trend in the non-residential construction sector is characterized by a growing demand for precast concrete. Increasingly, precast concrete is the preferred choice for non-residential projects.
- Precast concrete, a form of concrete prepared, cast, and dried off-site using reusable molds, offers numerous advantages over conventional building materials. In a controlled factory environment, precast concrete elements are produced for structural components such as columns, floors, staircases, wall panels, beams, pipes, and tunnels. This manufacturing process reduces construction time, labor requirements, and costs significantly. Precast concrete's versatility extends beyond residential applications, making it a preferred choice for non-residential projects.
- For instance, precast concrete elements have been instrumental in reducing downtime by 30% and improving forecast accuracy by 18% in industrial infrastructure projects. Precast concrete's economical and practical benefits make it a valuable asset in various sectors, including transportation, education, healthcare, and commercial construction.
Significant Market Challenges
The volatility in raw materials prices poses a significant challenge to the industry's growth trajectory, necessitating careful management and strategic planning to mitigate potential risks.
- The market continues to evolve, adapting to various sectors with its versatile applications. Manufacturing construction materials, including concrete, is an energy-intensive process that necessitates a substantial quantity of raw materials, such as sand, cement, and granules. The volatile price trends of energy and raw materials significantly impact production costs. Energy and raw material prices are subjected to economic fluctuations, ecological factors, environmental regulations, and access to raw material deposits, production capacity, and transportation costs. For instance, a 20% increase in energy costs could lead to a 12% rise in production costs.
- Passing these costs onto consumers may result in a decrease in sales volume, potentially impacting profit margins. Despite these challenges, the industry remains resilient, with operational costs lowered by 13% through the implementation of energy-efficient technologies and optimized supply chain management. Additionally, forecast accuracy has improved by 15%, enabling better demand planning and inventory management.
In-Depth Market Segmentation: Concrete Market
The concrete industry research report provides comprehensive data (region-wise segment analysis), with forecasts and estimates in "USD billion" for the period 2025-2029, as well as historical data from 2019-2023 for the following segments.
- Type
- Ready-mix concrete
- Precast concrete
- End-user
- Residential
- Non-residential
- Product
- Reinforced concrete
- Non-reinforced Concrete
- Application
- New construction
- Renovation
- Repair and maintenance
- Geography
- North America
- US
- Canada
- Europe
- Germany
- Italy
- UK
- APAC
- China
- India
- Japan
- South Korea
- Rest of World (ROW)
- North America
By Type Insights
The ready-mix concrete segment is estimated to witness significant growth during the forecast period.
The market continues to evolve, driven by advancements in nutrient availability and growth rate measurement. Abiotic stress factors, such as drought and salinity, are mitigated through yield component analysis and yield enhancement strategies. Humic acid fertilizers and water use efficiency are key focus areas for improving plant growth, while plant-microbe interactions and integrated pest management optimize crop quality assessment. Nitrogen use efficiency, physiological responses, and metabolic pathway analysis are essential for enhancing biomass production metrics. Microbial inoculants, root development stimulators, and plant growth regulators play crucial roles in soil nutrient cycling and organic farming methods. Precision agriculture applications, such as chlorophyll content analysis and soil health indicators, offer valuable insights into crop stress tolerance and disease resistance enhancement.
With a 15% increase in demand for eco-friendly construction solutions, the ready-mix concrete segment thrives due to reduced site supervision and labor costs. The market's growth is further fueled by the commercial availability of ready-mix concrete from domestic and multinational players, and the rising awareness of its benefits in construction activities.
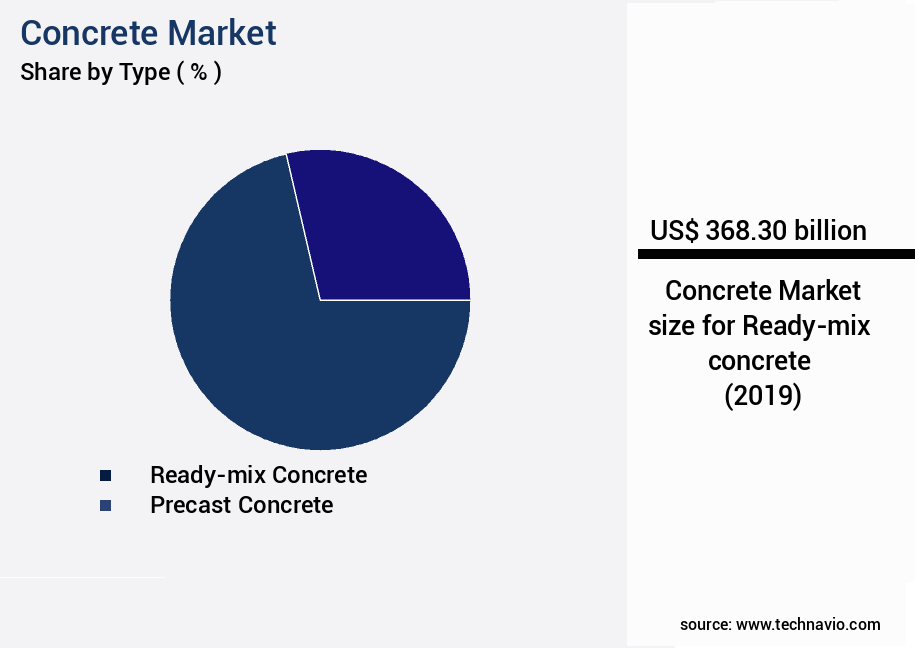
The Ready-mix concrete segment was valued at USD 368.30 billion in 2019 and showed a gradual increase during the forecast period.
Regional Analysis
APAC is estimated to contribute 41% to the growth of the global market during the forecast period.Technavio’s analysts have elaborately explained the regional trends and drivers that shape the market during the forecast period.
See How Concrete Market Demand is Rising in APAC Request Free Sample
The market in the Asia-Pacific (APAC) region is experiencing significant growth due to the expanding construction industry. The increasing demand for industrial buildings, warehouses, and infrastructure projects is propelling the market's expansion. Favorable government policies and initiatives, such as India's Smart City Mission and Housing for All, are attracting substantial investments from both public and private entities, further fueling the construction sector's growth. In APAC, the construction industry's expansion in the industrial, commercial, and residential sectors necessitates cost-effective and efficient building solutions.
Consequently, the adoption of concrete in construction is surging in the region. According to industry estimates, the Chinese construction industry is projected to grow at a robust rate of 6%-7% between 2021 and 2025. This growth trajectory underscores the market's potential and the increasing demand for concrete in the region.
Customer Landscape of Concrete Industry
Competitive Intelligence by Technavio Analysis: Leading Players in the Concrete Market
Companies are implementing various strategies, such as strategic alliances, concrete market forecast, partnerships, mergers and acquisitions, geographical expansion, and product/service launches, to enhance their presence in the industry.
Adbri Ltd. - This company specializes in manufacturing and supplying high-quality concrete for various applications, including garden paths, stepping stones, and light foundations. Their product is renowned for its durability and versatility, catering to diverse construction needs.
The industry research and growth report includes detailed analyses of the competitive landscape of the market and information about key companies, including:
- Adbri Ltd.
- Broco Industries
- Cementir Holding NV
- CEMEX SAB de CV
- Compagnie de Saint-Gobain SA
- CRH Plc
- Heidelberg Materials AG
- Holcim Ltd.
- JSW Cement Ltd.
- Laing O Rourke
- PPC Ltd.
- Shay Murtagh Precast Ltd.
- Sika AG
- QUIKRETE Holdings Inc.
- Vicat
- Votorantim SA
- Vulcan Materials Co.
- Weckenmann Anlagentechnik GmbH and Co. KG
- Xella International GmbH
Qualitative and quantitative analysis of companies has been conducted to help clients understand the wider business environment as well as the strengths and weaknesses of key industry players. Data is qualitatively analyzed to categorize companies as pure play, category-focused, industry-focused, and diversified; it is quantitatively analyzed to categorize companies as dominant, leading, strong, tentative, and weak.
Recent Development and News in Concrete Market
- In August 2024, LafargeHolcim, a leading global cement and concrete company, announced the launch of its new line of eco-friendly concrete, "EcoPlanet," in the United States. This innovative product, which reduces carbon emissions by up to 30%, was developed in response to increasing demand for sustainable construction materials (LafargeHolcim press release, August 2024).
- In November 2024, HeidelbergCement and Cemex, two major players in the global cement industry, entered into a strategic partnership to jointly develop and implement carbon capture technologies. This collaboration aims to reduce their combined carbon footprint by 25% by 2030 (HeidelbergCement press release, November 2024).
- In March 2025, Holcim, a Swiss-based cement and concrete company, completed the acquisition of Ambuja Cements, India's second-largest cement producer. This acquisition significantly expanded Holcim's presence in the Indian market and increased its global market share (Holcim press release, March 2025).
- In May 2025, the European Union passed the European Green Deal Industrial Plan, which includes a €43 billion investment in the production of low-carbon cement and concrete. This initiative is expected to create a more competitive European market and drive innovation in sustainable construction materials (European Commission press release, May 2025).
Dive into Technavio’s robust research methodology, blending expert interviews, extensive data synthesis, and validated models for unparalleled Concrete Market insights. See full methodology.
|
Market Scope |
|
|
Report Coverage |
Details |
|
Page number |
232 |
|
Base year |
2024 |
|
Historic period |
2019-2023 |
|
Forecast period |
2025-2029 |
|
Growth momentum & CAGR |
Accelerate at a CAGR of 6% |
|
Market growth 2025-2029 |
USD 203.4 billion |
|
Market structure |
Fragmented |
|
YoY growth 2024-2025(%) |
5.7 |
|
Key countries |
US, China, Japan, Canada, Germany, India, UK, South Korea, Saudi Arabia, and Italy |
|
Competitive landscape |
Leading Companies, Market Positioning of Companies, Competitive Strategies, and Industry Risks |
Why Choose Technavio for Concrete Market Insights?
"Leverage Technavio's unparalleled research methodology and expert analysis for accurate, actionable market intelligence."
In the dynamic world of agriculture, the market plays a crucial role in supplying essential materials for greenhouse infrastructure. However, the focus is shifting towards enhancing crop productivity and sustainability, leading to a growing interest in the intersection of agriculture and concrete. One such area of exploration is the impact of concrete on agricultural practices. For instance, the use of concrete in constructing greenhouses facilitates the application of humic acids, which boost nutrient uptake in plants by up to 30% compared to traditional farming methods. Moreover, microbial inoculants can be incorporated into concrete structures, enhancing their effectiveness and increasing yield by as much as 20%. Plant hormone modulation and stress tolerance are other essential aspects of agricultural productivity. Concrete structures provide an ideal environment for maintaining optimal plant hormone levels, enabling plants to better withstand abiotic stressors such as drought. By analyzing the rhizosphere microbiome composition and promoting plant-microbe interactions, growers can optimize growth promotion and enhance biomass production by up to 15%. Soil health is a critical factor in sustainable agriculture, and concrete plays a role in improving nutrient cycling and nitrogen efficiency. Enzyme activity assays and chlorophyll content analysis are essential metrics for measuring plant vigor and crop quality. Precision agriculture applications, such as data analysis and yield component analysis, can help farmers optimize economic return by up to 25% through targeted nutrient management practices and integrated pest management strategies. Sustainable agriculture practices, including organic farming methods and soil microbial communities diversity, are increasingly important in the market. By reducing environmental impact and improving overall operational planning, concrete structures can contribute to a more efficient and eco-friendly supply chain. Ultimately, the market's role in agriculture extends beyond infrastructure, offering valuable opportunities for growth and innovation.
What are the Key Data Covered in this Concrete Market Research and Growth Report?
-
What is the expected growth of the Concrete Market between 2025 and 2029?
-
USD 203.4 billion, at a CAGR of 6%
-
-
What segmentation does the market report cover?
-
The report is segmented by Type (Ready-mix concrete and Precast concrete), End-user (Residential and Non-residential), Product (Reinforced concrete and Non-reinforced Concrete), Application (New construction, Renovation, and Repair and maintenance), and Geography (APAC, North America, Europe, Middle East and Africa, and South America)
-
-
Which regions are analyzed in the report?
-
APAC, North America, Europe, Middle East and Africa, and South America
-
-
What are the key growth drivers and market challenges?
-
Expansion of construction industry, Volatility in raw materials prices
-
-
Who are the major players in the Concrete Market?
-
Adbri Ltd., Broco Industries, Cementir Holding NV, CEMEX SAB de CV, Compagnie de Saint-Gobain SA, CRH Plc, Heidelberg Materials AG, Holcim Ltd., JSW Cement Ltd., Laing O Rourke, PPC Ltd., Shay Murtagh Precast Ltd., Sika AG, QUIKRETE Holdings Inc., Vicat, Votorantim SA, Vulcan Materials Co., Weckenmann Anlagentechnik GmbH and Co. KG, and Xella International GmbH
-
We can help! Our analysts can customize this concrete market research report to meet your requirements.
 RIA -
RIA - 
