
Construction Scaffolding Rental Market Analysis, Size, and Forecast 2026-2030: APAC (China, India, and Japan), North America (US, Canada, and Mexico), Europe (Germany, UK, and France), Middle East and Africa (Saudi Arabia, UAE, and South Africa), South America (Brazil, Argentina, and Chile), and Rest of World (ROW)

Construction Scaffolding Rental Market Analysis, Size, and Forecast 2026-2030:
APAC (China, India, and Japan), North America (US, Canada, and Mexico), Europe (Germany, UK, and France), Middle East and Africa (Saudi Arabia, UAE, and South Africa), South America (Brazil, Argentina, and Chile), and Rest of World (ROW)

Published: Oct 2026 304 Pages SKU: IRTNTR40894

Market Overview at a Glance

$3.51 B
Market Opportunity
5.3%
CAGR 2025 - 2030
40.1%
APAC Growth
$9.04 B
Supported segment 2024

Construction Scaffolding Rental Market Size 2026-2030

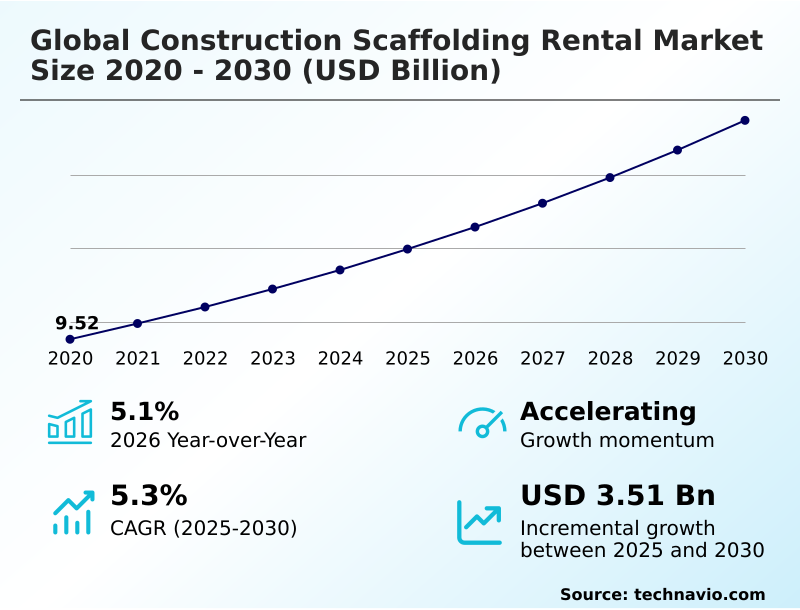
The construction scaffolding rental market size is valued to increase by USD 3.51 billion, at a CAGR of 5.3% from 2025 to 2030. Accelerating urbanization and modernization investments will drive the construction scaffolding rental market.

Major Market Trends & Insights

  • APAC dominated the market and accounted for a 40.1% growth during the forecast period.
  • By Product - Supported segment was valued at USD 9.04 billion in 2024
  • By Application - New construction segment accounted for the largest market revenue share in 2024

Market Size & Forecast

  • Market Opportunities: USD 5.96 billion
  • Market Future Opportunities: USD 3.51 billion
  • CAGR from 2025 to 2030 : 5.3%

Market Summary

  • The Construction Scaffolding Rental Market exhibits robust momentum as contractors increasingly transition from asset ownership to flexible equipment leasing frameworks. This shift is fundamentally driven by rapid urbanization and infrastructure revitalization programs, which compel builders to source scalable, safety-certified temporary structures without committing substantial capital.
  • Conversely, the market faces significant structural friction from volatile raw material costs and regional supply chain bottlenecks, which constrain the ability of rental operators to expand fleets affordably. In a practical business scenario, large-scale industrial plant turnarounds rely on temporary framework leasing to manage dynamic labor schedules and avoid ongoing equipment storage overhead.
  • By leveraging rented elevated working platforms, construction enterprises have documented a 30% reduction in upfront capital expenditures compared to legacy purchasing models. The utilization of these advanced temporary structures ensures strict adherence to occupational health directives. As project complexities escalate, the reliance on professionally managed scaffolding fleets remains critical for optimizing both site safety and operational liquidity.

What will be the Size of the Construction Scaffolding Rental Market during the forecast period?
Get Key Insights on Market Forecast (PDF) Get Free Sample

How is the Construction Scaffolding Rental Market Segmented?

The construction scaffolding rental industry research report provides comprehensive data (region-wise segment analysis), with forecasts and estimates in "USD million" for the period 2026-2030, as well as historical data from 2020-2024 for the following segments.

  • Product
    • Supported
    • Mobile
    • Suspended
  • Application
    • New construction
    • Refurbishment
    • Demolition
  • End-user
    • Non-residential
    • Residential
  • Type
    • Frame scaffolding
    • Tube and clamp scaffolding
    • Others
  • Geography
    • APAC
      • China
      • India
      • Japan
      • Australia
      • South Korea
      • Indonesia
    • North America
      • US
      • Canada
      • Mexico
    • Europe
      • Germany
      • UK
      • France
      • Italy
      • Spain
      • The Netherlands
    • Middle East and Africa
      • Saudi Arabia
      • UAE
      • South Africa
      • Turkey
      • Egypt
    • South America
      • Brazil
      • Argentina
      • Chile

By Product Insights

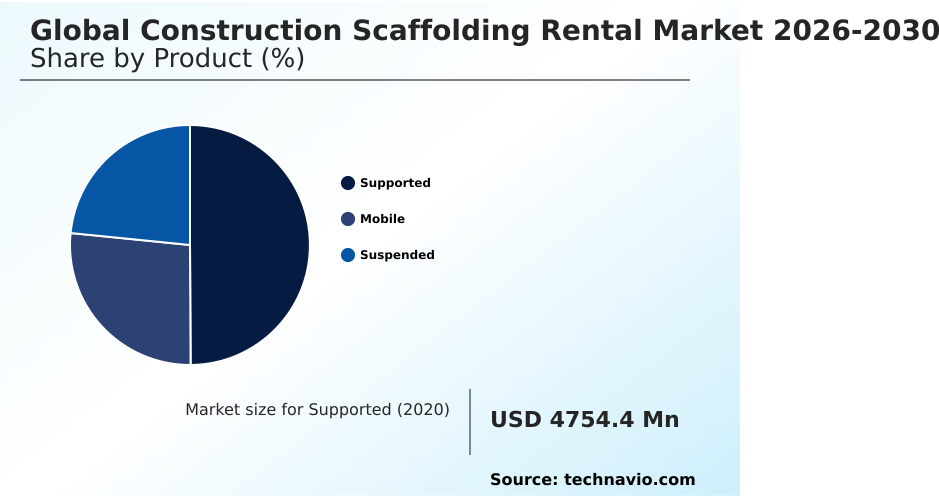
The supported segment is estimated to witness significant growth during the forecast period.

The supported configuration dominates the Construction Scaffolding Rental landscape due to its unparalleled structural load-bearing capacity and versatility across long-term developments.

These frameworks, encompassing heavy-duty tube-and-coupler systems and modern modular ringlock frameworks, are essential for commercial building retrofits and heavy civil infrastructure. By anchoring directly to the ground, they accommodate substantial material weights and multiple worker teams simultaneously.

Renting these systems allows project developers to avoid heavy fixed capital outlays while scaling platform dimensions dynamically. Operational efficiency is vastly improved, as utilizing specialized industrial access equipment can yield a 25% reduction in project setup times.

Furthermore, continuous advancements in high-tensile galvanized steel components ensure that structural deadweight minimization is achieved, thereby optimizing both transportation logistics and onsite handling safety for large-scale operations.
Get Free Sample

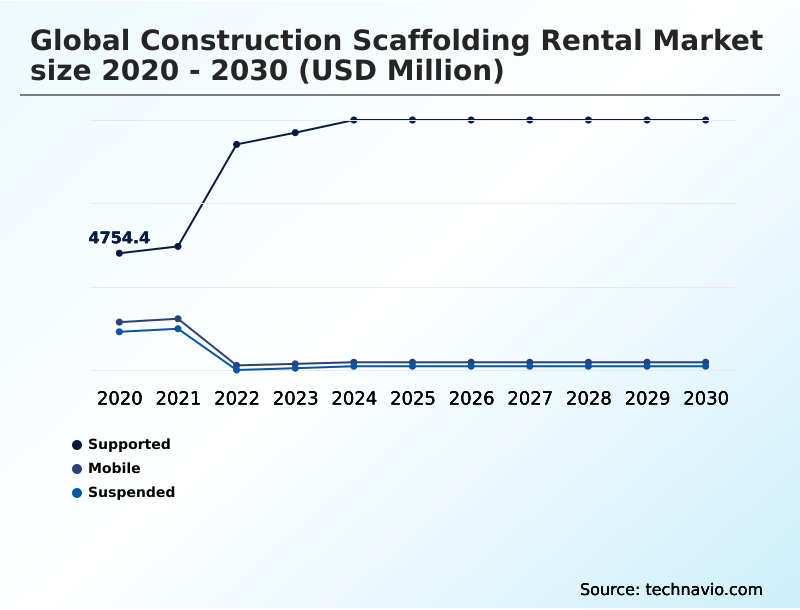
The Supported segment was valued at USD 9.04 billion in 2024 and showed a gradual increase during the forecast period.
Get Free Sample

Regional Analysis

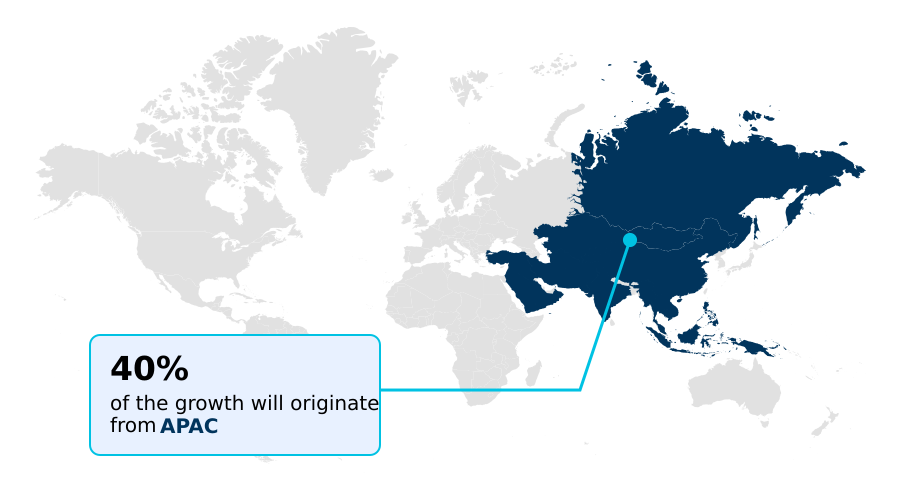
APAC is estimated to contribute 40.1% to the growth of the global market during the forecast period.Technavio’s analysts have elaborately explained the regional trends and drivers that shape the market during the forecast period.
See How Construction Scaffolding Rental Market Demand is Rising in APAC Get Free Sample

The geographic distribution of the Construction Scaffolding Rental sector reveals a stark contrast in adoption dynamics between APAC and North America.

APAC is experiencing aggressive expansion due to high-density urban developments and massive civil engineering scalability requirements, driving a 40% higher year-over-year fleet utilization rate compared to western markets.

Meanwhile, North America prioritizes structural engineering scaffolding load calculations and stringent fall-protection standards, leading to a 15% increase in demand for premium digital asset telemetry services.

This regional divergence stems from differing regulatory environments; western contractors focus heavily on capital expenditure reduction through advanced safety compliance auditing, whereas emerging markets concentrate on rapid assembly mechanisms to meet tight municipal deadlines.

Consequently, operations in APAC achieve a 20% faster project turnaround utilizing lightweight aluminum mobile towers. These distinct regional behaviors shape how rental enterprises allocate inventory, balancing structural framework dismantling speed against advanced compliance verification.

Market Dynamics

Our researchers analyzed the data with 2025 as the base year, along with the key drivers, trends, and challenges. A holistic analysis of drivers will help companies refine their marketing strategies to gain a competitive advantage.

  • The operational landscape of the Construction Scaffolding Rental sector is increasingly defined by the strategic deployment of advanced temporary access technologies. As civil engineering projects grow in scale, the demand for high-capacity modular access platforms has fundamentally reshaped how general contractors approach jobsite logistics.
  • Rather than purchasing proprietary equipment, construction firms are heavily relying on temporary elevated framework leasing solutions to manage complex architectural geometries and mitigate volatile raw material expenses. This transition significantly enhances operational planning; for instance, accessing a rented fleet allows a contractor to pivot resource allocation approximately 35% faster than managing owned, legacy equipment.
  • Furthermore, the integration of structural engineering scaffolding load calculations ensures that every erected platform meets exact safety thresholds before physical deployment. To maintain rigorous site safety standards, operators are prioritizing compliant modular ringlock access systems, which minimize manual assembly errors and improve overall worker security during high-altitude operations.
  • Additionally, leading rental organizations are deploying digital scaffolding inventory telemetry tracking to monitor asset utilization and prevent component loss across multi-phase developments. By combining these advanced materials with precise digital oversight, project managers can optimize supply chain deliveries and drastically reduce equipment storage overhead, ensuring sustained efficiency across large-scale commercial and industrial builds.
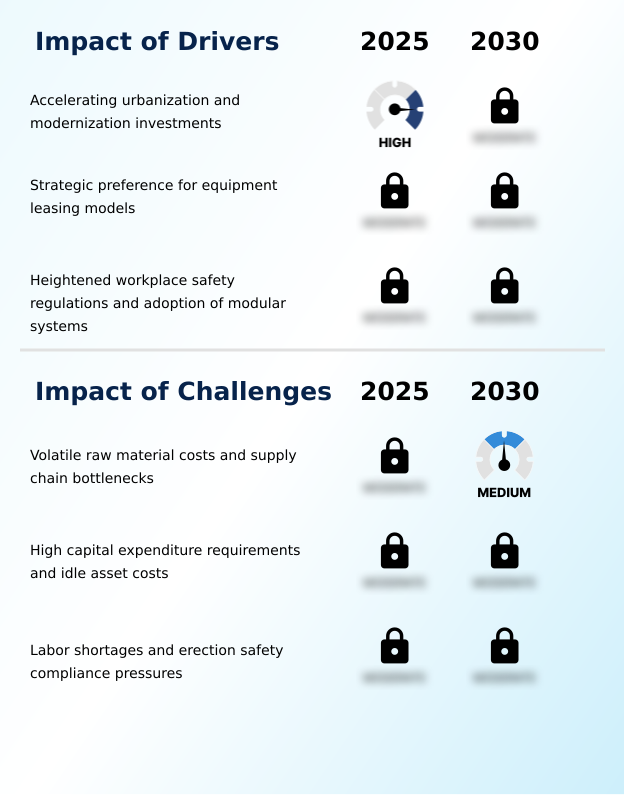
What are the key market drivers leading to the rise in the adoption of Construction Scaffolding Rental Industry?

  • Accelerating urbanization alongside extensive modernization investments serves as the primary catalyst propelling market expansion.

  • The accelerated push for infrastructure revitalization programs and industrial plant turnarounds serves as a massive driver for the Construction Scaffolding Rental sector.
  • Because modern civil engineering demands highly adaptable access configurations without the burden of long-term storage liabilities, contractors are heavily shifting toward specialized industrial access solutions.
  • This transition directly impacts business performance, allowing firms to lower upfront fixed capital outlays by an estimated 40% and improve working capital liquidity by 15%.
  • Utilizing advanced modular ringlock frameworks enables construction crews to navigate complex architectural geometries with unprecedented speed and safety.
  • Consequently, bypassing the financial risks of asset depreciation mitigation empowers developers to bid more aggressively on multi-stage engineering projects, propelling sustained demand for professionally managed temporary structures.

What are the market trends shaping the Construction Scaffolding Rental Industry?

  • The integration of digital telemetry and building information modeling represents a primary trend shaping the current market landscape. This technological advancement enables real-time structural analysis and predictive equipment management.

  • The integration of digital asset telemetry and real-time inventory tracking is fundamentally transforming the Construction Scaffolding Rental landscape. Rental organizations are adopting smart city expansions and incorporating automated site inspection protocols to enhance temporary access enclosures. This technological pivot occurs because general contractors require absolute transparency to coordinate just-in-time material deliveries and prevent costly project bottlenecks.
  • As a result, the implementation of telemetry-enabled modular scaffolding erection has improved equipment retrieval rates by 22% and reduced overall project downtime by 18%. Furthermore, the strategic deployment of predictive maintenance software minimizes the risk of structural failure, ensuring that platforms remain fully compliant throughout multi-year developments.
  • These digital innovations empower project managers to achieve superior aerial access logistics while strictly controlling operational expenses.

What challenges does the Construction Scaffolding Rental Industry face during its growth?

  • Volatile raw material costs coupled with persistent supply chain bottlenecks pose a significant structural challenge to industry growth.

  • The operational viability of the Construction Scaffolding Rental sector is significantly challenged by volatile primary metal prices and lingering supply chain disruptions. Because regional logistics optimization is frequently hampered by international maritime bottlenecks, rental providers face acute component shortages during peak building seasons.
  • This scarcity forces operators to maintain inflated buffer inventories, which subsequently increases equipment storage overhead and depresses overall profit margins. As a direct consequence, procurement-related operational costs have surged by approximately 18%, while fleet expansion timelines are frequently delayed by over 25%.
  • Furthermore, the pressure of fleet functional obsolescence forces continuous reinvestment into new lightweight composite frames to meet evolving occupational health directives, placing immense financial strain on mid-tier rental enterprises attempting to scale their high-capacity temporary framework leasing operations.

Exclusive Technavio Analysis on Customer Landscape

The construction scaffolding rental market forecasting report includes the adoption lifecycle of the market, covering from the innovator’s stage to the laggard’s stage. It focuses on adoption rates in different regions based on penetration. Furthermore, the construction scaffolding rental market report also includes key purchase criteria and drivers of price sensitivity to help companies evaluate and develop their market growth analysis strategies.
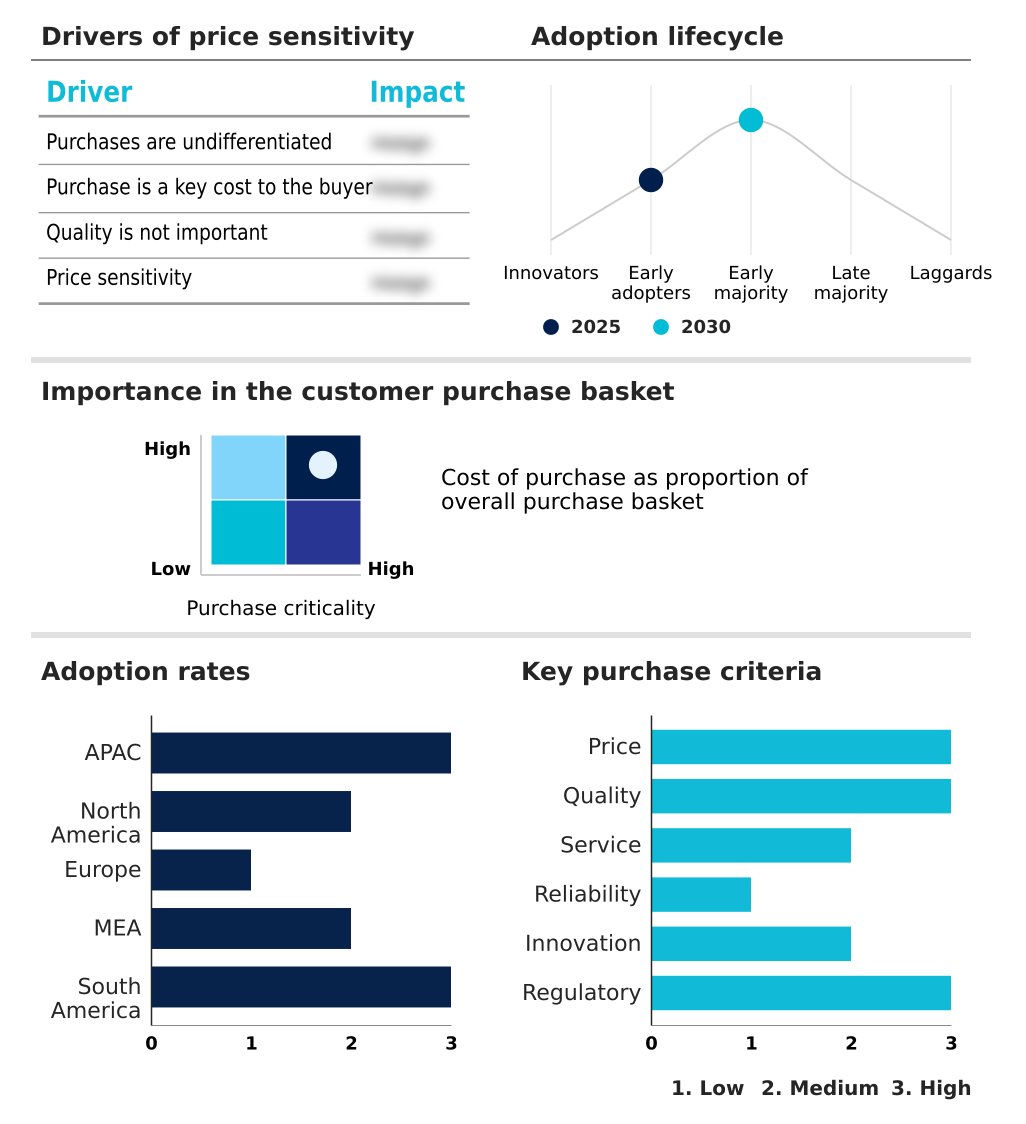
Customer Landscape of Construction Scaffolding Rental Industry

Competitive Landscape

Companies are implementing various strategies, such as strategic alliances, construction scaffolding rental market forecast, partnerships, mergers and acquisitions, geographical expansion, and product/service launches, to enhance their presence in the industry.

Acrow - Offers specialized temporary access solutions encompassing modular systems, formwork frameworks, and elevated platforms designed for complex infrastructure and structural applications.

The industry research and growth report includes detailed analyses of the competitive landscape of the market and information about key companies, including:

  • Acrow
  • Alsina Formwork
  • Altrad Group
  • Atlantic Pacific Equipment LLC
  • Brand Industrial Services Inc.
  • Doka GmbH
  • Faresin Formwork S.p.A.
  • Hunan ADTO Industrial Group Co.
  • MEVA Formwork Systems
  • PASCHAL Werk G. Maier GmbH
  • PERI SE
  • Pilosio S.p.A.
  • Scafom rux BV
  • Stepup Scaffold LLC
  • Sunbelt Rentals Inc.
  • ULMA C y E S Coop.
  • United Rentals Inc.
  • Universal Building Supply Inc.
  • Wilhelm Layher GmbH and Co. KG

Qualitative and quantitative analysis of companies has been conducted to help clients understand the wider business environment as well as the strengths and weaknesses of key industry players. Data is qualitatively analyzed to categorize companies as pure play, category-focused, industry-focused, and diversified; it is quantitatively analyzed to categorize companies as dominant, leading, strong, tentative, and weak.

Recent Development and News in Construction scaffolding rental market

  • In the Construction and Engineering industry, the accelerated transition toward high-density urban developments has necessitated the execution of complex architectural geometries, directly impacting Construction Scaffolding Rental demand by requiring highly adaptable modular ringlock frameworks.
  • Strict occupational health directives regarding fall-arrest configurations have shifted contractor preference from informal structures to engineered systems, thereby increasing the reliance on compliant modular ringlock access systems.
  • The widespread adoption of building information modeling integration for structural footprint modeling has optimized spatial planning, elevating the demand for digital scaffolding inventory telemetry tracking to synchronize equipment delivery with project phases.
  • Persistent supply chain disruptions in heavy civil infrastructure materials have driven project delays and fixed capital outlays, compelling general contractors to utilize temporary elevated framework leasing solutions to mitigate asset depreciation mitigation risks.

Dive into Technavio’s robust research methodology, blending expert interviews, extensive data synthesis, and validated models for unparalleled Construction Scaffolding Rental Market insights. See full methodology.

Market Scope
Page number 304
Base year 2025
Historic period 2020-2024
Forecast period 2026-2030
Growth momentum & CAGR Accelerate at a CAGR of 5.3%
Market growth 2026-2030 USD 3509.5 million
Market structure Fragmented
YoY growth 2025-2026(%) 5.1%
Key countries China, India, Japan, Australia, South Korea, Indonesia, US, Canada, Mexico, Germany, UK, France, Italy, Spain, The Netherlands, Saudi Arabia, UAE, South Africa, Turkey, Egypt, Brazil, Argentina and Chile
Competitive landscape Leading Companies, Market Positioning of Companies, Competitive Strategies, and Industry Risks

Request Free Sample

Research Analyst Overview

  • The Construction Scaffolding Rental sector is undergoing a profound structural evolution driven by the integration of predictive maintenance scheduling and building information modeling integration. General contractors are prioritizing turnkey temporary structures to navigate complex project lifecycles without incurring the financial burden of fleet functional obsolescence.
  • The strategic shift toward renting motorized suspended cradles and multi-directional coupling nodes directly influences boardroom-level budgeting decisions, enabling firms to reallocate capital previously trapped in depreciating assets. Utilizing Internet of Things telemetry tracking, leading construction enterprises have achieved a 30% reduction in unexpected equipment downtime, optimizing dynamic fleet allocation across dispersed sites.
  • The transition toward high-tensile galvanized steel components and advanced fall-arrest configurations ensures strict alignment with tightening safety regulations. Furthermore, accurate structural footprint modeling and rapid assembly mechanisms facilitate seamless construction facade maintenance and seismic structural shoring.
  • By implementing robust safety compliance auditing, project developers enhance elevated working platforms reliability, securing operational continuity and driving unprecedented scaffolding utilization rates across dense urban infrastructure projects.

What are the Key Data Covered in this Construction Scaffolding Rental Market Research and Growth Report?

  • What is the expected growth of the Construction Scaffolding Rental Market between 2026 and 2030?

    • USD 3.51 billion, at a CAGR of 5.3%

  • What segmentation does the market report cover?

    • The report is segmented by Product (Supported, Mobile, and Suspended), Application (New construction, Refurbishment, and Demolition), End-user (Non-residential, and Residential), Type (Frame scaffolding, Tube and clamp scaffolding, and Others) and Geography (APAC, North America, Europe, Middle East and Africa, South America)

  • Which regions are analyzed in the report?

    • APAC, North America, Europe, Middle East and Africa and South America

  • What are the key growth drivers and market challenges?

    • Accelerating urbanization and modernization investments, Volatile raw material costs and supply chain bottlenecks

  • Who are the major players in the Construction Scaffolding Rental Market?

    • Acrow, Alsina Formwork, Altrad Group, Atlantic Pacific Equipment LLC, Brand Industrial Services Inc., Doka GmbH, Faresin Formwork S.p.A., Hunan ADTO Industrial Group Co., MEVA Formwork Systems, PASCHAL Werk G. Maier GmbH, PERI SE, Pilosio S.p.A., Scafom rux BV, Stepup Scaffold LLC, Sunbelt Rentals Inc., ULMA C y E S Coop., United Rentals Inc., Universal Building Supply Inc. and Wilhelm Layher GmbH and Co. KG

Market Research Insights

  • The Construction Scaffolding Rental ecosystem is rapidly evolving as civil engineering scalability dictates new operational frameworks. By leveraging temporary framework leasing, construction firms bypass severe equipment storage overhead and streamline resource allocation. This strategic shift has enabled a 25% improvement in site logistics efficiency by optimizing regional logistics optimization and reducing idle asset durations.
  • Furthermore, the adoption of lightweight composite frames has decreased onsite worker fatigue, contributing to a 15% drop in assembly-related labor costs. Addressing stringent fall-protection standards, operators are standardizing fleets to prevent asset depreciation mitigation risks. These targeted operational enhancements allow general contractors to focus capital on core building phases rather than maintaining depreciating hardware, accelerating project delivery.

We can help! Our analysts can customize this construction scaffolding rental market research report to meet your requirements.

Get in touch

1. Executive Summary

1.1 Market overview

Executive Summary - Chart on Market Overview
Executive Summary - Data Table on Market Overview
Executive Summary - Chart on Global Market Characteristics
Executive Summary - Chart on Market by Geography
Executive Summary - Chart on Market Segmentation by Product
Executive Summary - Chart on Market Segmentation by Application
Executive Summary - Chart on Market Segmentation by End-user
Executive Summary - Chart on Market Segmentation by Type
Executive Summary - Chart on Incremental Growth
Executive Summary - Data Table on Incremental Growth
Executive Summary - Chart on Company Market Positioning

2. Technavio Analysis

2.1 Analysis of price sensitivity, lifecycle, customer purchase basket, adoption rates, and purchase criteria

2.2 Criticality of inputs and Factors of differentiation

Chart on Overview on criticality of inputs and factors of differentiation

2.3 Factors of disruption

Chart on Overview on factors of disruption

2.4 Impact of drivers and challenges

Chart on Impact of drivers and challenges in 2025 and 2030

3. Market Landscape

3.1 Market ecosystem

Chart on Parent Market
Data Table on - Parent Market

3.2 Market characteristics

Chart on Market characteristics analysis

3.3 Value chain analysis

Chart on Value chain analysis

4. Market Sizing

4.1 Market definition

Data Table on Offerings of companies included in the market definition

4.2 Market segment analysis

Market segments

4.3 Market size 2025

4.4 Market outlook: Forecast for 2025-2030

Chart on Global - Market size and forecast 2025-2030 ($ million)
Data Table on Global - Market size and forecast 2025-2030 ($ million)
Chart on Global Market: Year-over-year growth 2025-2030 (%)
Data Table on Global Market: Year-over-year growth 2025-2030 (%)

5. Historic Market Size

5.1 Global Construction Scaffolding Rental Market 2020 - 2024

Historic Market Size - Data Table on Global Construction Scaffolding Rental Market 2020 - 2024 ($ million)

5.2 Product segment analysis 2020 - 2024

Historic Market Size - Product Segment 2020 - 2024 ($ million)

5.3 Application segment analysis 2020 - 2024

Historic Market Size - Application Segment 2020 - 2024 ($ million)

5.4 End-user segment analysis 2020 - 2024

Historic Market Size - End-user Segment 2020 - 2024 ($ million)

5.5 Type segment analysis 2020 - 2024

Historic Market Size - Type Segment 2020 - 2024 ($ million)

5.6 Geography segment analysis 2020 - 2024

Historic Market Size - Geography Segment 2020 - 2024 ($ million)

5.7 Country segment analysis 2020 - 2024

Historic Market Size - Country Segment 2020 - 2024 ($ million)

6. Qualitative Analysis

6.1 Impact of AI in Global Construction Scaffolding Rental Market

6.2 Impact of Geopolitical Conflicts on Global Construction Scaffolding Rental Market

7. Five Forces Analysis

7.1 Five forces summary

Five forces analysis - Comparison between 2025 and 2030

7.2 Bargaining power of buyers

Bargaining power of buyers - Impact of key factors 2025 and 2030

7.3 Bargaining power of suppliers

Bargaining power of suppliers - Impact of key factors in 2025 and 2030

7.4 Threat of new entrants

Threat of new entrants - Impact of key factors in 2025 and 2030

7.5 Threat of substitutes

Threat of substitutes - Impact of key factors in 2025 and 2030

7.6 Threat of rivalry

Threat of rivalry - Impact of key factors in 2025 and 2030

7.7 Market condition

Chart on Market condition - Five forces 2025 and 2030

8. Market Segmentation by Product

8.1 Market segments

Chart on Product - Market share 2025-2030 (%)
Data Table on Product - Market share 2025-2030 (%)

8.2 Comparison by Product

Chart on Comparison by Product
Data Table on Comparison by Product

8.3 Supported - Market size and forecast 2025-2030

Chart on Supported - Market size and forecast 2025-2030 ($ million)
Data Table on Supported - Market size and forecast 2025-2030 ($ million)
Chart on Supported - Year-over-year growth 2025-2030 (%)
Data Table on Supported - Year-over-year growth 2025-2030 (%)

8.4 Mobile - Market size and forecast 2025-2030

Chart on Mobile - Market size and forecast 2025-2030 ($ million)
Data Table on Mobile - Market size and forecast 2025-2030 ($ million)
Chart on Mobile - Year-over-year growth 2025-2030 (%)
Data Table on Mobile - Year-over-year growth 2025-2030 (%)

8.5 Suspended - Market size and forecast 2025-2030

Chart on Suspended - Market size and forecast 2025-2030 ($ million)
Data Table on Suspended - Market size and forecast 2025-2030 ($ million)
Chart on Suspended - Year-over-year growth 2025-2030 (%)
Data Table on Suspended - Year-over-year growth 2025-2030 (%)

8.6 Market opportunity by Product

Market opportunity by Product ($ million)
Data Table on Market opportunity by Product ($ million)

9. Market Segmentation by Application

9.1 Market segments

Chart on Application - Market share 2025-2030 (%)
Data Table on Application - Market share 2025-2030 (%)

9.2 Comparison by Application

Chart on Comparison by Application
Data Table on Comparison by Application

9.3 New construction - Market size and forecast 2025-2030

Chart on New construction - Market size and forecast 2025-2030 ($ million)
Data Table on New construction - Market size and forecast 2025-2030 ($ million)
Chart on New construction - Year-over-year growth 2025-2030 (%)
Data Table on New construction - Year-over-year growth 2025-2030 (%)

9.4 Refurbishment - Market size and forecast 2025-2030

Chart on Refurbishment - Market size and forecast 2025-2030 ($ million)
Data Table on Refurbishment - Market size and forecast 2025-2030 ($ million)
Chart on Refurbishment - Year-over-year growth 2025-2030 (%)
Data Table on Refurbishment - Year-over-year growth 2025-2030 (%)

9.5 Demolition - Market size and forecast 2025-2030

Chart on Demolition - Market size and forecast 2025-2030 ($ million)
Data Table on Demolition - Market size and forecast 2025-2030 ($ million)
Chart on Demolition - Year-over-year growth 2025-2030 (%)
Data Table on Demolition - Year-over-year growth 2025-2030 (%)

9.6 Market opportunity by Application

Market opportunity by Application ($ million)
Data Table on Market opportunity by Application ($ million)

10. Market Segmentation by End-user

10.1 Market segments

Chart on End-user - Market share 2025-2030 (%)
Data Table on End-user - Market share 2025-2030 (%)

10.2 Comparison by End-user

Chart on Comparison by End-user
Data Table on Comparison by End-user

10.3 Non-residential - Market size and forecast 2025-2030

Chart on Non-residential - Market size and forecast 2025-2030 ($ million)
Data Table on Non-residential - Market size and forecast 2025-2030 ($ million)
Chart on Non-residential - Year-over-year growth 2025-2030 (%)
Data Table on Non-residential - Year-over-year growth 2025-2030 (%)

10.4 Residential - Market size and forecast 2025-2030

Chart on Residential - Market size and forecast 2025-2030 ($ million)
Data Table on Residential - Market size and forecast 2025-2030 ($ million)
Chart on Residential - Year-over-year growth 2025-2030 (%)
Data Table on Residential - Year-over-year growth 2025-2030 (%)

10.5 Market opportunity by End-user

Market opportunity by End-user ($ million)
Data Table on Market opportunity by End-user ($ million)

11. Market Segmentation by Type

11.1 Market segments

Chart on Type - Market share 2025-2030 (%)
Data Table on Type - Market share 2025-2030 (%)

11.2 Comparison by Type

Chart on Comparison by Type
Data Table on Comparison by Type

11.3 Frame scaffolding - Market size and forecast 2025-2030

Chart on Frame scaffolding - Market size and forecast 2025-2030 ($ million)
Data Table on Frame scaffolding - Market size and forecast 2025-2030 ($ million)
Chart on Frame scaffolding - Year-over-year growth 2025-2030 (%)
Data Table on Frame scaffolding - Year-over-year growth 2025-2030 (%)

11.4 Tube and clamp scaffolding - Market size and forecast 2025-2030

Chart on Tube and clamp scaffolding - Market size and forecast 2025-2030 ($ million)
Data Table on Tube and clamp scaffolding - Market size and forecast 2025-2030 ($ million)
Chart on Tube and clamp scaffolding - Year-over-year growth 2025-2030 (%)
Data Table on Tube and clamp scaffolding - Year-over-year growth 2025-2030 (%)

11.5 Others - Market size and forecast 2025-2030

Chart on Others - Market size and forecast 2025-2030 ($ million)
Data Table on Others - Market size and forecast 2025-2030 ($ million)
Chart on Others - Year-over-year growth 2025-2030 (%)
Data Table on Others - Year-over-year growth 2025-2030 (%)

11.6 Market opportunity by Type

Market opportunity by Type ($ million)
Data Table on Market opportunity by Type ($ million)

12. Customer Landscape

12.1 Customer landscape overview

Analysis of price sensitivity, lifecycle, customer purchase basket, adoption rates, and purchase criteria

13. Geographic Landscape

13.1 Geographic segmentation

Chart on Market share by geography 2025-2030 (%)
Data Table on Market share by geography 2025-2030 (%)

13.2 Geographic comparison

Chart on Geographic comparison
Data Table on Geographic comparison

13.3 APAC - Market size and forecast 2025-2030

Chart on APAC - Market size and forecast 2025-2030 ($ million)
Data Table on APAC - Market size and forecast 2025-2030 ($ million)
Chart on APAC - Year-over-year growth 2025-2030 (%)
Data Table on APAC - Year-over-year growth 2025-2030 (%)
Chart on Regional Comparison - APAC
Data Table on Regional Comparison - APAC

13.3.1 China - Market size and forecast 2025-2030

Chart on China - Market size and forecast 2025-2030 ($ million)
Data Table on China - Market size and forecast 2025-2030 ($ million)
Chart on China - Year-over-year growth 2025-2030 (%)
Data Table on China - Year-over-year growth 2025-2030 (%)

13.3.2 India - Market size and forecast 2025-2030

Chart on India - Market size and forecast 2025-2030 ($ million)
Data Table on India - Market size and forecast 2025-2030 ($ million)
Chart on India - Year-over-year growth 2025-2030 (%)
Data Table on India - Year-over-year growth 2025-2030 (%)

13.3.3 Japan - Market size and forecast 2025-2030

Chart on Japan - Market size and forecast 2025-2030 ($ million)
Data Table on Japan - Market size and forecast 2025-2030 ($ million)
Chart on Japan - Year-over-year growth 2025-2030 (%)
Data Table on Japan - Year-over-year growth 2025-2030 (%)

13.3.4 Australia - Market size and forecast 2025-2030

Chart on Australia - Market size and forecast 2025-2030 ($ million)
Data Table on Australia - Market size and forecast 2025-2030 ($ million)
Chart on Australia - Year-over-year growth 2025-2030 (%)
Data Table on Australia - Year-over-year growth 2025-2030 (%)

13.3.5 South Korea - Market size and forecast 2025-2030

Chart on South Korea - Market size and forecast 2025-2030 ($ million)
Data Table on South Korea - Market size and forecast 2025-2030 ($ million)
Chart on South Korea - Year-over-year growth 2025-2030 (%)
Data Table on South Korea - Year-over-year growth 2025-2030 (%)

13.3.6 Indonesia - Market size and forecast 2025-2030

Chart on Indonesia - Market size and forecast 2025-2030 ($ million)
Data Table on Indonesia - Market size and forecast 2025-2030 ($ million)
Chart on Indonesia - Year-over-year growth 2025-2030 (%)
Data Table on Indonesia - Year-over-year growth 2025-2030 (%)

13.4 North America - Market size and forecast 2025-2030

Chart on North America - Market size and forecast 2025-2030 ($ million)
Data Table on North America - Market size and forecast 2025-2030 ($ million)
Chart on North America - Year-over-year growth 2025-2030 (%)
Data Table on North America - Year-over-year growth 2025-2030 (%)
Chart on Regional Comparison - North America
Data Table on Regional Comparison - North America

13.4.1 US - Market size and forecast 2025-2030

Chart on US - Market size and forecast 2025-2030 ($ million)
Data Table on US - Market size and forecast 2025-2030 ($ million)
Chart on US - Year-over-year growth 2025-2030 (%)
Data Table on US - Year-over-year growth 2025-2030 (%)

13.4.2 Canada - Market size and forecast 2025-2030

Chart on Canada - Market size and forecast 2025-2030 ($ million)
Data Table on Canada - Market size and forecast 2025-2030 ($ million)
Chart on Canada - Year-over-year growth 2025-2030 (%)
Data Table on Canada - Year-over-year growth 2025-2030 (%)

13.4.3 Mexico - Market size and forecast 2025-2030

Chart on Mexico - Market size and forecast 2025-2030 ($ million)
Data Table on Mexico - Market size and forecast 2025-2030 ($ million)
Chart on Mexico - Year-over-year growth 2025-2030 (%)
Data Table on Mexico - Year-over-year growth 2025-2030 (%)

13.5 Europe - Market size and forecast 2025-2030

Chart on Europe - Market size and forecast 2025-2030 ($ million)
Data Table on Europe - Market size and forecast 2025-2030 ($ million)
Chart on Europe - Year-over-year growth 2025-2030 (%)
Data Table on Europe - Year-over-year growth 2025-2030 (%)
Chart on Regional Comparison - Europe
Data Table on Regional Comparison - Europe

13.5.1 Germany - Market size and forecast 2025-2030

Chart on Germany - Market size and forecast 2025-2030 ($ million)
Data Table on Germany - Market size and forecast 2025-2030 ($ million)
Chart on Germany - Year-over-year growth 2025-2030 (%)
Data Table on Germany - Year-over-year growth 2025-2030 (%)

13.5.2 UK - Market size and forecast 2025-2030

Chart on UK - Market size and forecast 2025-2030 ($ million)
Data Table on UK - Market size and forecast 2025-2030 ($ million)
Chart on UK - Year-over-year growth 2025-2030 (%)
Data Table on UK - Year-over-year growth 2025-2030 (%)

13.5.3 France - Market size and forecast 2025-2030

Chart on France - Market size and forecast 2025-2030 ($ million)
Data Table on France - Market size and forecast 2025-2030 ($ million)
Chart on France - Year-over-year growth 2025-2030 (%)
Data Table on France - Year-over-year growth 2025-2030 (%)

13.5.4 Italy - Market size and forecast 2025-2030

Chart on Italy - Market size and forecast 2025-2030 ($ million)
Data Table on Italy - Market size and forecast 2025-2030 ($ million)
Chart on Italy - Year-over-year growth 2025-2030 (%)
Data Table on Italy - Year-over-year growth 2025-2030 (%)

13.5.5 Spain - Market size and forecast 2025-2030

Chart on Spain - Market size and forecast 2025-2030 ($ million)
Data Table on Spain - Market size and forecast 2025-2030 ($ million)
Chart on Spain - Year-over-year growth 2025-2030 (%)
Data Table on Spain - Year-over-year growth 2025-2030 (%)

13.5.6 The Netherlands - Market size and forecast 2025-2030

Chart on The Netherlands - Market size and forecast 2025-2030 ($ million)
Data Table on The Netherlands - Market size and forecast 2025-2030 ($ million)
Chart on The Netherlands - Year-over-year growth 2025-2030 (%)
Data Table on The Netherlands - Year-over-year growth 2025-2030 (%)

13.6 Middle East and Africa - Market size and forecast 2025-2030

Chart on Middle East and Africa - Market size and forecast 2025-2030 ($ million)
Data Table on Middle East and Africa - Market size and forecast 2025-2030 ($ million)
Chart on Middle East and Africa - Year-over-year growth 2025-2030 (%)
Data Table on Middle East and Africa - Year-over-year growth 2025-2030 (%)
Chart on Regional Comparison - Middle East and Africa
Data Table on Regional Comparison - Middle East and Africa

13.6.1 Saudi Arabia - Market size and forecast 2025-2030

Chart on Saudi Arabia - Market size and forecast 2025-2030 ($ million)
Data Table on Saudi Arabia - Market size and forecast 2025-2030 ($ million)
Chart on Saudi Arabia - Year-over-year growth 2025-2030 (%)
Data Table on Saudi Arabia - Year-over-year growth 2025-2030 (%)

13.6.2 UAE - Market size and forecast 2025-2030

Chart on UAE - Market size and forecast 2025-2030 ($ million)
Data Table on UAE - Market size and forecast 2025-2030 ($ million)
Chart on UAE - Year-over-year growth 2025-2030 (%)
Data Table on UAE - Year-over-year growth 2025-2030 (%)

13.6.3 South Africa - Market size and forecast 2025-2030

Chart on South Africa - Market size and forecast 2025-2030 ($ million)
Data Table on South Africa - Market size and forecast 2025-2030 ($ million)
Chart on South Africa - Year-over-year growth 2025-2030 (%)
Data Table on South Africa - Year-over-year growth 2025-2030 (%)

13.6.4 Turkey - Market size and forecast 2025-2030

Chart on Turkey - Market size and forecast 2025-2030 ($ million)
Data Table on Turkey - Market size and forecast 2025-2030 ($ million)
Chart on Turkey - Year-over-year growth 2025-2030 (%)
Data Table on Turkey - Year-over-year growth 2025-2030 (%)

13.6.5 Egypt - Market size and forecast 2025-2030

Chart on Egypt - Market size and forecast 2025-2030 ($ million)
Data Table on Egypt - Market size and forecast 2025-2030 ($ million)
Chart on Egypt - Year-over-year growth 2025-2030 (%)
Data Table on Egypt - Year-over-year growth 2025-2030 (%)

13.7 South America - Market size and forecast 2025-2030

Chart on South America - Market size and forecast 2025-2030 ($ million)
Data Table on South America - Market size and forecast 2025-2030 ($ million)
Chart on South America - Year-over-year growth 2025-2030 (%)
Data Table on South America - Year-over-year growth 2025-2030 (%)
Chart on Regional Comparison - South America
Data Table on Regional Comparison - South America

13.7.1 Brazil - Market size and forecast 2025-2030

Chart on Brazil - Market size and forecast 2025-2030 ($ million)
Data Table on Brazil - Market size and forecast 2025-2030 ($ million)
Chart on Brazil - Year-over-year growth 2025-2030 (%)
Data Table on Brazil - Year-over-year growth 2025-2030 (%)

13.7.2 Argentina - Market size and forecast 2025-2030

Chart on Argentina - Market size and forecast 2025-2030 ($ million)
Data Table on Argentina - Market size and forecast 2025-2030 ($ million)
Chart on Argentina - Year-over-year growth 2025-2030 (%)
Data Table on Argentina - Year-over-year growth 2025-2030 (%)

13.7.3 Chile - Market size and forecast 2025-2030

Chart on Chile - Market size and forecast 2025-2030 ($ million)
Data Table on Chile - Market size and forecast 2025-2030 ($ million)
Chart on Chile - Year-over-year growth 2025-2030 (%)
Data Table on Chile - Year-over-year growth 2025-2030 (%)

13.8 Market opportunity by geography

Market opportunity by geography ($ million)
Data Tables on Market opportunity by geography ($ million)

14. Drivers, Challenges, and Opportunity

14.1 Market drivers

Accelerating urbanization and modernization investments
Strategic preference for equipment leasing models
Heightened workplace safety regulations and adoption of modular systems

14.2 Market challenges

Volatile raw material costs and supply chain bottlenecks
High capital expenditure requirements and idle asset costs
Labor shortages and erection safety compliance pressures

14.3 Impact of drivers and challenges

Impact of drivers and challenges in 2025 and 2030

14.4 Market opportunities

Integration of digital telemetry and building information modeling
Transition toward lightweight, high-tensile composite materials
Strategic emphasis on comprehensive safety management

15. Competitive Landscape

15.1 Overview

15.2

Overview on criticality of inputs and factors of differentiation

15.3 Landscape disruption

Overview on factors of disruption

15.4 Industry risks

Impact of key risks on business

16. Competitive Analysis

16.1 Companies profiled

Companies covered

16.2 Company ranking index

16.3 Market positioning of companies

Matrix on companies position and classification

16.4 Alsina Formwork

Alsina Formwork - Overview
Alsina Formwork - Product / Service
Alsina Formwork - Key offerings
SWOT

16.5 Altrad Group

Altrad Group - Overview
Altrad Group - Product / Service
Altrad Group - Key offerings
SWOT

16.6 Atlantic Pacific Equipment LLC

Atlantic Pacific Equipment LLC - Overview
Atlantic Pacific Equipment LLC - Product / Service
Atlantic Pacific Equipment LLC - Key offerings
SWOT

16.7 Brand Industrial Services Inc.

Brand Industrial Services Inc. - Overview
Brand Industrial Services Inc. - Product / Service
Brand Industrial Services Inc. - Key offerings
SWOT

16.8 Doka GmbH

Doka GmbH - Overview
Doka GmbH - Product / Service
Doka GmbH - Key offerings
SWOT

16.9 Faresin Formwork S.p.A.

Faresin Formwork S.p.A. - Overview
Faresin Formwork S.p.A. - Product / Service
Faresin Formwork S.p.A. - Key offerings
SWOT

16.10 Hunan ADTO Industrial Group Co.

Hunan ADTO Industrial Group Co. - Overview
Hunan ADTO Industrial Group Co. - Product / Service
Hunan ADTO Industrial Group Co. - Key offerings
SWOT

16.11 MEVA Formwork Systems

MEVA Formwork Systems - Overview
MEVA Formwork Systems - Product / Service
MEVA Formwork Systems - Key offerings
SWOT

16.12 PASCHAL Werk G. Maier GmbH

PASCHAL Werk G. Maier GmbH - Overview
PASCHAL Werk G. Maier GmbH - Product / Service
PASCHAL Werk G. Maier GmbH - Key offerings
SWOT

16.13 PERI SE

PERI SE - Overview
PERI SE - Product / Service
PERI SE - Key offerings
SWOT

16.14 Sunbelt Rentals Inc.

Sunbelt Rentals Inc. - Overview
Sunbelt Rentals Inc. - Business segments
Sunbelt Rentals Inc. - Key offerings
Sunbelt Rentals Inc. - Segment focus
SWOT

16.15 ULMA C y E S Coop.

ULMA C y E S Coop. - Overview
ULMA C y E S Coop. - Product / Service
ULMA C y E S Coop. - Key offerings
SWOT

16.16 United Rentals Inc.

United Rentals Inc. - Overview
United Rentals Inc. - Business segments
United Rentals Inc. - Key offerings
United Rentals Inc. - Segment focus
SWOT

16.17 Universal Building Supply Inc.

Universal Building Supply Inc. - Overview
Universal Building Supply Inc. - Product / Service
Universal Building Supply Inc. - Key offerings
SWOT

16.18 Wilhelm Layher GmbH and Co. KG

Wilhelm Layher GmbH and Co. KG - Overview
Wilhelm Layher GmbH and Co. KG - Product / Service
Wilhelm Layher GmbH and Co. KG - Key offerings
SWOT

17. Appendix

17.1 Scope of the report

Market definition
Objectives
Notes and caveats

17.2 Inclusions and exclusions checklist

Inclusions checklist
Exclusions checklist

17.3 Currency conversion rates for US$

17.4 Research methodology

17.5 Data procurement

Information sources

17.6 Data validation

17.7 Validation techniques employed for market sizing

17.8 Data synthesis

17.9 360 degree market analysis

17.10 List of abbreviations

Research Methodology

Technavio presents a detailed picture of the market by way of study, synthesis, and summation of data from multiple sources. The analysts have presented the various facets of the market with a particular focus on identifying the key industry influencers. The data thus presented is comprehensive, reliable, and the result of extensive research, both primary and secondary.

INFORMATION SOURCES

Primary sources

  • Manufacturers and suppliers
  • Channel partners
  • Industry experts
  • Strategic decision makers

Secondary sources

  • Industry journals and periodicals
  • Government data
  • Financial reports of key industry players
  • Historical data
  • Press releases

DATA ANALYSIS

Data Synthesis

  • Collation of data
  • Estimation of key figures
  • Analysis of derived insights

Data Validation

  • Triangulation with data models
  • Reference against proprietary databases
  • Corroboration with industry experts

REPORT WRITING

Qualitative

  • Market drivers
  • Market challenges
  • Market trends
  • Five forces analysis

Quantitative

  • Market size and forecast
  • Market segmentation
  • Geographical insights
  • Competitive landscape

Interested in this report?

Get your sample now to see our research methodology and insights!

Download Now

Frequently Asked Questions

Construction Scaffolding Rental market growth will increase by USD 3509.5 million during 2026-2030.

The Construction Scaffolding Rental market is expected to grow at a CAGR of 5.3% during 2026-2030.

Construction Scaffolding Rental market is segmented by Product (Supported, Mobile, Suspended) Application (New construction, Refurbishment, Demolition) End-user (Non-residential, Residential) Type (Frame scaffolding, Tube and clamp scaffolding, Others)

Acrow, Alsina Formwork, Altrad Group, Atlantic Pacific Equipment LLC, Brand Industrial Services Inc., Doka GmbH, Faresin Formwork S.p.A., Hunan ADTO Industrial Group Co., MEVA Formwork Systems, PASCHAL Werk G. Maier GmbH, PERI SE, Pilosio S.p.A., Scafom rux BV, Stepup Scaffold LLC, Sunbelt Rentals Inc., ULMA C y E S Coop., United Rentals Inc., Universal Building Supply Inc., Wilhelm Layher GmbH and Co. KG are a few of the key vendors in the Construction Scaffolding Rental market.

APAC will register the highest growth rate of 40.1% among the other regions. Therefore, the Construction Scaffolding Rental market in APAC is expected to garner significant business opportunities for the vendors during the forecast period.

China, India, Japan, Australia, South Korea, Indonesia, US, Canada, Mexico, Germany, UK, France, Italy, Spain, The Netherlands, Saudi Arabia, UAE, South Africa, Turkey, Egypt, Brazil, Argentina, Chile

  • Accelerating urbanization and modernization investments is the driving factor this market.

The Construction Scaffolding Rental market vendors should focus on grabbing business opportunities from the Product segment as it accounted for the largest market share in the base year.
RIA - Research AI Assistant
Ask RIA
