Real Estate Market Size 2025-2029
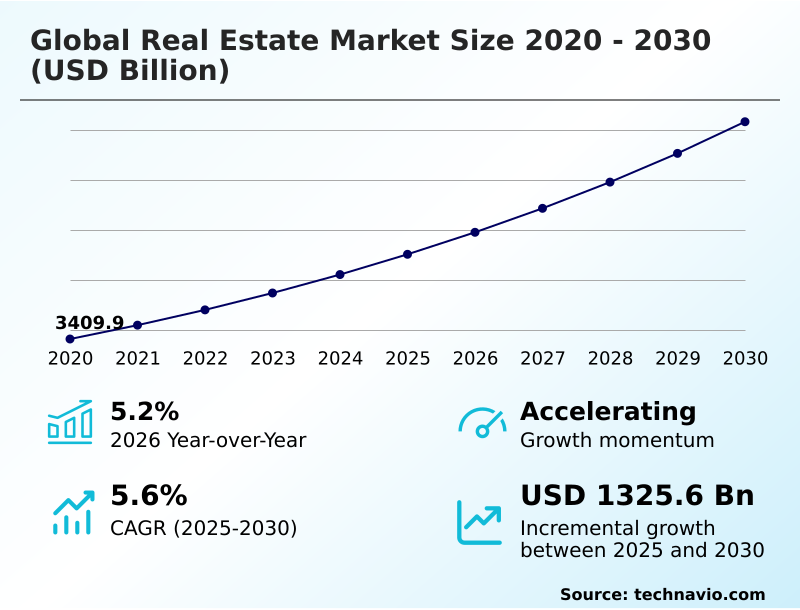
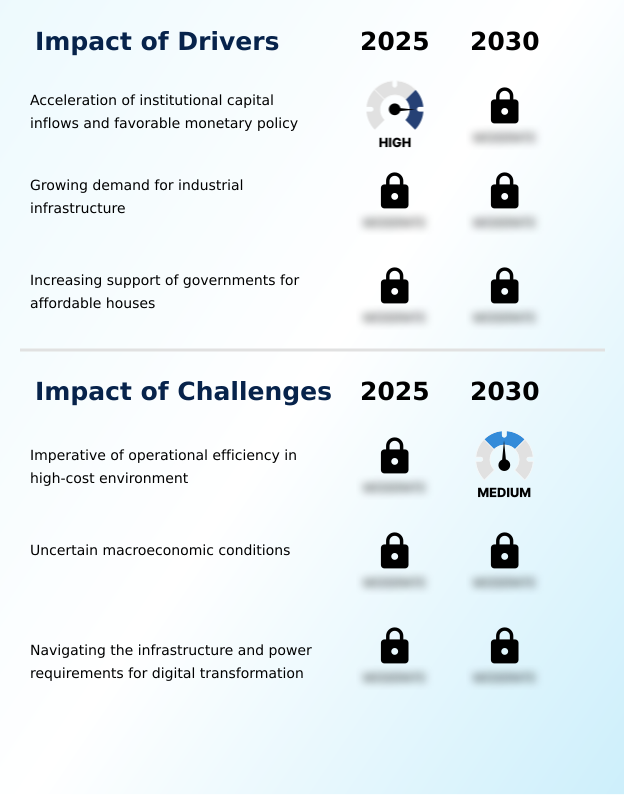
The real estate market size is valued to increase USD 1258.6 billion, at a CAGR of 5.6% from 2024 to 2029. Growing aggregate private investment will drive the real estate market.
Major Market Trends & Insights
- APAC dominated the market and accounted for a 64% growth during the forecast period.
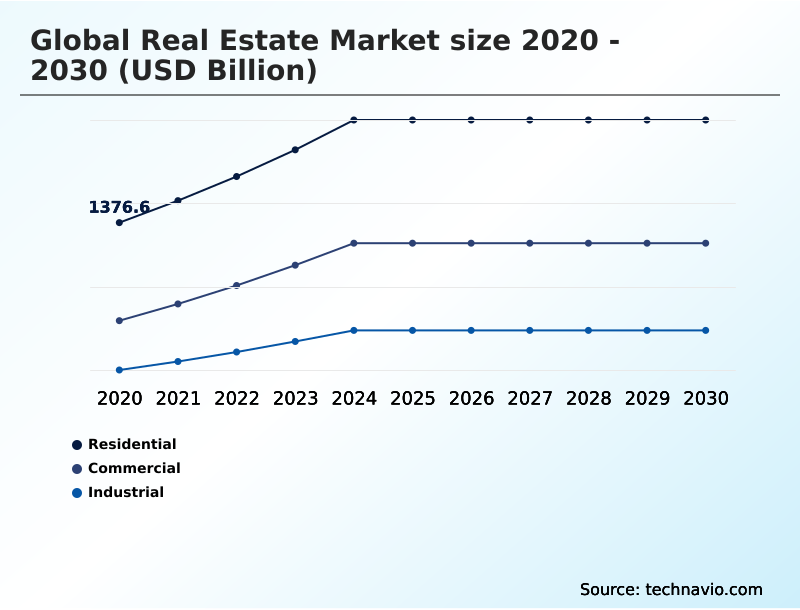
- By Type - Residential segment was valued at USD 1440.30 billion in 2023
- By Business Segment - Rental segment accounted for the largest market revenue share in 2023
Market Size & Forecast
- Market Opportunities: USD 48.03 billion
- Market Future Opportunities: USD 1258.60 billion
- CAGR from 2024 to 2029 : 5.6%
Market Summary
- In the dynamic realm of global real estate, private investment continues to surge, reaching an impressive USD 2.6 trillion in 2020. This significant influx of capital underscores the sector's enduring appeal to investors, driven by factors such as stable returns, inflation hedging, and the ongoing demand for shelter and commercial real estate space. Simultaneously, marketing initiatives have gained momentum, with digital platforms and virtual tours becoming increasingly popular.
- However, regulatory uncertainty looms, posing challenges for market participants. Amidst this complex landscape, real estate remains a vital component of the global economy, continually evolving to meet the shifting needs of businesses and individuals alike.
What will be the Size of the Real Estate Market during the forecast period?

Get Key Insights on Market Forecast (PDF) Request Free Sample
How is the Real Estate Market Segmented ?
The real estate industry research report provides comprehensive data (region-wise segment analysis), with forecasts and estimates in "USD billion" for the period 2025-2029, as well as historical data from 2019-2023 for the following segments.
- Type
- Residential
- Commercial
- Industrial
- Business Segment
- Manufacturing Type
- New construction
- Renovation and redevelopment
- Land development
- Geography
- North America
- Europe
- APAC
- Australia
- China
- India
- Japan
- South Korea
- South America
- Rest of World (ROW)
By Type Insights
The residential segment is estimated to witness significant growth during the forecast period.
Amidst the dynamic real estate landscape, the residential sector encompasses the buying and selling of various dwelling types, including single-family homes, apartments, townhouses, and more. This segment experiences continuous growth, fueled by increasing millennial homeownership rates and urbanization trends. Notably, the APAC region, specifically China, dominates the market share, driven by escalating homeownership numbers. Concurrently, the Indian real estate sector thrives due to the demand for affordable housing, with initiatives like Pradhan Mantri Awas Yojana (PMAY) spurring the development of affordable housing projects. In this evolving market, various aspects such as environmental impact studies, capital appreciation potential, title insurance coverage, building lifecycle costs, mortgage interest rates, and structural engineering analysis play crucial roles.

Request Free Sample
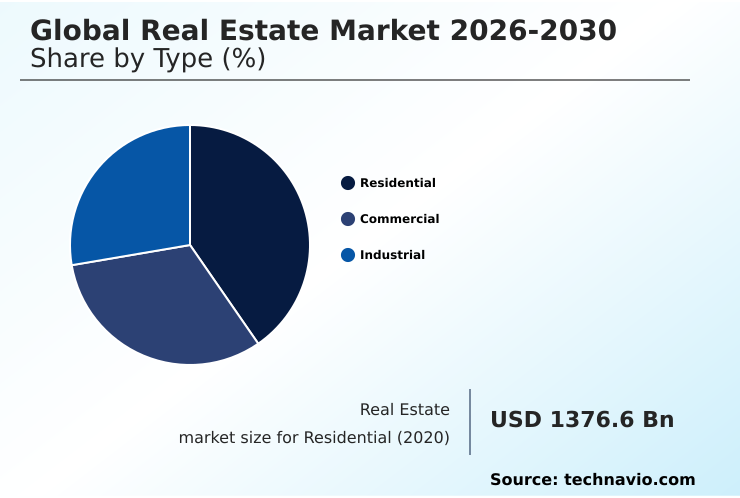
The Residential segment was valued at USD 1440.30 billion in 2019 and showed a gradual increase during the forecast period.
Property tax appeals, property insurance premiums, property tax assessments, property marketing strategies, building material pricing, property management software, land surveying techniques, zoning regulations compliance, architectural design features, building code compliance, multifamily property management, rental yield calculations, construction cost estimation, energy efficiency ratings, green building certifications, tenant screening processes, investment property returns, property development plans, geotechnical site investigations, sustainable building practices, due diligence procedures, HVAC system efficiency, property renovation costs, market value appraisals, building permit acquisition, and property valuation models significantly impact the sector's progression. As of 2021, the market is projected to reach a value of USD 33.3 trillion, underscoring its substantial influence on the global economy.

Request Free Sample
Regional Analysis
APAC is estimated to contribute 64% to the growth of the global market during the forecast period. Technavio's analysts have elaborately explained the regional trends and drivers that shape the market during the forecast period.

See How Real Estate Market Demand is Rising in APAC Request Free Sample
The APAC region held the largest share of the market in 2024, driven by factors such as rapid urbanization and increasing spending capacity. This trend is expected to continue during the forecast period. The overall health of the economy significantly influences the value of real estate. Key economic indicators, including GDP, employment data, and manufacturing activity, provide insight into the market's growth.
In APAC, countries like India and China are witnessing a surge in residential and commercial projects, contributing to the region's market dominance.
Market Dynamics
Our researchers analyzed the data with 2024 as the base year, along with the key drivers, trends, and challenges. A holistic analysis of drivers will help companies refine their marketing strategies to gain a competitive advantage.
The market is a dynamic and complex industry that presents both opportunities and challenges for investors and developers. One significant factor influencing property values is the impact of interest rate changes. As rates rise, borrowing costs increase, making it more expensive to finance real estate projects and potentially reducing demand for properties. Zoning regulations also play a crucial role in shaping the real estate landscape. These regulations can facilitate or hinder development projects, depending on their specifications. Property tax assessment appeals are another important consideration, as they can impact a property's value and, consequently, its profitability. To improve rental property yields, strategies such as increasing rents, reducing vacancies, and implementing cost-effective property improvements can be employed. Calculating return on investment in real estate involves analyzing various factors, including cash flow, financing costs, and property appreciation potential. Due diligence is essential in real estate transactions to mitigate risks and ensure a thorough understanding of the property's condition, zoning, environmental considerations, and legal aspects. Environmental factors, such as contaminated land or the need for energy efficiency measures, can significantly impact a property's valuation. Factors affecting the valuation of commercial properties include location, size, condition, and income potential. Sustainable building practices can offer benefits for property owners, such as lower operating costs, improved tenant satisfaction, and potential tax incentives. Analyzing construction cost drivers is essential to accurately budget for development projects. Property management software features comparison is crucial for selecting the most effective tools to manage properties efficiently. Tenant selection criteria and risk assessment are essential components of a successful rental strategy. Marketing strategies, such as targeted advertising and property showcasing, can help attract high-quality tenants. Common issues in property insurance claims include coverage disputes, underinsurance, and fraud. Understanding property tax assessment appeals can help property owners challenge assessments they believe are inaccurate. Legal considerations in real estate transactions include contract negotiation, title insurance, and property disputes. Building code compliance and permit applications are essential for ensuring safety and legality in property development. Energy efficiency measures in residential buildings can improve tenant satisfaction and reduce utility costs. Building material pricing and procurement strategies can significantly impact construction budgets. Geotechnical investigation techniques are crucial for assessing a property's structural integrity and potential environmental risks.

What are the key market drivers leading to the rise in the adoption of Real Estate Industry?
- The primary catalyst fueling market growth is the increasing aggregate private investment."
- Aggregate private investments encompass the funds allocated by individuals and businesses towards real or physical assets, primarily in the commercial and residential sectors. These sectors account for a significant portion of investments, with a substantial focus on land, offices, buildings, apartments, and other physical structures. The business sector predominantly invests in equipment and software, while a considerable portion goes towards physical structures.
- The escalating investments by industries fuel the demand for the market, enabling strategic planning and growth. This trend underscores the dynamic nature of the market and its applications across various sectors. Investments in real estate provide a stable return on investment and contribute to economic growth, making it a vital component of the global economy.
What are the market trends shaping the Real Estate Industry?
- Marketing initiatives are increasingly becoming more prevalent in the business world. This trend signifies a significant focus on promoting products and services to expand customer bases.
- In the dynamic market, companies employ integrated marketing communication strategies to showcase their offerings. They utilize various channels, including newspapers, magazines, and social media, to engage customers and build brand authenticity. A creative approach, such as TV advertisement campaigns, is often followed by a comprehensive marketing campaign. This includes Internet pre-roll, a broad social media and blogging program, and an interactive website. Visual content on social media platforms is particularly effective in driving customer engagement and fostering online brand communities.
- Real estate companies also utilize Instagram to exhibit their existing and upcoming projects, further expanding their reach. This multifaceted marketing approach ensures a cohesive brand message and generates consumer interest in the companies' real estate solutions.
What challenges does the Real Estate Industry face during its growth?
- The real estate industry's growth is significantly impacted by regulatory uncertainty, which poses a substantial challenge.
- Real estate development and operation in a stable regulatory environment is crucial for companies to minimize costs, reduce risks, and ensure predictability. However, the current regulatory landscape, encompassing federal, state, and local levels, exhibits a lack of clarity, durability, and predictability, posing challenges for real estate owners and operators. Furthermore, governments worldwide are implementing regulations focusing on the environmental, social, and government (ESG) performance and disclosure of real estate assets. This regulatory evolution necessitates adaptation and compliance, adding to the complexity and uncertainty of the real estate sector.
- The continuous changes in regulatory requirements and development standards can significantly impact the feasibility and profitability of projects, making it essential for real estate companies to stay informed and agile in navigating this evolving landscape.
Exclusive Technavio Analysis on Customer Landscape
The real estate market forecasting report includes the adoption lifecycle of the market, covering from the innovator's stage to the laggard's stage. It focuses on adoption rates in different regions based on penetration. Furthermore, the real estate market report also includes key purchase criteria and drivers of price sensitivity to help companies evaluate and develop their market growth analysis strategies.

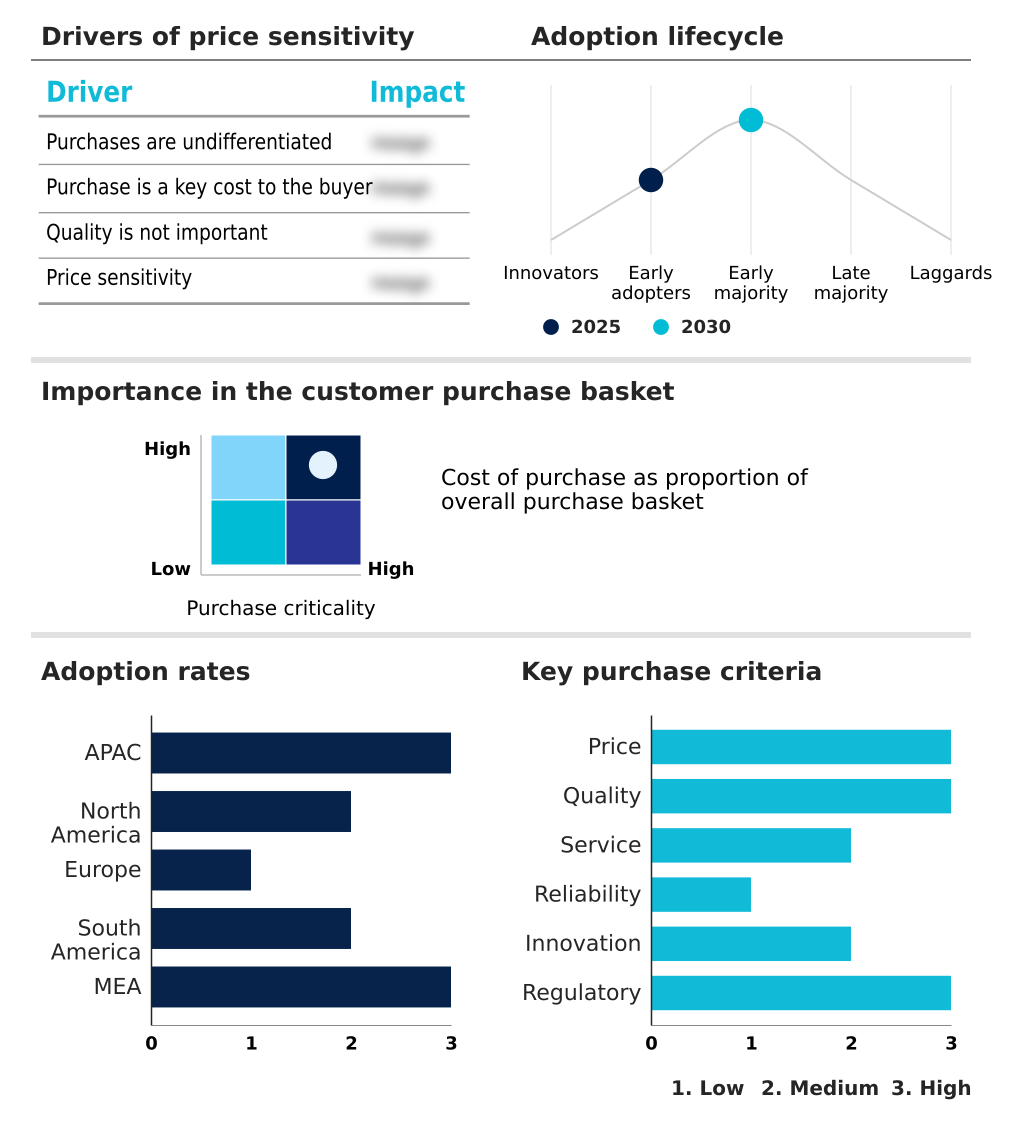
Customer Landscape of Real Estate Industry
Competitive Landscape
Companies are implementing various strategies, such as strategic alliances, real estate market forecast, partnerships, mergers and acquisitions, geographical expansion, and product/service launches, to enhance their presence in the industry.
Boston Commercial Properties Inc. - This company specializes in providing comprehensive real estate services, including tenant and relocation management, as well as consulting for corporate real estate needs.
The industry research and growth report includes detailed analyses of the competitive landscape of the market and information about key companies, including:
- Boston Commercial Properties Inc.
- Brigade Enterprises
- Brookfield Business Partners LP
- CBRE Group Inc.
- Christies International Real Estate
- Dalian Wanda Group
- DLF Ltd.
- Keller Williams Realty Inc.
- Lee and Associates Licensing and Administration Co. LP
- Link Asset Management Ltd.
- Marcus and Millichap Real Estate Investment Services Inc.
- MaxWell Realty Canada
- NAI Global
- Nakheel PJSC
- Prologis Inc.
- RAK PROPERTIES
- Segro Plc
- Shannon Waltchack
- TCN Worldwide
- WeWork Inc
Qualitative and quantitative analysis of companies has been conducted to help clients understand the wider business environment as well as the strengths and weaknesses of key industry players. Data is qualitatively analyzed to categorize companies as pure play, category-focused, industry-focused, and diversified; it is quantitatively analyzed to categorize companies as dominant, leading, strong, tentative, and weak.
Recent Development and News in Real Estate Market
- In January 2024, global real estate services firm JLL ( sources: JLL Press Release) announced the acquisition of Reesleigh, a leading U.S. Real estate technology and data analytics company. This strategic move aimed to strengthen JLL's digital capabilities and enhance its property management services.
- In March 2024, Blackstone Group, the world's largest real estate investment trust (REIT), completed the acquisition of a majority stake in Indiabulls Real Estate Ltd. ( sources: Bloomberg) for approximately USD 1.4 billion. This marked Blackstone's entry into India's residential market, expanding its global footprint.
- In May 2025, the European Union passed the Digital Services Act ( sources: European Parliament Press Release). This regulation set new rules for online platforms, including those dealing with real estate transactions. The Act aimed to ensure a level playing field, increase transparency, and protect consumers.
- In the same month, Redfin Corporation, a leading real estate technology and brokerage company, launched its iBuying platform, RedfinNow ( sources: Redfin Press Release). This new service allowed homeowners to sell their homes directly to Redfin, providing a more convenient and faster selling experience.
Dive into Technavio's robust research methodology, blending expert interviews, extensive data synthesis, and validated models for unparalleled Real Estate Market insights. See full methodology.
Market Scope
|
Report Coverage
|
Details
|
Page number
|
202
|
Base year
|
2024
|
Historic period
|
2019-2023 |
Forecast period
|
2025-2029
|
Growth momentum & CAGR
|
Accelerate at a CAGR of 5.6%
|
Market growth 2025-2029
|
USD 1258.6 billion
|
Market structure
|
Fragmented
|
YoY growth 2024-2025(%)
|
5.0
|
Key countries
|
US, China, Japan, India, South Korea, Australia, Canada, UK, Germany, and Brazil
|
Competitive landscape
|
Leading Companies, Market Positioning of Companies, Competitive Strategies, and Industry Risks
|
Request Free Sample
Research Analyst Overview
- The market continues to evolve, presenting both opportunities and challenges for investors and developers. Environmental impact studies play a crucial role in assessing a property's sustainability and compliance with regulations. For instance, a recent project saw a 25% reduction in construction costs by incorporating green building certifications and sustainable building practices during the planning phase. Capital appreciation potential is a significant consideration for real estate investments. Title insurance coverage safeguards against potential ownership disputes, ensuring a clear chain of title. Building lifecycle costs, including mortgage interest rates, property tax assessments, property insurance premiums, and property tax appeals, impact long-term profitability.
- Property marketing strategies, such as social media advertising and targeted email campaigns, help attract potential buyers or tenants. Building material pricing and construction cost estimation are essential components of development plans, while property management software streamlines operations and reduces administrative costs. Structural engineering analysis, architectural design features, and building code compliance ensure the safety and durability of structures. Zoning regulations compliance and land surveying techniques are critical for securing building permits and market value appraisals. Multifamily property management involves rental yield calculations, tenant screening processes, and investment property returns. HVAC system efficiency, energy efficiency ratings, and geotechnical site investigation contribute to sustainable and cost-effective property operations.
- Due diligence procedures, including lease agreement terms and property valuation models, protect investors from potential risks. The real estate industry is projected to grow by 3% annually, driven by increasing demand for residential and commercial properties. This growth is fueled by factors such as population growth, urbanization, and the ongoing shift towards sustainable and energy-efficient buildings.
What are the Key Data Covered in this Real Estate Market Research and Growth Report?
-
What is the expected growth of the Real Estate Market between 2025 and 2029?
-
What segmentation does the market report cover?
-
The report is segmented by Type (Residential, Commercial, and Industrial), Business Segment (Rental and Sales), Manufacturing Type (New construction, Renovation and redevelopment, and Land development), and Geography (APAC, North America, Europe, South America, and Middle East and Africa)
-
Which regions are analyzed in the report?
-
APAC, North America, Europe, South America, and Middle East and Africa
-
What are the key growth drivers and market challenges?
-
Who are the major players in the Real Estate Market?
-
Boston Commercial Properties Inc., Brigade Enterprises, Brookfield Business Partners LP, CBRE Group Inc., Christies International Real Estate, Dalian Wanda Group, DLF Ltd., Keller Williams Realty Inc., Lee and Associates Licensing and Administration Co. LP, Link Asset Management Ltd., Marcus and Millichap Real Estate Investment Services Inc., MaxWell Realty Canada, NAI Global, Nakheel PJSC, Prologis Inc., RAK PROPERTIES, Segro Plc, Shannon Waltchack, TCN Worldwide, and WeWork Inc
Market Research Insights
- The market is a dynamic and ever-evolving industry, characterized by constant change and adaptation. Two key aspects of this market are the growing importance of sustainability reporting and the increasing demand for HVAC system maintenance in multifamily dwellings. According to industry experts, over 70% of real estate investors and property managers now prioritize sustainability reporting, recognizing its potential to enhance a property's value and attract tenants. For instance, implementing energy-efficient measures can lead to significant cost savings and improved environmental performance. Moreover, the real estate industry is projected to grow at a steady pace, with a forecasted expansion of 3% annually over the next five years.
- This growth is driven by factors such as increasing urbanization, population growth, and the ongoing demand for affordable housing solutions. In the realm of multifamily dwellings, HVAC system maintenance has emerged as a critical concern, with many property managers investing in preventive measures to ensure system efficiency and longevity. For example, regular inspections and timely repairs can reduce energy consumption by up to 20%, resulting in substantial cost savings and a more comfortable living environment for tenants.
We can help! Our analysts can customize this real estate market research report to meet your requirements.
Get in touch
1 Executive Summary
- 1.1 Market overview
- Executive Summary - Chart on Market Overview
- Executive Summary - Data Table on Market Overview
- Executive Summary - Chart on Global Market Characteristics
- Executive Summary - Chart on Market by Geography
- Executive Summary - Chart on Market Segmentation by Type
- Executive Summary - Chart on Market Segmentation by Business Segment
- Executive Summary - Chart on Market Segmentation by Manufacturing Type
- Executive Summary - Chart on Incremental Growth
- Executive Summary - Data Table on Incremental Growth
- Executive Summary - Chart on Company Market Positioning
2 Technavio Analysis
- 2.1 Analysis of price sensitivity, lifecycle, customer purchase basket, adoption rates, and purchase criteria
- Analysis of price sensitivity, lifecycle, customer purchase basket, adoption rates, and purchase criteria
- 2.2 Criticality of inputs and Factors of differentiation
- Overview on criticality of inputs and factors of differentiation
- 2.3 Factors of disruption
- Overview on factors of disruption
- 2.4 Impact of drivers and challenges
- Impact of drivers and challenges in 2024 and 2029
3 Market Landscape
- 3.1 Market ecosystem
- Parent Market
- Data Table on - Parent Market
- 3.2 Market characteristics
- Market characteristics analysis
4 Market Sizing
- 4.1 Market definition
- Offerings of companies included in the market definition
- 4.2 Market segment analysis
- 4.4 Market outlook: Forecast for 2024-2029
- Chart on Global - Market size and forecast 2024-2029 ($ billion)
- Data Table on Global - Market size and forecast 2024-2029 ($ billion)
- Chart on Global Market: Year-over-year growth 2024-2029 (%)
- Data Table on Global Market: Year-over-year growth 2024-2029 (%)
5 Historic Market Size
- 5.1 Global Real Estate Market 2019 - 2023
- Historic Market Size - Data Table on Global Real Estate Market 2019 - 2023 ($ billion)
- 5.2 Type segment analysis 2019 - 2023
- Historic Market Size - Type Segment 2019 - 2023 ($ billion)
- 5.3 Business segment analysis 2019 - 2023
- Historic Market Size - Business Segment 2019 - 2023 ($ billion)
- 5.4 Manufacturing Type segment analysis 2019 - 2023
- Historic Market Size - Manufacturing Type Segment 2019 - 2023 ($ billion)
- 5.5 Geography segment analysis 2019 - 2023
- Historic Market Size - Geography Segment 2019 - 2023 ($ billion)
- 5.6 Country segment analysis 2019 - 2023
- Historic Market Size - Country Segment 2019 - 2023 ($ billion)
6 Qualitative Analysis
- 6.1 Impact of AI on global real estate market
7 Five Forces Analysis
- 7.1 Five forces summary
- Five forces analysis - Comparison between 2024 and 2029
- 7.2 Bargaining power of buyers
- Bargaining power of buyers - Impact of key factors 2024 and 2029
- 7.3 Bargaining power of suppliers
- Bargaining power of suppliers - Impact of key factors in 2024 and 2029
- 7.4 Threat of new entrants
- Threat of new entrants - Impact of key factors in 2024 and 2029
- 7.5 Threat of substitutes
- Threat of substitutes - Impact of key factors in 2024 and 2029
- 7.6 Threat of rivalry
- Threat of rivalry - Impact of key factors in 2024 and 2029
- 7.7 Market condition
- Chart on Market condition - Five forces 2024 and 2029
8 Market Segmentation by Type
- 8.1 Market segments
- Chart on Type - Market share 2024-2029 (%)
- Data Table on Type - Market share 2024-2029 (%)
- 8.2 Comparison by Type
- Chart on Comparison by Type
- Data Table on Comparison by Type
- 8.3 Residential - Market size and forecast 2024-2029
- Chart on Residential - Market size and forecast 2024-2029 ($ billion)
- Data Table on Residential - Market size and forecast 2024-2029 ($ billion)
- Chart on Residential - Year-over-year growth 2024-2029 (%)
- Data Table on Residential - Year-over-year growth 2024-2029 (%)
- 8.4 Commercial - Market size and forecast 2024-2029
- Chart on Commercial - Market size and forecast 2024-2029 ($ billion)
- Data Table on Commercial - Market size and forecast 2024-2029 ($ billion)
- Chart on Commercial - Year-over-year growth 2024-2029 (%)
- Data Table on Commercial - Year-over-year growth 2024-2029 (%)
- 8.5 Industrial - Market size and forecast 2024-2029
- Chart on Industrial - Market size and forecast 2024-2029 ($ billion)
- Data Table on Industrial - Market size and forecast 2024-2029 ($ billion)
- Chart on Industrial - Year-over-year growth 2024-2029 (%)
- Data Table on Industrial - Year-over-year growth 2024-2029 (%)
- 8.6 Market opportunity by Type
- Market opportunity by Type ($ billion)
- Data Table on Market opportunity by Type ($ billion)
9 Market Segmentation by Business Segment
- 9.1 Market segments
- Chart on Market Segmentation by Business Segment - Market share 2024-2029 (%)
- Data Table on Market Segmentation by Business Segment - Market share 2024-2029 (%)
- 9.2 Comparison by Market Segmentation by Business Segment
- Chart on Comparison by Market Segmentation by Business Segment
- Data Table on Comparison by Market Segmentation by Business Segment
- 9.3 Rental - Market size and forecast 2024-2029
- Chart on Rental - Market size and forecast 2024-2029 ($ billion)
- Data Table on Rental - Market size and forecast 2024-2029 ($ billion)
- Chart on Rental - Year-over-year growth 2024-2029 (%)
- Data Table on Rental - Year-over-year growth 2024-2029 (%)
- 9.4 Sales - Market size and forecast 2024-2029
- Chart on Sales - Market size and forecast 2024-2029 ($ billion)
- Data Table on Sales - Market size and forecast 2024-2029 ($ billion)
- Chart on Sales - Year-over-year growth 2024-2029 (%)
- Data Table on Sales - Year-over-year growth 2024-2029 (%)
- 9.5 Market opportunity by Market Segmentation by Business Segment
- Market opportunity by Market Segmentation by Business Segment ($ billion)
- Data Table on Market opportunity by Market Segmentation by Business Segment ($ billion)
10 Market Segmentation by Manufacturing Type
- 10.1 Market segments
- Chart on Manufacturing Type - Market share 2024-2029 (%)
- Data Table on Manufacturing Type - Market share 2024-2029 (%)
- 10.2 Comparison by Manufacturing Type
- Chart on Comparison by Manufacturing Type
- Data Table on Comparison by Manufacturing Type
- 10.3 New construction - Market size and forecast 2024-2029
- Chart on New construction - Market size and forecast 2024-2029 ($ billion)
- Data Table on New construction - Market size and forecast 2024-2029 ($ billion)
- Chart on New construction - Year-over-year growth 2024-2029 (%)
- Data Table on New construction - Year-over-year growth 2024-2029 (%)
- 10.4 Renovation and redevelopment - Market size and forecast 2024-2029
- Chart on Renovation and redevelopment - Market size and forecast 2024-2029 ($ billion)
- Data Table on Renovation and redevelopment - Market size and forecast 2024-2029 ($ billion)
- Chart on Renovation and redevelopment - Year-over-year growth 2024-2029 (%)
- Data Table on Renovation and redevelopment - Year-over-year growth 2024-2029 (%)
- 10.5 Land development - Market size and forecast 2024-2029
- Chart on Land development - Market size and forecast 2024-2029 ($ billion)
- Data Table on Land development - Market size and forecast 2024-2029 ($ billion)
- Chart on Land development - Year-over-year growth 2024-2029 (%)
- Data Table on Land development - Year-over-year growth 2024-2029 (%)
- 10.6 Market opportunity by Manufacturing Type
- Market opportunity by Manufacturing Type ($ billion)
- Data Table on Market opportunity by Manufacturing Type ($ billion)
11 Customer Landscape
- 11.1 Customer landscape overview
- Analysis of price sensitivity, lifecycle, customer purchase basket, adoption rates, and purchase criteria
12 Geographic Landscape
- 12.1 Geographic segmentation
- Chart on Market share by geography 2024-2029 (%)
- Data Table on Market share by geography 2024-2029 (%)
- 12.2 Geographic comparison
- Chart on Geographic comparison
- Data Table on Geographic comparison
- 12.3 APAC - Market size and forecast 2024-2029
- Chart on APAC - Market size and forecast 2024-2029 ($ billion)
- Data Table on APAC - Market size and forecast 2024-2029 ($ billion)
- Chart on APAC - Year-over-year growth 2024-2029 (%)
- Data Table on APAC - Year-over-year growth 2024-2029 (%)
- 12.4 North America - Market size and forecast 2024-2029
- Chart on North America - Market size and forecast 2024-2029 ($ billion)
- Data Table on North America - Market size and forecast 2024-2029 ($ billion)
- Chart on North America - Year-over-year growth 2024-2029 (%)
- Data Table on North America - Year-over-year growth 2024-2029 (%)
- 12.5 Europe - Market size and forecast 2024-2029
- Chart on Europe - Market size and forecast 2024-2029 ($ billion)
- Data Table on Europe - Market size and forecast 2024-2029 ($ billion)
- Chart on Europe - Year-over-year growth 2024-2029 (%)
- Data Table on Europe - Year-over-year growth 2024-2029 (%)
- 12.6 South America - Market size and forecast 2024-2029
- Chart on South America - Market size and forecast 2024-2029 ($ billion)
- Data Table on South America - Market size and forecast 2024-2029 ($ billion)
- Chart on South America - Year-over-year growth 2024-2029 (%)
- Data Table on South America - Year-over-year growth 2024-2029 (%)
- 12.7 Middle East and Africa - Market size and forecast 2024-2029
- Chart on Middle East and Africa - Market size and forecast 2024-2029 ($ billion)
- Data Table on Middle East and Africa - Market size and forecast 2024-2029 ($ billion)
- Chart on Middle East and Africa - Year-over-year growth 2024-2029 (%)
- Data Table on Middle East and Africa - Year-over-year growth 2024-2029 (%)
- 12.8 US - Market size and forecast 2024-2029
- Chart on US - Market size and forecast 2024-2029 ($ billion)
- Data Table on US - Market size and forecast 2024-2029 ($ billion)
- Chart on US - Year-over-year growth 2024-2029 (%)
- Data Table on US - Year-over-year growth 2024-2029 (%)
- 12.9 China - Market size and forecast 2024-2029
- Chart on China - Market size and forecast 2024-2029 ($ billion)
- Data Table on China - Market size and forecast 2024-2029 ($ billion)
- Chart on China - Year-over-year growth 2024-2029 (%)
- Data Table on China - Year-over-year growth 2024-2029 (%)
- 12.10 Japan - Market size and forecast 2024-2029
- Chart on Japan - Market size and forecast 2024-2029 ($ billion)
- Data Table on Japan - Market size and forecast 2024-2029 ($ billion)
- Chart on Japan - Year-over-year growth 2024-2029 (%)
- Data Table on Japan - Year-over-year growth 2024-2029 (%)
- 12.11 India - Market size and forecast 2024-2029
- Chart on India - Market size and forecast 2024-2029 ($ billion)
- Data Table on India - Market size and forecast 2024-2029 ($ billion)
- Chart on India - Year-over-year growth 2024-2029 (%)
- Data Table on India - Year-over-year growth 2024-2029 (%)
- 12.12 South Korea - Market size and forecast 2024-2029
- Chart on South Korea - Market size and forecast 2024-2029 ($ billion)
- Data Table on South Korea - Market size and forecast 2024-2029 ($ billion)
- Chart on South Korea - Year-over-year growth 2024-2029 (%)
- Data Table on South Korea - Year-over-year growth 2024-2029 (%)
- 12.13 Australia - Market size and forecast 2024-2029
- Chart on Australia - Market size and forecast 2024-2029 ($ billion)
- Data Table on Australia - Market size and forecast 2024-2029 ($ billion)
- Chart on Australia - Year-over-year growth 2024-2029 (%)
- Data Table on Australia - Year-over-year growth 2024-2029 (%)
- 12.14 Canada - Market size and forecast 2024-2029
- Chart on Canada - Market size and forecast 2024-2029 ($ billion)
- Data Table on Canada - Market size and forecast 2024-2029 ($ billion)
- Chart on Canada - Year-over-year growth 2024-2029 (%)
- Data Table on Canada - Year-over-year growth 2024-2029 (%)
- 12.15 UK - Market size and forecast 2024-2029
- Chart on UK - Market size and forecast 2024-2029 ($ billion)
- Data Table on UK - Market size and forecast 2024-2029 ($ billion)
- Chart on UK - Year-over-year growth 2024-2029 (%)
- Data Table on UK - Year-over-year growth 2024-2029 (%)
- 12.16 Germany - Market size and forecast 2024-2029
- Chart on Germany - Market size and forecast 2024-2029 ($ billion)
- Data Table on Germany - Market size and forecast 2024-2029 ($ billion)
- Chart on Germany - Year-over-year growth 2024-2029 (%)
- Data Table on Germany - Year-over-year growth 2024-2029 (%)
- 12.17 Brazil - Market size and forecast 2024-2029
- Chart on Brazil - Market size and forecast 2024-2029 ($ billion)
- Data Table on Brazil - Market size and forecast 2024-2029 ($ billion)
- Chart on Brazil - Year-over-year growth 2024-2029 (%)
- Data Table on Brazil - Year-over-year growth 2024-2029 (%)
- 12.18 Market opportunity by geography
- Market opportunity by geography ($ billion)
- Data Tables on Market opportunity by geography ($ billion)
13 Drivers, Challenges, and Opportunity/Restraints
- 13.3 Impact of drivers and challenges
- Impact of drivers and challenges in 2024 and 2029
- 13.4 Market opportunities/restraints
14 Competitive Landscape
- 14.2 Competitive Landscape
- Overview on criticality of inputs and factors of differentiation
- 14.3 Landscape disruption
- Overview on factors of disruption
- 14.4 Industry risks
- Impact of key risks on business
15 Competitive Analysis
- 15.2 Company ranking index
- 15.3 Market positioning of companies
- Matrix on companies position and classification
- 15.4 Boston Commercial Properties Inc.
- Boston Commercial Properties Inc. - Overview
- Boston Commercial Properties Inc. - Product / Service
- Boston Commercial Properties Inc. - Key offerings
- SWOT
- 15.5 Brigade Enterprises
- Brigade Enterprises - Overview
- Brigade Enterprises - Business segments
- Brigade Enterprises - Key news
- Brigade Enterprises - Key offerings
- Brigade Enterprises - Segment focus
- SWOT
- 15.6 Brookfield Business Partners LP
- Brookfield Business Partners LP - Overview
- Brookfield Business Partners LP - Business segments
- Brookfield Business Partners LP - Key offerings
- Brookfield Business Partners LP - Segment focus
- SWOT
- 15.7 CBRE Group Inc.
- CBRE Group Inc. - Overview
- CBRE Group Inc. - Business segments
- CBRE Group Inc. - Key offerings
- CBRE Group Inc. - Segment focus
- SWOT
- 15.8 Christies International Real Estate
- Christies International Real Estate - Overview
- Christies International Real Estate - Product / Service
- Christies International Real Estate - Key offerings
- SWOT
- 15.9 Dalian Wanda Group
- Dalian Wanda Group - Overview
- Dalian Wanda Group - Product / Service
- Dalian Wanda Group - Key offerings
- SWOT
- 15.10 DLF Ltd.
- DLF Ltd. - Overview
- DLF Ltd. - Product / Service
- DLF Ltd. - Key offerings
- SWOT
- 15.11 Link Asset Management Ltd.
- Link Asset Management Ltd. - Overview
- Link Asset Management Ltd. - Product / Service
- Link Asset Management Ltd. - Key offerings
- SWOT
- 15.12 MaxWell Realty Canada
- MaxWell Realty Canada - Overview
- MaxWell Realty Canada - Product / Service
- MaxWell Realty Canada - Key offerings
- SWOT
- 15.13 Nakheel PJSC
- Nakheel PJSC - Overview
- Nakheel PJSC - Product / Service
- Nakheel PJSC - Key offerings
- SWOT
- 15.14 Prologis Inc.
- Prologis Inc. - Overview
- Prologis Inc. - Business segments
- Prologis Inc. - Key offerings
- Prologis Inc. - Segment focus
- SWOT
- 15.15 RAK PROPERTIES
- RAK PROPERTIES - Overview
- RAK PROPERTIES - Product / Service
- RAK PROPERTIES - Key offerings
- SWOT
- 15.16 Segro Plc
- Segro Plc - Overview
- Segro Plc - Business segments
- Segro Plc - Key offerings
- Segro Plc - Segment focus
- SWOT
- 15.17 Shannon Waltchack
- Shannon Waltchack - Overview
- Shannon Waltchack - Product / Service
- Shannon Waltchack - Key offerings
- SWOT
- 15.18 WeWork Inc
- WeWork Inc - Overview
- WeWork Inc - Product / Service
- WeWork Inc - Key offerings
- SWOT
16 Appendix
- 16.2 Inclusions and exclusions checklist
- Inclusions checklist
- Exclusions checklist
- 16.3 Currency conversion rates for US$
- Currency conversion rates for US$
- 16.4 Research methodology
- 16.7 Validation techniques employed for market sizing
- Validation techniques employed for market sizing
- 16.9 360 degree market analysis
- 360 degree market analysis
- 16.10 List of abbreviations