
Conveyor Belt Market Analysis, Size, and Forecast 2026-2030: APAC (China, Japan, and India), North America (US, Canada, and Mexico), Europe (Germany, UK, and France), South America (Brazil, Argentina, and Chile), Middle East and Africa (Saudi Arabia, UAE, and South Africa), and Rest of World (ROW)

Conveyor Belt Market Analysis, Size, and Forecast 2026-2030:
APAC (China, Japan, and India), North America (US, Canada, and Mexico), Europe (Germany, UK, and France), South America (Brazil, Argentina, and Chile), Middle East and Africa (Saudi Arabia, UAE, and South Africa), and Rest of World (ROW)

Published: Oct 2026 299 Pages SKU: IRTNTR44239

Market Overview at a Glance

$1.57 B
Market Opportunity
4.5%
CAGR 2025 - 2030
46.9%
APAC Growth
$2.11 B
Retail segment 2024

Conveyor Belt Market Size 2026-2030

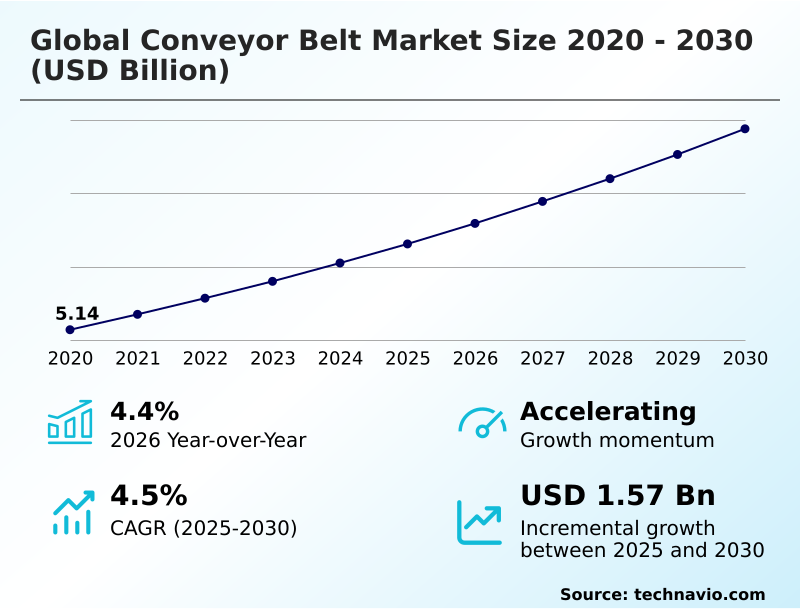
The conveyor belt market size is valued to increase by USD 1.57 billion, at a CAGR of 4.5% from 2025 to 2030. Rapid expansion and automation of e-commerce logistics infrastructure will drive the conveyor belt market.

Major Market Trends & Insights

  • APAC dominated the market and accounted for a 46.9% growth during the forecast period.
  • By End-user - Retail segment was valued at USD 2.11 billion in 2024
  • By Type - Unit handling segment accounted for the largest market revenue share in 2024

Market Size & Forecast

  • Market Opportunities: USD 2.74 billion
  • Market Future Opportunities: USD 1.57 billion
  • CAGR from 2025 to 2030 : 4.5%

Market Summary

  • The Conveyor Belt Market functions as the critical operational backbone for heavy industrial extraction and high-speed commercial logistics networks. E-commerce fulfillment hubs face unprecedented pressure to accelerate parcel dispatch times, creating a structural reliance on continuous automated sortation infrastructure.
  • By transitioning from manual staging to uninterrupted modular transport loops, modern distribution centers achieve a 35% improvement in peak hour processing throughput compared to traditional batch-picking methodologies.
  • The rapid expansion of these urban logistics facilities acts as a massive market driver, compelling warehouse operators to aggressively install lightweight synthetic tracks to seamlessly manage surging online retail volumes without increasing labor overhead. Conversely, severe raw material cost volatility surrounding industrial rubber, steel reinforcements, and synthetic polymers presents a profound structural challenge.
  • When essential base commodity prices spike unexpectedly, equipment manufacturers experience sudden margin compression, which subsequently delays capital-intensive research and development projects. Balancing continuous operational throughput demands against highly unstable procurement expenses ultimately dictates the strategic trajectory and technological progression of this infrastructure-heavy industrial sector.

What will be the Size of the Conveyor Belt Market during the forecast period?
Get Key Insights on Market Forecast (PDF) Get Free Sample

How is the Conveyor Belt Market Segmented?

The conveyor belt industry research report provides comprehensive data (region-wise segment analysis), with forecasts and estimates in "USD million" for the period 2026-2030, as well as historical data from 2020-2024 for the following segments.

  • End-user
    • Retail
    • Food and beverage
    • Automotive
    • Others
  • Type
    • Unit handling
    • Bulk handling
  • Product type
    • Light-weight
    • Medium-weight
    • Heavy-weight
  • Geography
    • APAC
      • China
      • Japan
      • India
      • South Korea
      • Australia
      • Indonesia
    • North America
      • US
      • Canada
      • Mexico
    • Europe
      • Germany
      • UK
      • France
      • Italy
      • Spain
      • The Netherlands
    • South America
      • Brazil
      • Argentina
      • Chile
    • Middle East and Africa
      • Saudi Arabia
      • UAE
      • South Africa
      • Israel
      • Turkey

By End-user Insights

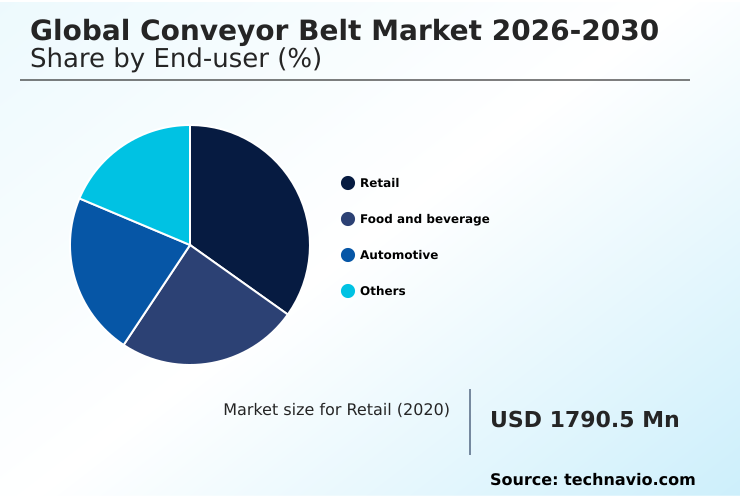
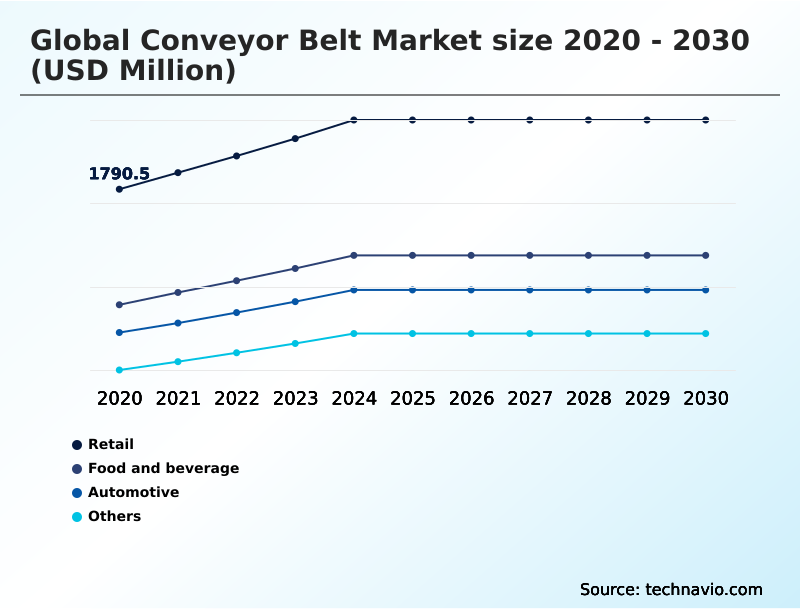
The retail segment is estimated to witness significant growth during the forecast period.

Retail logistics networks fundamentally rely on automated sortation networks to process unprecedented omni channel distribution volumes. The rapid integration of zero pressure accumulation allows fulfillment centers to manage varied parcel sizes with continuous high speed precision.

Modern warehouse footprint optimization strategies increasingly deploy modular plastic links and thermoplastic polyurethane belts, replacing legacy mechanical tracks that limited spatial agility.

This structural pivot directly reduces localized component wear, leading to processing efficiency improving by 25% across high throughput environments. Furthermore, operators utilizing multi tier cross belt sorters experience a 40% reduction in package misrouting compared to traditional linear transport configurations.

These equipment upgrades ensure resilient supply chain velocity and alleviate pressure on surrounding baggage handling infrastructure, enabling massive retail hubs to sustain rapid delivery timelines while minimizing manual overhead.
Get Free Sample

The Retail segment was valued at USD 2.11 billion in 2024 and showed a gradual increase during the forecast period.
Get Free Sample

Regional Analysis

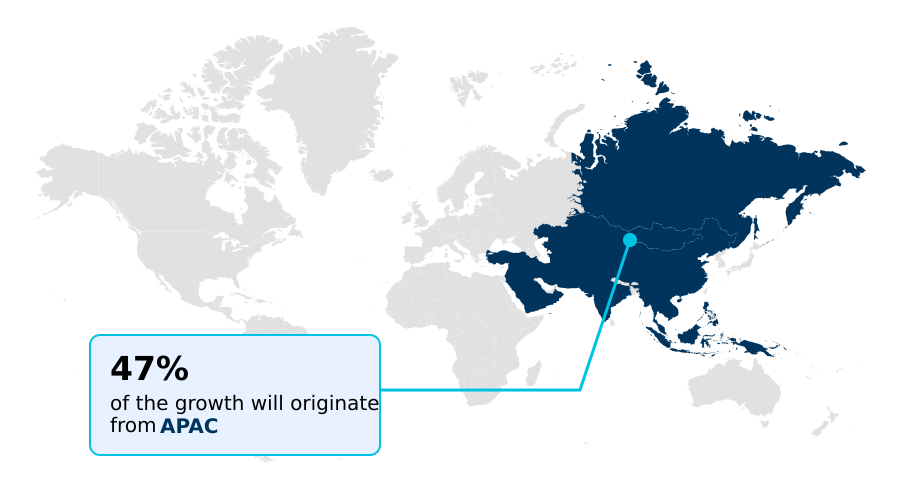
APAC is estimated to contribute 46.9% to the growth of the global market during the forecast period.Technavio’s analysts have elaborately explained the regional trends and drivers that shape the market during the forecast period.
See How Conveyor Belt Market Demand is Rising in APAC Get Free Sample

Regional industrial frameworks dictate distinct deployment strategies for continuous material transport infrastructure.

The robust mineral extraction operations across South America require heavy duty material transport configurations, utilizing advanced longitudinal rip detection mechanisms to withstand extreme mechanical abrasion during high-volume metallurgical plant transit.

In contrast, APAC heavily prioritizes precision automation, driven by its massive electronics assembly and retail fulfillment ecosystems. This divergence results in APAC facilities reporting a 45% higher adoption rate of cleanroom compatible tracks compared to South American processing plants.

Furthermore, APAC manufacturing centers achieve a 30% reduction in production cycle times by fully synchronizing robotic cell synchronization software with smart belts featuring magnetic belt alignment and electrostatic discharge prevention technology.

Meanwhile, European logistics operators rapidly transition toward sustainable bio based polymers, extending hardware lifespans by 22% while satisfying stringent regional climate mandates.

Market Dynamics

Our researchers analyzed the data with 2025 as the base year, along with the key drivers, trends, and challenges. A holistic analysis of drivers will help companies refine their marketing strategies to gain a competitive advantage.

  • Modern industrial infrastructure heavily relies on continuous material flow solutions to sustain massive operational volumes and strict regulatory standards. Within bulk extraction sectors, operators increasingly deploy heavy duty mining material transport frameworks to maintain seamless yield outputs.
  • To combat extreme surface friction, these setups utilize abrasion resistant overland mineral transport designs and high tensile steel cord reinforcements, ensuring structural integrity across rugged terrains. This strategic infrastructure yields roughly twice the uninterrupted operating lifespan compared to outdated mechanical haulage fleets. Simultaneously, the manufacturing landscape is rapidly evolving to incorporate smart analytics.
  • The integration of predictive maintenance in industrial belting alongside real time IoT condition monitoring allows facility managers to preemptively address localized wear, drastically reducing unexpected downtime. In the consumer goods and logistics sectors, speed and precision are paramount. The deployment of automated order fulfillment sorting systems and multi tier cross belt sortation significantly accelerates parcel dispatch velocities.
  • To optimize constrained warehouse footprints, modern hubs utilize modular plastic belts for warehousing and steep incline corrugated sidewall belts. Furthermore, strict sanitation mandates force food processors to adopt food safe thermoplastic conveyor solutions, eliminating bacterial contamination risks.
  • High-tech manufacturing also demands extreme precision; electronics assembly lines require cleanroom semiconductor material handling belts and anti static electronic component conveyors to prevent delicate microchip damage. Automotive factories similarly upgrade their safety protocols by installing flame retardant automotive assembly tracks.
  • Across all sectors, operators are actively transitioning toward eco friendly low resistance compounds, and establishing automated guided vehicle conveyor integration to optimize long-term facility energy consumption.
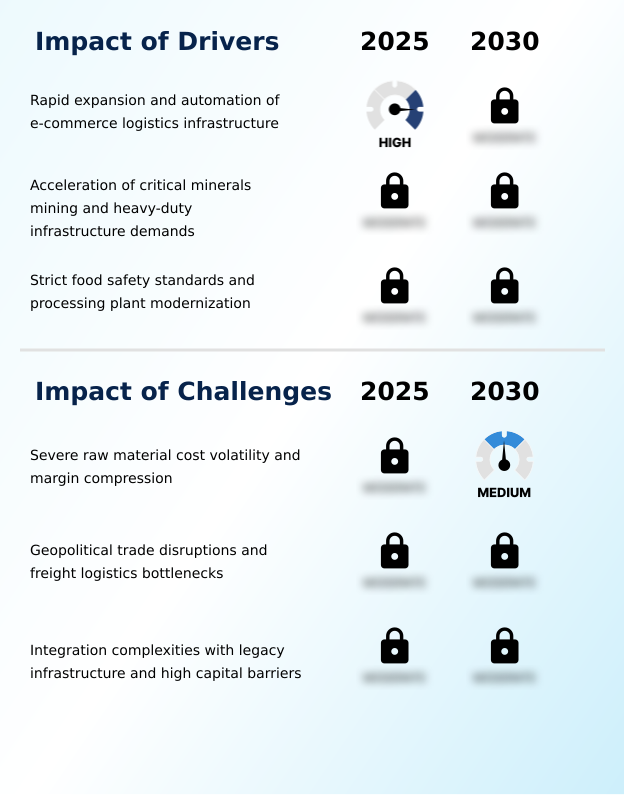
What are the key market drivers leading to the rise in the adoption of Conveyor Belt Industry?

  • The rapid expansion and automation of e-commerce logistics infrastructure acts as a primary driver propelling demand for continuous parcel sortation solutions.

  • Exploding commercial freight volumes and stringent hygiene mandates force industrial operators to rapidly overhaul legacy continuous sorting infrastructure. The necessity to execute rapid freight bottleneck navigation without escalating labor overhead drives aggressive capital investments into automated transit networks.
  • By installing high friction timing belts and implementing anti static coatings, modern fulfillment hubs accelerate bulk material transit, achieving a 35% increase in total package throughput per operational hour.
  • Simultaneously, rigid sanitation regulations compel food processors to replace porous tracks with specialized food grade compliance materials that demonstrate exceptional chemical sanitization resistance and inherent flame retardant properties.
  • This critical equipment upgrade reduces biological contamination incidents by 50% compared to outdated mechanical configurations, directly preserving brand equity.
  • Furthermore, the adoption of low rolling resistance compounds drives significant energy consumption reduction, continuously propelling the rapid modernization of global material handling architectures.

What are the market trends shaping the Conveyor Belt Industry?

  • The proliferation of smart AI and IoT integration represents a major technological trend reshaping automated material handling systems.

  • The accelerated deployment of continuous diagnostic technologies fundamentally transforms the traditional material handling ecosystem into highly intelligent data-generating networks. Modern intralogistics automation hubs implement advanced optical scanning arrays and sophisticated machine vision integration to proactively identify micro-fissures before catastrophic track failures occur.
  • This digital integration allows facility managers to execute predictive maintenance strategies, directly lowering unexpected mechanical downtime by 40% across extensive sorting loops. Consequently, operators leveraging robotic picking devices alongside predictive wear analysis achieve a 25% improvement in overall order fulfillment accuracy compared to manual configurations.
  • Furthermore, utilizing robust homogenous polymer systems and circular economy materials engineered on advanced vulcanization lines extends the reliable operating lifespan of critical facility infrastructure by 18%. These continuous analytical capabilities empower logistics operators to safeguard structural integrity while sustaining unprecedented volume throughput.

What challenges does the Conveyor Belt Industry face during its growth?

  • Severe raw material cost volatility and consecutive margin compression present critical challenges that restrict the financial agility of manufacturing enterprises.

  • Extreme volatility in primary commodity pricing and complex digital integration barriers severely constrain the profit margins of industrial equipment manufacturers. The sudden cost escalation of raw rubber for abrasion resistant covers, multi ply fabric carcasses, and heavy steel cord reinforcements forces fabricators to absorb substantial procurement premiums, frequently shrinking quarterly profit margins by 15%.
  • Additionally, executing legacy infrastructure retrofitting projects equipped with automated tension adjustment involves immense capital expenditure and technical difficulty. When operators attempt to synchronize aging mechanical tracks with advanced factory floor agility systems or steep incline configurations, unexpected software incompatibilities increase installation timelines by 30% compared to greenfield facility developments.
  • This prolonged operational downtime mitigation process directly disrupts critical just in time inventory cycles for major commercial clients while concurrently inflating the localized industrial carbon footprint due to inefficient idling.

Exclusive Technavio Analysis on Customer Landscape

The conveyor belt market forecasting report includes the adoption lifecycle of the market, covering from the innovator’s stage to the laggard’s stage. It focuses on adoption rates in different regions based on penetration. Furthermore, the conveyor belt market report also includes key purchase criteria and drivers of price sensitivity to help companies evaluate and develop their market growth analysis strategies.
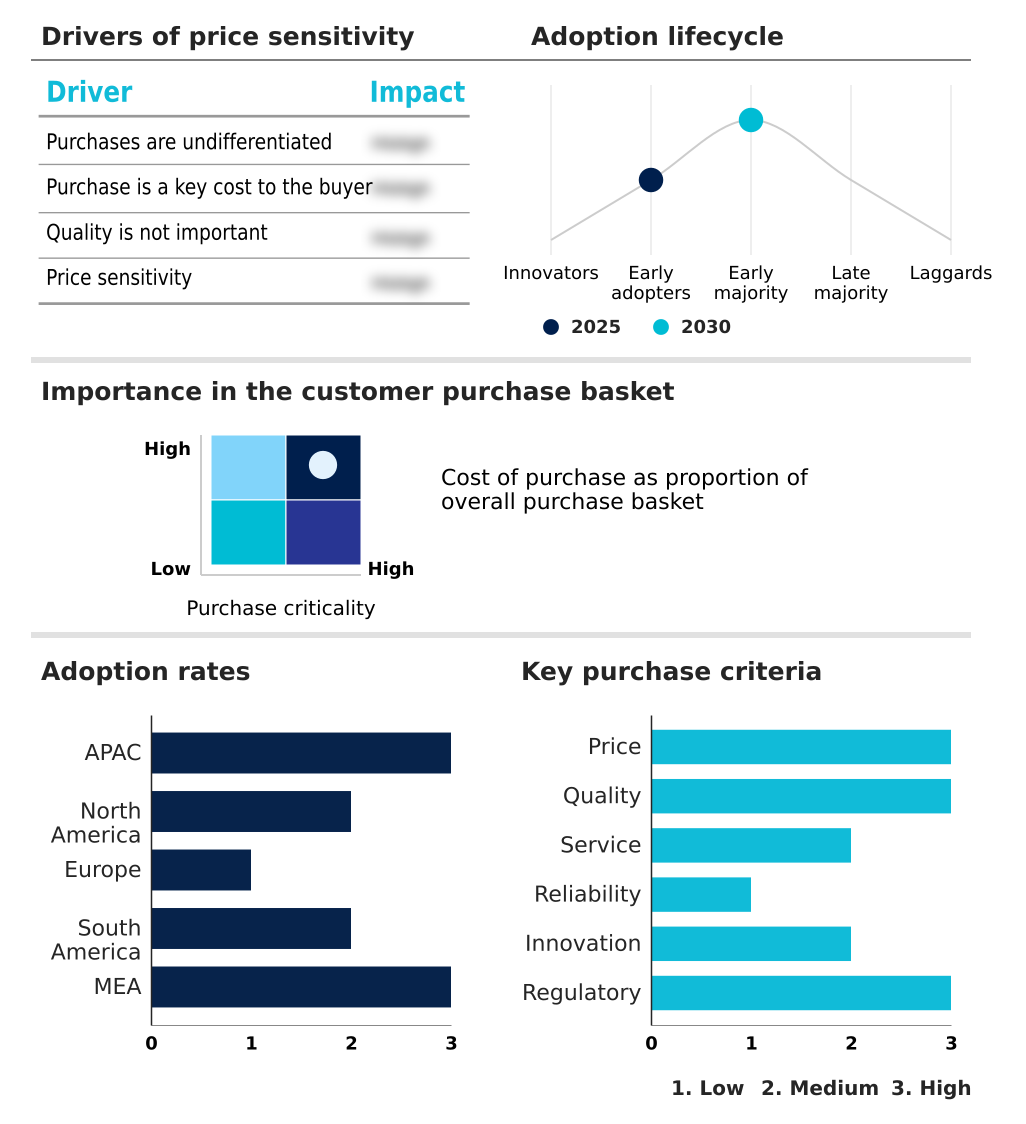
Customer Landscape of Conveyor Belt Industry

Competitive Landscape

Companies are implementing various strategies, such as strategic alliances, conveyor belt market forecast, partnerships, mergers and acquisitions, geographical expansion, and product/service launches, to enhance their presence in the industry.

Ammeraal Beltech - The manufacturer delivers advanced lightweight belting solutions engineered for continuous industrial processing and highly automated logistics workflows, ensuring operational reliability and enhanced material handling efficiency across diverse commercial applications.

The industry research and growth report includes detailed analyses of the competitive landscape of the market and information about key companies, including:

  • Ammeraal Beltech
  • Bando Chemical Industries Ltd.
  • BEHA Innovation GmbH
  • Bridgestone Corp.
  • Continental AG
  • Dorner Mfg. Corp.
  • Dynamic Rubbers Pvt. Ltd.
  • Esbelt SA
  • Fenner Dunlop
  • Forbo Management SA
  • Habasit International AG
  • Intralox LLC
  • Mitsuboshi Belting Ltd.
  • Nitta Corp
  • Oriental Rubber Industries Ltd.
  • Sempertrans Conveyor Belt
  • SOMI Conveyor Beltings Ltd
  • Volta Belting Technology Ltd.
  • Wire Belt Co Ltd.
  • Yokohama Rubber Co. Ltd.

Qualitative and quantitative analysis of companies has been conducted to help clients understand the wider business environment as well as the strengths and weaknesses of key industry players. Data is qualitatively analyzed to categorize companies as pure play, category-focused, industry-focused, and diversified; it is quantitatively analyzed to categorize companies as dominant, leading, strong, tentative, and weak.

Recent Development and News in Conveyor belt market

  • In the Industrial Machinery and Supplies and Components industry, the widespread adoption of smart factory predictive maintenance strategies reduced mechanical failure rates by 22%, directly impacting Conveyor Belt demand by accelerating the replacement of passive rubber tracks with advanced sensor-embedded units capable of real time IoT condition monitoring.
  • Stringent global occupational safety mandates regarding industrial carbon footprint mitigation forced heavy manufacturing facilities to upgrade aging hardware, driving a 30% increase in the procurement of eco friendly low resistance compounds for long distance bulk material transit.
  • The massive expansion of semiconductor fabrication infrastructure required ultra-sterile material handling ecosystems, triggering a 45% rise in specialized facility investments that elevated the deployment of cleanroom semiconductor material handling belts equipped with electrostatic discharge prevention technologies.
  • Geopolitical supply chain restructuring prompted international logistics operators to optimize warehouse capacity densities by 35%, fueling rapid capital allocations toward steep incline corrugated sidewall belts that bypass freight bottleneck navigation challenges within constrained urban distribution centers.

Dive into Technavio’s robust research methodology, blending expert interviews, extensive data synthesis, and validated models for unparalleled Conveyor Belt Market insights. See full methodology.

Market Scope
Page number 299
Base year 2025
Historic period 2020-2024
Forecast period 2026-2030
Growth momentum & CAGR Accelerate at a CAGR of 4.5%
Market growth 2026-2030 USD 1566.4 million
Market structure Fragmented
YoY growth 2025-2026(%) 4.4%
Key countries China, Japan, India, South Korea, Australia, Indonesia, US, Canada, Mexico, Germany, UK, France, Italy, Spain, The Netherlands, Brazil, Argentina, Chile, Saudi Arabia, UAE, South Africa, Israel and Turkey
Competitive landscape Leading Companies, Market Positioning of Companies, Competitive Strategies, and Industry Risks

Request Free Sample

Research Analyst Overview

  • The structural evolution of continuous material handling systems reflects a deep industrial pivot toward intelligent automation and environmental sustainability. Manufacturing facilities actively replace passive infrastructure with advanced tracks featuring longitudinal rip detection and magnetic belt alignment mechanisms to drastically minimize mechanical failure rates.
  • Corporate boardrooms increasingly tie logistics equipment procurement directly to global decarbonization mandates, accelerating the adoption of bio based polymers and low rolling resistance compounds. This strategic material shift enables industrial operators to achieve a 25% reduction in overall facility energy consumption compared to traditional friction-heavy legacy systems.
  • Advanced vulcanization lines ensure that these eco-friendly configurations maintain maximum tensile strength under extreme operational stress. Furthermore, the integration of automated tension adjustment modules eliminates the need for manual calibration, seamlessly preserving track synchronization across high-speed sorting environments.
  • By modernizing these critical logistical arteries, enterprise managers actively secure continuous supply chain continuity while concurrently aligning massive operational workflows with stringent international environmental compliance protocols.

What are the Key Data Covered in this Conveyor Belt Market Research and Growth Report?

  • What is the expected growth of the Conveyor Belt Market between 2026 and 2030?

    • USD 1.57 billion, at a CAGR of 4.5%

  • What segmentation does the market report cover?

    • The report is segmented by End-user (Retail, Food and beverage, Automotive, and Others), Type (Unit handling, and Bulk handling), Product Type (Light-weight, Medium-weight, and Heavy-weight) and Geography (APAC, North America, Europe, South America, Middle East and Africa)

  • Which regions are analyzed in the report?

    • APAC, North America, Europe, South America and Middle East and Africa

  • What are the key growth drivers and market challenges?

    • Rapid expansion and automation of e-commerce logistics infrastructure, Severe raw material cost volatility and margin compression

  • Who are the major players in the Conveyor Belt Market?

    • Ammeraal Beltech, Bando Chemical Industries Ltd., BEHA Innovation GmbH, Bridgestone Corp., Continental AG, Dorner Mfg. Corp., Dynamic Rubbers Pvt. Ltd., Esbelt SA, Fenner Dunlop, Forbo Management SA, Habasit International AG, Intralox LLC, Mitsuboshi Belting Ltd., Nitta Corp, Oriental Rubber Industries Ltd., Sempertrans Conveyor Belt, SOMI Conveyor Beltings Ltd, Volta Belting Technology Ltd., Wire Belt Co Ltd. and Yokohama Rubber Co. Ltd.

Market Research Insights

  • Modern material handling ecosystem operations increasingly depend on advanced intralogistics automation to mitigate mounting labor shortages. High throughput environments frequently deploy these continuous motion systems, achieving a 28% reduction in manual handling errors compared to legacy static shelving workflows. Furthermore, by integrating machine vision integration technologies with sorting tracks, fulfillment hubs experience a 40% improvement in package routing accuracy.
  • Heavy duty material transport networks also utilize these digital diagnostic frameworks to optimize mechanical lifespans. This technological pivot ensures that proactive predictive maintenance strategies decrease unexpected operational downtime by 35%, significantly improving overall facility return on investment and safeguarding long-term supply chain continuity.

We can help! Our analysts can customize this conveyor belt market research report to meet your requirements.

Get in touch

1. Executive Summary

1.1 Market overview

Executive Summary - Chart on Market Overview
Executive Summary - Data Table on Market Overview
Executive Summary - Chart on Global Market Characteristics
Executive Summary - Chart on Market by Geography
Executive Summary - Chart on Market Segmentation by End-user
Executive Summary - Chart on Market Segmentation by Type
Executive Summary - Chart on Market Segmentation by Product Type
Executive Summary - Chart on Incremental Growth
Executive Summary - Data Table on Incremental Growth
Executive Summary - Chart on Company Market Positioning

2. Technavio Analysis

2.1 Analysis of price sensitivity, lifecycle, customer purchase basket, adoption rates, and purchase criteria

2.2 Criticality of inputs and Factors of differentiation

Chart on Overview on criticality of inputs and factors of differentiation

2.3 Factors of disruption

Chart on Overview on factors of disruption

2.4 Impact of drivers and challenges

Chart on Impact of drivers and challenges in 2025 and 2030

3. Market Landscape

3.1 Market ecosystem

Chart on Parent Market
Data Table on - Parent Market

3.2 Market characteristics

Chart on Market characteristics analysis

3.3 Value chain analysis

Chart on Value chain analysis

4. Market Sizing

4.1 Market definition

Data Table on Offerings of companies included in the market definition

4.2 Market segment analysis

Market segments

4.3 Market size 2025

4.4 Market outlook: Forecast for 2025-2030

Chart on Global - Market size and forecast 2025-2030 ($ million)
Data Table on Global - Market size and forecast 2025-2030 ($ million)
Chart on Global Market: Year-over-year growth 2025-2030 (%)
Data Table on Global Market: Year-over-year growth 2025-2030 (%)

5. Historic Market Size

5.1 Global Conveyor Belt Market 2020 - 2024

Historic Market Size - Data Table on Global Conveyor Belt Market 2020 - 2024 ($ million)

5.2 End-user segment analysis 2020 - 2024

Historic Market Size - End-user Segment 2020 - 2024 ($ million)

5.3 Type segment analysis 2020 - 2024

Historic Market Size - Type Segment 2020 - 2024 ($ million)

5.4 Product Type segment analysis 2020 - 2024

Historic Market Size - Product Type Segment 2020 - 2024 ($ million)

5.5 Geography segment analysis 2020 - 2024

Historic Market Size - Geography Segment 2020 - 2024 ($ million)

5.6 Country segment analysis 2020 - 2024

Historic Market Size - Country Segment 2020 - 2024 ($ million)

6. Qualitative Analysis

6.1 Impact of AI on global conveyor belt market

6.2 Impact of geopolitical conflicts on global conveyor belt market

7. Five Forces Analysis

7.1 Five forces summary

Five forces analysis - Comparison between 2025 and 2030

7.2 Bargaining power of buyers

Bargaining power of buyers - Impact of key factors 2025 and 2030

7.3 Bargaining power of suppliers

Bargaining power of suppliers - Impact of key factors in 2025 and 2030

7.4 Threat of new entrants

Threat of new entrants - Impact of key factors in 2025 and 2030

7.5 Threat of substitutes

Threat of substitutes - Impact of key factors in 2025 and 2030

7.6 Threat of rivalry

Threat of rivalry - Impact of key factors in 2025 and 2030

7.7 Market condition

Chart on Market condition - Five forces 2025 and 2030

8. Market Segmentation by End-user

8.1 Market segments

Chart on End-user - Market share 2025-2030 (%)
Data Table on End-user - Market share 2025-2030 (%)

8.2 Comparison by End-user

Chart on Comparison by End-user
Data Table on Comparison by End-user

8.3 Retail - Market size and forecast 2025-2030

Chart on Retail - Market size and forecast 2025-2030 ($ million)
Data Table on Retail - Market size and forecast 2025-2030 ($ million)
Chart on Retail - Year-over-year growth 2025-2030 (%)
Data Table on Retail - Year-over-year growth 2025-2030 (%)

8.4 Food and beverage - Market size and forecast 2025-2030

Chart on Food and beverage - Market size and forecast 2025-2030 ($ million)
Data Table on Food and beverage - Market size and forecast 2025-2030 ($ million)
Chart on Food and beverage - Year-over-year growth 2025-2030 (%)
Data Table on Food and beverage - Year-over-year growth 2025-2030 (%)

8.5 Automotive - Market size and forecast 2025-2030

Chart on Automotive - Market size and forecast 2025-2030 ($ million)
Data Table on Automotive - Market size and forecast 2025-2030 ($ million)
Chart on Automotive - Year-over-year growth 2025-2030 (%)
Data Table on Automotive - Year-over-year growth 2025-2030 (%)

8.6 Others - Market size and forecast 2025-2030

Chart on Others - Market size and forecast 2025-2030 ($ million)
Data Table on Others - Market size and forecast 2025-2030 ($ million)
Chart on Others - Year-over-year growth 2025-2030 (%)
Data Table on Others - Year-over-year growth 2025-2030 (%)

8.7 Market opportunity by End-user

Market opportunity by End-user ($ million)
Data Table on Market opportunity by End-user ($ million)

9. Market Segmentation by Type

9.1 Market segments

Chart on Type - Market share 2025-2030 (%)
Data Table on Type - Market share 2025-2030 (%)

9.2 Comparison by Type

Chart on Comparison by Type
Data Table on Comparison by Type

9.3 Unit handling - Market size and forecast 2025-2030

Chart on Unit handling - Market size and forecast 2025-2030 ($ million)
Data Table on Unit handling - Market size and forecast 2025-2030 ($ million)
Chart on Unit handling - Year-over-year growth 2025-2030 (%)
Data Table on Unit handling - Year-over-year growth 2025-2030 (%)

9.4 Bulk handling - Market size and forecast 2025-2030

Chart on Bulk handling - Market size and forecast 2025-2030 ($ million)
Data Table on Bulk handling - Market size and forecast 2025-2030 ($ million)
Chart on Bulk handling - Year-over-year growth 2025-2030 (%)
Data Table on Bulk handling - Year-over-year growth 2025-2030 (%)

9.5 Market opportunity by Type

Market opportunity by Type ($ million)
Data Table on Market opportunity by Type ($ million)

10. Market Segmentation by Product Type

10.1 Market segments

Chart on Product Type - Market share 2025-2030 (%)
Data Table on Product Type - Market share 2025-2030 (%)

10.2 Comparison by Product Type

Chart on Comparison by Product Type
Data Table on Comparison by Product Type

10.3 Light-weight - Market size and forecast 2025-2030

Chart on Light-weight - Market size and forecast 2025-2030 ($ million)
Data Table on Light-weight - Market size and forecast 2025-2030 ($ million)
Chart on Light-weight - Year-over-year growth 2025-2030 (%)
Data Table on Light-weight - Year-over-year growth 2025-2030 (%)

10.4 Medium-weight - Market size and forecast 2025-2030

Chart on Medium-weight - Market size and forecast 2025-2030 ($ million)
Data Table on Medium-weight - Market size and forecast 2025-2030 ($ million)
Chart on Medium-weight - Year-over-year growth 2025-2030 (%)
Data Table on Medium-weight - Year-over-year growth 2025-2030 (%)

10.5 Heavy-weight - Market size and forecast 2025-2030

Chart on Heavy-weight - Market size and forecast 2025-2030 ($ million)
Data Table on Heavy-weight - Market size and forecast 2025-2030 ($ million)
Chart on Heavy-weight - Year-over-year growth 2025-2030 (%)
Data Table on Heavy-weight - Year-over-year growth 2025-2030 (%)

10.6 Market opportunity by Product Type

Market opportunity by Product Type ($ million)
Data Table on Market opportunity by Product Type ($ million)

11. Customer Landscape

11.1 Customer landscape overview

Analysis of price sensitivity, lifecycle, customer purchase basket, adoption rates, and purchase criteria

12. Geographic Landscape

12.1 Geographic segmentation

Chart on Market share by geography 2025-2030 (%)
Data Table on Market share by geography 2025-2030 (%)

12.2 Geographic comparison

Chart on Geographic comparison
Data Table on Geographic comparison

12.3 APAC - Market size and forecast 2025-2030

Chart on APAC - Market size and forecast 2025-2030 ($ million)
Data Table on APAC - Market size and forecast 2025-2030 ($ million)
Chart on APAC - Year-over-year growth 2025-2030 (%)
Data Table on APAC - Year-over-year growth 2025-2030 (%)
Chart on Regional Comparison - APAC
Data Table on Regional Comparison - APAC

12.3.1 China - Market size and forecast 2025-2030

Chart on China - Market size and forecast 2025-2030 ($ million)
Data Table on China - Market size and forecast 2025-2030 ($ million)
Chart on China - Year-over-year growth 2025-2030 (%)
Data Table on China - Year-over-year growth 2025-2030 (%)

12.3.2 Japan - Market size and forecast 2025-2030

Chart on Japan - Market size and forecast 2025-2030 ($ million)
Data Table on Japan - Market size and forecast 2025-2030 ($ million)
Chart on Japan - Year-over-year growth 2025-2030 (%)
Data Table on Japan - Year-over-year growth 2025-2030 (%)

12.3.3 India - Market size and forecast 2025-2030

Chart on India - Market size and forecast 2025-2030 ($ million)
Data Table on India - Market size and forecast 2025-2030 ($ million)
Chart on India - Year-over-year growth 2025-2030 (%)
Data Table on India - Year-over-year growth 2025-2030 (%)

12.3.4 South Korea - Market size and forecast 2025-2030

Chart on South Korea - Market size and forecast 2025-2030 ($ million)
Data Table on South Korea - Market size and forecast 2025-2030 ($ million)
Chart on South Korea - Year-over-year growth 2025-2030 (%)
Data Table on South Korea - Year-over-year growth 2025-2030 (%)

12.3.5 Australia - Market size and forecast 2025-2030

Chart on Australia - Market size and forecast 2025-2030 ($ million)
Data Table on Australia - Market size and forecast 2025-2030 ($ million)
Chart on Australia - Year-over-year growth 2025-2030 (%)
Data Table on Australia - Year-over-year growth 2025-2030 (%)

12.3.6 Indonesia - Market size and forecast 2025-2030

Chart on Indonesia - Market size and forecast 2025-2030 ($ million)
Data Table on Indonesia - Market size and forecast 2025-2030 ($ million)
Chart on Indonesia - Year-over-year growth 2025-2030 (%)
Data Table on Indonesia - Year-over-year growth 2025-2030 (%)

12.4 North America - Market size and forecast 2025-2030

Chart on North America - Market size and forecast 2025-2030 ($ million)
Data Table on North America - Market size and forecast 2025-2030 ($ million)
Chart on North America - Year-over-year growth 2025-2030 (%)
Data Table on North America - Year-over-year growth 2025-2030 (%)
Chart on Regional Comparison - North America
Data Table on Regional Comparison - North America

12.4.1 US - Market size and forecast 2025-2030

Chart on US - Market size and forecast 2025-2030 ($ million)
Data Table on US - Market size and forecast 2025-2030 ($ million)
Chart on US - Year-over-year growth 2025-2030 (%)
Data Table on US - Year-over-year growth 2025-2030 (%)

12.4.2 Canada - Market size and forecast 2025-2030

Chart on Canada - Market size and forecast 2025-2030 ($ million)
Data Table on Canada - Market size and forecast 2025-2030 ($ million)
Chart on Canada - Year-over-year growth 2025-2030 (%)
Data Table on Canada - Year-over-year growth 2025-2030 (%)

12.4.3 Mexico - Market size and forecast 2025-2030

Chart on Mexico - Market size and forecast 2025-2030 ($ million)
Data Table on Mexico - Market size and forecast 2025-2030 ($ million)
Chart on Mexico - Year-over-year growth 2025-2030 (%)
Data Table on Mexico - Year-over-year growth 2025-2030 (%)

12.5 Europe - Market size and forecast 2025-2030

Chart on Europe - Market size and forecast 2025-2030 ($ million)
Data Table on Europe - Market size and forecast 2025-2030 ($ million)
Chart on Europe - Year-over-year growth 2025-2030 (%)
Data Table on Europe - Year-over-year growth 2025-2030 (%)
Chart on Regional Comparison - Europe
Data Table on Regional Comparison - Europe

12.5.1 Germany - Market size and forecast 2025-2030

Chart on Germany - Market size and forecast 2025-2030 ($ million)
Data Table on Germany - Market size and forecast 2025-2030 ($ million)
Chart on Germany - Year-over-year growth 2025-2030 (%)
Data Table on Germany - Year-over-year growth 2025-2030 (%)

12.5.2 UK - Market size and forecast 2025-2030

Chart on UK - Market size and forecast 2025-2030 ($ million)
Data Table on UK - Market size and forecast 2025-2030 ($ million)
Chart on UK - Year-over-year growth 2025-2030 (%)
Data Table on UK - Year-over-year growth 2025-2030 (%)

12.5.3 France - Market size and forecast 2025-2030

Chart on France - Market size and forecast 2025-2030 ($ million)
Data Table on France - Market size and forecast 2025-2030 ($ million)
Chart on France - Year-over-year growth 2025-2030 (%)
Data Table on France - Year-over-year growth 2025-2030 (%)

12.5.4 Italy - Market size and forecast 2025-2030

Chart on Italy - Market size and forecast 2025-2030 ($ million)
Data Table on Italy - Market size and forecast 2025-2030 ($ million)
Chart on Italy - Year-over-year growth 2025-2030 (%)
Data Table on Italy - Year-over-year growth 2025-2030 (%)

12.5.5 Spain - Market size and forecast 2025-2030

Chart on Spain - Market size and forecast 2025-2030 ($ million)
Data Table on Spain - Market size and forecast 2025-2030 ($ million)
Chart on Spain - Year-over-year growth 2025-2030 (%)
Data Table on Spain - Year-over-year growth 2025-2030 (%)

12.5.6 The Netherlands - Market size and forecast 2025-2030

Chart on The Netherlands - Market size and forecast 2025-2030 ($ million)
Data Table on The Netherlands - Market size and forecast 2025-2030 ($ million)
Chart on The Netherlands - Year-over-year growth 2025-2030 (%)
Data Table on The Netherlands - Year-over-year growth 2025-2030 (%)

12.6 South America - Market size and forecast 2025-2030

Chart on South America - Market size and forecast 2025-2030 ($ million)
Data Table on South America - Market size and forecast 2025-2030 ($ million)
Chart on South America - Year-over-year growth 2025-2030 (%)
Data Table on South America - Year-over-year growth 2025-2030 (%)
Chart on Regional Comparison - South America
Data Table on Regional Comparison - South America

12.6.1 Brazil - Market size and forecast 2025-2030

Chart on Brazil - Market size and forecast 2025-2030 ($ million)
Data Table on Brazil - Market size and forecast 2025-2030 ($ million)
Chart on Brazil - Year-over-year growth 2025-2030 (%)
Data Table on Brazil - Year-over-year growth 2025-2030 (%)

12.6.2 Argentina - Market size and forecast 2025-2030

Chart on Argentina - Market size and forecast 2025-2030 ($ million)
Data Table on Argentina - Market size and forecast 2025-2030 ($ million)
Chart on Argentina - Year-over-year growth 2025-2030 (%)
Data Table on Argentina - Year-over-year growth 2025-2030 (%)

12.6.3 Chile - Market size and forecast 2025-2030

Chart on Chile - Market size and forecast 2025-2030 ($ million)
Data Table on Chile - Market size and forecast 2025-2030 ($ million)
Chart on Chile - Year-over-year growth 2025-2030 (%)
Data Table on Chile - Year-over-year growth 2025-2030 (%)

12.7 Middle East and Africa - Market size and forecast 2025-2030

Chart on Middle East and Africa - Market size and forecast 2025-2030 ($ million)
Data Table on Middle East and Africa - Market size and forecast 2025-2030 ($ million)
Chart on Middle East and Africa - Year-over-year growth 2025-2030 (%)
Data Table on Middle East and Africa - Year-over-year growth 2025-2030 (%)
Chart on Regional Comparison - Middle East and Africa
Data Table on Regional Comparison - Middle East and Africa

12.7.1 Saudi Arabia - Market size and forecast 2025-2030

Chart on Saudi Arabia - Market size and forecast 2025-2030 ($ million)
Data Table on Saudi Arabia - Market size and forecast 2025-2030 ($ million)
Chart on Saudi Arabia - Year-over-year growth 2025-2030 (%)
Data Table on Saudi Arabia - Year-over-year growth 2025-2030 (%)

12.7.2 UAE - Market size and forecast 2025-2030

Chart on UAE - Market size and forecast 2025-2030 ($ million)
Data Table on UAE - Market size and forecast 2025-2030 ($ million)
Chart on UAE - Year-over-year growth 2025-2030 (%)
Data Table on UAE - Year-over-year growth 2025-2030 (%)

12.7.3 South Africa - Market size and forecast 2025-2030

Chart on South Africa - Market size and forecast 2025-2030 ($ million)
Data Table on South Africa - Market size and forecast 2025-2030 ($ million)
Chart on South Africa - Year-over-year growth 2025-2030 (%)
Data Table on South Africa - Year-over-year growth 2025-2030 (%)

12.7.4 Israel - Market size and forecast 2025-2030

Chart on Israel - Market size and forecast 2025-2030 ($ million)
Data Table on Israel - Market size and forecast 2025-2030 ($ million)
Chart on Israel - Year-over-year growth 2025-2030 (%)
Data Table on Israel - Year-over-year growth 2025-2030 (%)

12.7.5 Turkey - Market size and forecast 2025-2030

Chart on Turkey - Market size and forecast 2025-2030 ($ million)
Data Table on Turkey - Market size and forecast 2025-2030 ($ million)
Chart on Turkey - Year-over-year growth 2025-2030 (%)
Data Table on Turkey - Year-over-year growth 2025-2030 (%)

12.8 Market opportunity by geography

Market opportunity by geography ($ million)
Data Tables on Market opportunity by geography ($ million)

13. Drivers, Challenges, and Opportunity

13.1 Market drivers

Rapid expansion and automation of e-commerce logistics infrastructure
Acceleration of critical minerals mining and heavy-duty infrastructure demands
Strict food safety standards and processing plant modernization

13.2 Market challenges

Severe raw material cost volatility and margin compression
Geopolitical trade disruptions and freight logistics bottlenecks
Integration complexities with legacy infrastructure and high capital barriers

13.3 Impact of drivers and challenges

Impact of drivers and challenges in 2025 and 2030

13.4 Market opportunities

Proliferation of smart conveyor belts integrated with AI and IoT
Surging demand for sustainable, low-carbon, and eco-friendly conveyor materials
Rapid adoption of modular plastic and steep incline conveyors in high-throughput intralogistics

14. Competitive Landscape

14.1 Overview

14.2

Overview on criticality of inputs and factors of differentiation

14.3 Landscape disruption

Overview on factors of disruption

14.4 Industry risks

Impact of key risks on business

15. Competitive Analysis

15.1 Companies profiled

Companies covered

15.2 Company ranking index

15.3 Market positioning of companies

Matrix on companies position and classification

15.4 Ammeraal Beltech

Ammeraal Beltech - Overview
Ammeraal Beltech - Product / Service
Ammeraal Beltech - Key offerings
SWOT

15.5 Bando Chemical Industries Ltd.

Bando Chemical Industries Ltd. - Overview
Bando Chemical Industries Ltd. - Business segments
Bando Chemical Industries Ltd. - Key offerings
Bando Chemical Industries Ltd. - Segment focus
SWOT

15.6 Bridgestone Corp.

Bridgestone Corp. - Overview
Bridgestone Corp. - Business segments
Bridgestone Corp. - Key offerings
Bridgestone Corp. - Segment focus
SWOT

15.7 Continental AG

Continental AG - Overview
Continental AG - Business segments
Continental AG - Key offerings
Continental AG - Segment focus
SWOT

15.8 Fenner Dunlop

Fenner Dunlop - Overview
Fenner Dunlop - Product / Service
Fenner Dunlop - Key offerings
SWOT

15.9 Forbo Management SA

Forbo Management SA - Overview
Forbo Management SA - Business segments
Forbo Management SA - Key offerings
Forbo Management SA - Segment focus
SWOT

15.10 Habasit International AG

Habasit International AG - Overview
Habasit International AG - Product / Service
Habasit International AG - Key offerings
SWOT

15.11 Intralox LLC

Intralox LLC - Overview
Intralox LLC - Product / Service
Intralox LLC - Key offerings
SWOT

15.12 Mitsuboshi Belting Ltd.

Mitsuboshi Belting Ltd. - Overview
Mitsuboshi Belting Ltd. - Product / Service
Mitsuboshi Belting Ltd. - Key offerings
SWOT

15.13 Nitta Corp

Nitta Corp - Overview
Nitta Corp - Business segments
Nitta Corp - Key offerings
Nitta Corp - Segment focus
SWOT

15.14 Oriental Rubber Industries Ltd.

Oriental Rubber Industries Ltd. - Overview
Oriental Rubber Industries Ltd. - Product / Service
Oriental Rubber Industries Ltd. - Key offerings
SWOT

15.15 SOMI Conveyor Beltings Ltd

SOMI Conveyor Beltings Ltd - Overview
SOMI Conveyor Beltings Ltd - Product / Service
SOMI Conveyor Beltings Ltd - Key offerings
SWOT

15.16 Volta Belting Technology Ltd.

Volta Belting Technology Ltd. - Overview
Volta Belting Technology Ltd. - Product / Service
Volta Belting Technology Ltd. - Key offerings
SWOT

15.17 Wire Belt Co Ltd.

Wire Belt Co Ltd. - Overview
Wire Belt Co Ltd. - Product / Service
Wire Belt Co Ltd. - Key offerings
SWOT

15.18 Yokohama Rubber Co. Ltd.

Yokohama Rubber Co. Ltd. - Overview
Yokohama Rubber Co. Ltd. - Business segments
Yokohama Rubber Co. Ltd. - Key offerings
Yokohama Rubber Co. Ltd. - Segment focus
SWOT

16. Appendix

16.1 Scope of the report

Market definition
Objectives
Notes and caveats

16.2 Inclusions and exclusions checklist

Inclusions checklist
Exclusions checklist

16.3 Currency conversion rates for US$

16.4 Research methodology

16.5 Data procurement

Information sources

16.6 Data validation

16.7 Validation techniques employed for market sizing

16.8 Data synthesis

16.9 360 degree market analysis

16.10 List of abbreviations

Research Methodology

Technavio presents a detailed picture of the market by way of study, synthesis, and summation of data from multiple sources. The analysts have presented the various facets of the market with a particular focus on identifying the key industry influencers. The data thus presented is comprehensive, reliable, and the result of extensive research, both primary and secondary.

INFORMATION SOURCES

Primary sources

  • Manufacturers and suppliers
  • Channel partners
  • Industry experts
  • Strategic decision makers

Secondary sources

  • Industry journals and periodicals
  • Government data
  • Financial reports of key industry players
  • Historical data
  • Press releases

DATA ANALYSIS

Data Synthesis

  • Collation of data
  • Estimation of key figures
  • Analysis of derived insights

Data Validation

  • Triangulation with data models
  • Reference against proprietary databases
  • Corroboration with industry experts

REPORT WRITING

Qualitative

  • Market drivers
  • Market challenges
  • Market trends
  • Five forces analysis

Quantitative

  • Market size and forecast
  • Market segmentation
  • Geographical insights
  • Competitive landscape

Interested in this report?

Get your sample now to see our research methodology and insights!

Download Now

Frequently Asked Questions

Conveyor Belt market growth will increase by USD 1566.4 million during 2026-2030.

The Conveyor Belt market is expected to grow at a CAGR of 4.5% during 2026-2030.

Conveyor Belt market is segmented by End-user (Retail, Food and beverage, Automotive, Others) Type (Unit handling, Bulk handling) Product type (Light-weight, Medium-weight, Heavy-weight)

Ammeraal Beltech, Bando Chemical Industries Ltd., BEHA Innovation GmbH, Bridgestone Corp., Continental AG, Dorner Mfg. Corp., Dynamic Rubbers Pvt. Ltd., Esbelt SA, Fenner Dunlop, Forbo Management SA, Habasit International AG, Intralox LLC, Mitsuboshi Belting Ltd., Nitta Corp, Oriental Rubber Industries Ltd., Sempertrans Conveyor Belt, SOMI Conveyor Beltings Ltd, Volta Belting Technology Ltd., Wire Belt Co Ltd., Yokohama Rubber Co. Ltd. are a few of the key vendors in the Conveyor Belt market.

APAC will register the highest growth rate of 46.9% among the other regions. Therefore, the Conveyor Belt market in APAC is expected to garner significant business opportunities for the vendors during the forecast period.

China, Japan, India, South Korea, Australia, Indonesia, US, Canada, Mexico, Germany, UK, France, Italy, Spain, The Netherlands, Brazil, Argentina, Chile, Saudi Arabia, UAE, South Africa, Israel, Turkey

  • Rapid expansion and automation of e-commerce logistics infrastructure is the driving factor this market.

The Conveyor Belt market vendors should focus on grabbing business opportunities from the End-user segment as it accounted for the largest market share in the base year.
RIA - Research AI Assistant
Ask RIA
