
Copper Alloy Wire Market Size 2025-2029
The copper alloy wire market size is forecast to increase by USD 19.6 billion, at a CAGR of 3.3% between 2024 and 2029.
- The market is experiencing significant growth due to the expanding communication, electrical, and electronics industries. The increasing adoption of advanced technologies in these sectors, such as 5G networks and renewable energy systems, is driving the demand for copper alloy wires. Copper alloys offer superior conductivity, durability, and resistance to corrosion, making them an ideal choice for various applications. However, the market faces challenges due to the growing constraints on copper supply. Copper is a finite resource, and its increasing demand, coupled with limited availability, is pushing prices up. This trend is expected to continue, posing a significant challenge for market participants.
- Furthermore, the rising cost of copper is making alternative wire materials, such as aluminum and fiber optics, increasingly attractive to some industries. Companies in the market must navigate these challenges by exploring new sources of copper, improving production efficiency, and diversifying their product offerings to remain competitive. Additionally, investing in research and development to create more cost-effective and sustainable copper alloy wire solutions could provide a strategic advantage.
What will be the Size of the Copper Alloy Wire Market during the forecast period?

- The market is experiencing significant advancements driven by the integration of technology in various industries. Conductivity testing and mechanical testing are crucial in ensuring wire performance in diverse applications. The Internet of Things (IoT) and smart grids are fueling the demand for wire traceability to ensure reliability and efficiency. Artificial intelligence and big data analytics are revolutionizing wire manufacturing processes for cost optimization and performance enhancement. Advancements in additive manufacturing and 3D printing enable the production of lightweight and high-strength materials for wire manufacturing. Green technologies, such as biodegradable materials and energy efficiency, are gaining traction in the market.
- Smart product design and predictive maintenance are essential for improving wire quality control and supply chain management. Wire processing equipment and inspection methods are evolving to meet the demands of advanced applications. Fatigue testing, corrosion testing, and material characterization through microstructure analysis are crucial for ensuring wire durability and reliability. The integration of AI and big data analytics in wire manufacturing and testing processes is enabling real-time monitoring and predictive maintenance, enhancing overall efficiency and reducing downtime. Electric vehicles and renewable energy sources are driving the growth of the market. The focus on energy efficiency and cost optimization is leading to the development of new wire manufacturing processes and technologies.
- The integration of digital twins in wire manufacturing and testing is enabling virtual prototyping and simulation, reducing the need for physical prototypes and accelerating time-to-market. In summary, the market is witnessing significant advancements driven by technology integration, sustainability, and efficiency. Conductivity testing, mechanical testing, wire traceability, and advanced manufacturing processes are essential for meeting the demands of diverse applications. The integration of AI, big data analytics, and digital twins is enabling real-time monitoring, predictive maintenance, and cost optimization, making the market a dynamic and evolving industry.
How is this Copper Alloy Wire Industry segmented?
The copper alloy wire industry research report provides comprehensive data (region-wise segment analysis), with forecasts and estimates in "USD billion" for the period 2025-2029, as well as historical data from 2019-2023 for the following segments.
- Application
- Low voltage
- Medium voltage
- High voltage
- End-user
- Electrical and electronics
- Construction
- Automotive
- Others
- Type
- Bare
- Tinned
- Silver-plated
- Nickel-plated
- Geography
- North America
- US
- Canada
- Europe
- France
- Germany
- UK
- APAC
- China
- India
- Japan
- South Korea
- South America
- Argentina
- Rest of World (ROW)
- North America
By Application Insights
The low voltage segment is estimated to witness significant growth during the forecast period. The market encompasses a diverse range of products, including coils of various sizes, aluminum bronze, copper-nickel alloys, electrical conductivity wires, copper-tin alloys, enameled wires, brass wires, and more. Among these, the low voltage segment has emerged as a significant driver in the market. This segment, characterized by its requirement for wires with reduced voltage capacity, is foundational to numerous industries, such as telecommunications and electronics, automotive, and construction. The continuous expansion of electronic devices and communication networks has fueled the demand for copper alloy wires designed specifically for low voltage applications. Copper alloys, including copper-silicon, copper-manganese, and copper-zinc, offer advantages like improved tensile strength, corrosion resistance, and thermal conductivity.
Alloy composition plays a crucial role in determining the properties of these wires. Wire spooling, wire drawing, and other manufacturing processes ensure consistent product quality. Wire termination, wire bundling, wire winding, and cable assembly are essential processes in the production and application of copper alloy wires. Applications span across industries, from precision instruments and wire harnesses in automobiles to medical devices and power generation. High-performance alloys like beryllium copper and nickel silver cater to the demands of specific industries. Copper alloy wires are integral to renewable energy systems, with bronze wire used in wind turbines and copper-iron alloys in solar panels.
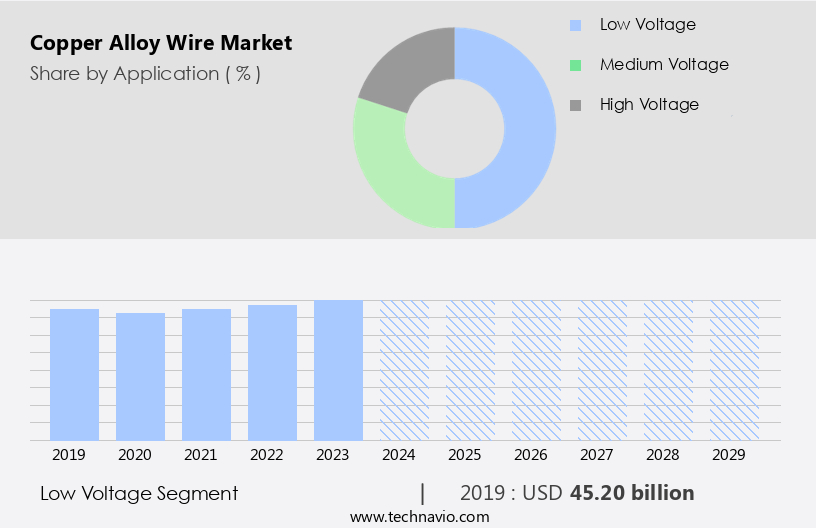
The Low voltage segment was valued at USD 45.20 billion in 2019 and showed a gradual increase during the forecast period. Wire coating, heat treatment, and phosphor bronze are other essential aspects of copper alloy wire production. The market also includes silver-plated, nickel-plated, and tinned wires for enhanced performance and durability. In summary, the market is a dynamic and evolving industry, with the low voltage segment leading the way in innovation and consumer demand. Copper alloy wires, with their diverse properties and applications, continue to play a vital role in power transfer, signal reliability, and connectivity across various industries.
Regional Analysis
APAC is estimated to contribute 43% to the growth of the global market during the forecast period. Technavio's analysts have elaborately explained the regional trends and drivers that shape the market during the forecast period.

The market is experiencing significant growth, with APAC being the largest consumer and fastest-growing region. The region's industrialization and the expanding electrical and electronics industry are driving this demand. Rapidly increasing disposable income, government initiatives, and the preference for advanced technology are fueling the growth of the electronics industry in APAC. China, India, and Japan are the major contributors to the rising demand for copper alloy wires in this region. Copper alloy wires are widely used in various industries due to their unique properties. Aluminum bronze and copper-nickel alloys offer excellent corrosion resistance and high tensile strength, making them ideal for use in marine and automotive applications.
Copper-tin alloys and enameled wires are essential components in electrical wiring and electronics manufacturing. Brass wires, copper alloys, and copper-silicon alloys are commonly used in precision instruments and wire harnesses. Medical devices, cable assembly, and renewable energy applications utilize copper alloys due to their high thermal conductivity and fatigue resistance. Copper-manganese alloys, nickel-plated wires, and silver-plated wires provide enhanced electrical conductivity and resistance to oxidation. Wire spooling, wire termination, and wire bundling are crucial processes in the production of copper alloy wires. High-performance alloys, such as beryllium copper and nickel silver, are used in applications requiring high strength and conductivity.
Copper-iron alloys, cadmium copper, and tinned wires are used in various industrial applications due to their excellent electrical conductivity and resistance to corrosion. Gold-plated wires and copper-zinc alloys are used in high-end applications due to their superior electrical conductivity and aesthetic appeal. Copper alloy wires are used extensively in power generation, particularly in the production of wind and solar energy. Wire drawing, heat treatment, and wire winding are essential processes in the production of these wires. The market is expected to continue its growth trajectory due to the increasing demand for electrical and electronic products and the expanding renewable energy sector.
Market Dynamics
Our researchers analyzed the data with 2024 as the base year, along with the key drivers, trends, and challenges. A holistic analysis of drivers will help companies refine their marketing strategies to gain a competitive advantage.
What are the Copper Alloy Wire market drivers leading to the rise in the adoption of Industry?
- The communication, electrical, and electronics industries, characterized by their significant growth, serve as the primary catalyst for market expansion. Copper alloy wires play a significant role in the communication and electrical and electronics industries, particularly in applications such as domestic subscriber lines, local area networks, mobile phones, transformers, connectors, and various electronic devices. In microprocessors, they are utilized to manufacture circuits due to their heat-sink properties and high efficiency, which aids in removing heat from transistors and enhancing processor operating capacity. The high electrical conductivity of copper alloy wires makes them an ideal choice for manufacturing power cables for medium- and low-voltage applications. The global electronics-electrical and electronics sector is undergoing a period of rapid expansion, fueled by increasing consumer and industrial demand for electronic goods. The demand for copper alloy wires is expected to remain strong due to their essential role in the electronics-electrical and electronics industry.
- Copper alloy wires are essential in this sector due to their high-performance properties, including corrosion resistance, thermal conductivity, and durability. To enhance their functionality, copper alloy wires undergo various processes, such as wire drawing, alloy composition modification, nickel-plating, heat treatment, and wire coating. These processes improve the wires' resistance to environmental conditions, increase their thermal conductivity, and enhance their overall performance. Phosphor bronze and other high-performance alloys are popular choices for applications requiring superior mechanical strength and electrical conductivity. Wire bundling is another technique used to improve the efficiency and durability of copper alloy wires in large-scale applications. Their high-performance properties, including corrosion resistance, thermal conductivity, and durability, make them an indispensable component in various applications, from power generation to electronics manufacturing.
What are the Copper Alloy Wire market trends shaping the Industry?
- The trend in the energy market is shifting towards an increasing number of renewable energy installations. Renewable energy sources, such as solar, wind, and hydroelectric power, are becoming increasingly popular and are expected to dominate the energy sector in the near future. Copper alloy wires play a crucial role in various industries, particularly in the renewable energy sector. Their high conductivity, which is nearly double that of aluminum wires, makes them an ideal choice for high-energy efficiency applications. This attribute contributes to the reduction of overall installation costs, especially in solar and wind power projects. In the realm of renewable energy, copper alloy wires are extensively utilized in the fabrication of photovoltaic (PV) systems. They are essential in creating connections within the thin films of semiconductors, which have a layered atomic structure displaying distinct energy band gaps.
- Copper alloys, such as copper-zinc alloys, cadmium copper, tinned wire, and gold-plated wire, undergo processes like cold drawing to enhance their strength and fatigue resistance. These properties make them suitable for applications requiring long-term durability and reliability. Beyond renewable energy, copper alloy wires are also integral to cable assembly in various industries. Their versatility and robustness enable them to meet diverse requirements, from automotive to telecommunications, and from aerospace to medical equipment. The demand for copper alloy wires continues to grow, driven by their superior conductivity, cost-effectiveness, and durability. As the renewable energy sector expands, the market for copper alloy wires is expected to follow suit, underpinned by advancements in technology and increasing environmental consciousness.
How does Copper Alloy Wire market face challenges during its growth?
- The copper industry faces significant growth constraints due to increasing supply limitations. The market is experiencing notable growth due to the increasing demand from various industries, particularly in the energy and construction sectors. The electrification trend, driven by countries' commitments to reduce carbon emissions, is a significant factor fueling this demand. Copper alloys, including aluminum bronze, copper-nickel alloys, copper-silicon alloys, and copper-tin alloys, are essential components in electrical conductivity applications. Enameled wire and brass wire are also popular copper alloy products, widely used in precision instruments and wire harnesses. Despite the high demand for copper concentrates, the supply is facing challenges due to geological constraints and mining complexities.
- The global copper production is projected to grow by 3-6% annually to meet the increasing demand and sustain the transition to electric vehicles and renewable energy sources. Copper alloys offer excellent electrical conductivity, durability, and resistance to corrosion, making them indispensable in numerous industries. Wire spooling and processing technologies have also advanced significantly, enabling the production of high-quality copper alloy wires in various sizes and specifications.
Exclusive Customer Landscape
The copper alloy wire market forecasting report includes the adoption lifecycle of the market, covering from the innovator's stage to the laggard's stage. It focuses on adoption rates in different regions based on penetration. Furthermore, the copper alloy wire market report also includes key purchase criteria and drivers of price sensitivity to help companies evaluate and develop their market growth analysis strategies.

Customer Landscape
Key Companies & Market Insights
Companies are implementing various strategies, such as strategic alliances, copper alloy wire market forecast, partnerships, mergers and acquisitions, geographical expansion, and product/service launches, to enhance their presence in the industry.
Alloy Wire International Ltd. - This company specializes in the production and supply of copper alloy wires and high-performance nickel alloys.
The industry research and growth report includes detailed analyses of the competitive landscape of the market and information about key companies, including:
- Alloy Wire International Ltd.
- Aviva Metals Inc.
- Chaplin Bros Birmingham Ltd.
- CK SAN ETSU Co. Ltd.
- Deutsche Nickel GmbH
- Diehl Stiftung and Co. KG
- Furukawa Electric Co. Ltd.
- International Bron Metal SA
- Jelliff
- JLC Electromet Pvt. Ltd.
- Kamman Group
- Knight Strip Metals Ltd
- Little Falls Alloys Inc.
- Metals United Alloys And Fusion Products Ltd.
- Mitsubishi Materials Corp.
- RCI Industries and Technologies Ltd.
- Saru Precision Wires Pvt. Ltd.
- Ulbrich Stainless Steels and Special Metals Inc.
- Wieland Werke AG
- YAMAKIN Co. Ltd.
Qualitative and quantitative analysis of companies has been conducted to help clients understand the wider business environment as well as the strengths and weaknesses of key industry players. Data is qualitatively analyzed to categorize companies as pure play, category-focused, industry-focused, and diversified; it is quantitatively analyzed to categorize companies as dominant, leading, strong, tentative, and weak.
Recent Development and News in Copper Alloy Wire Market
- In January 2023, General Cable, a leading manufacturer of copper, aluminum, and fiber optic wire and cable products, announced the launch of its new line of high-performance copper alloy wires for the renewable energy sector. These wires, featuring advanced alloys and enhanced mechanical properties, are designed to improve efficiency and durability in wind and solar power installations (General Cable Press Release, 2023).
- In March 2024, Prysmian Group, a global leader in energy and telecom cable systems, entered into a strategic partnership with Siemens Energy to jointly develop and manufacture high-voltage direct current (HVDC) copper alloy cables. This collaboration aims to address the growing demand for renewable energy transmission and grid modernization projects (Prysmian Group Press Release, 2024).
- In August 2024, Nexans, a worldwide specialist in the design, production, and supply of copper and fiber optic cables, completed the acquisition of Molex's copper and aluminum wire and cable business. This acquisition strengthened Nexans' position in the automotive and industrial markets, expanding its product portfolio and customer base (Nexans Press Release, 2024).
Research Analyst Overview
Copper alloy wires continue to play a pivotal role in various industries due to their unique properties and evolving applications. The market dynamics of this sector are characterized by constant innovation and adaptation to meet the demands of diverse sectors. Wire winding and cable assembly processes are integral to the production of copper alloys, which find extensive use in precision instruments, wire harnesses, and medical devices. The ongoing pursuit for improved fatigue resistance has led to the development of cadmium copper, tinned wire, and gold-plated wire. Copper-zinc alloys, brass wire, and nickel silver are popular choices for their high tensile strength and corrosion resistance, making them indispensable in electrical wiring and electronics manufacturing.
The alloy composition of copper-nickel alloys and copper-silicon alloys offers enhanced thermal conductivity, while phosphor bronze is preferred for its superior mechanical properties in harsh environments. The renewable energy sector is driving the growth of copper alloys, particularly in power generation applications. Wire spooling, wire diameter, and wire termination are crucial aspects of manufacturing these alloys to meet the specifications of the renewable energy industry. High-performance alloys, such as copper-iron alloys, nickel-plated wire, and beryllium copper, are essential for industries requiring high-strength and heat-resistant wires. Wire bundling and wire coating techniques are employed to enhance the overall performance and durability of these alloys.
The copper alloys market is a dynamic and ever-evolving landscape, with continuous research and development efforts focused on improving the properties and applications of these alloys. The integration of copper alloys in various sectors, from automotive to aerospace, telecommunications to renewable energy, underscores their versatility and importance in modern technology.
Dive into Technavio's strong research methodology, blending expert interviews, extensive data synthesis, and validated models for unparalleled Copper Alloy Wire Market insights. See full methodology.
|
Market Scope |
|
|
Report Coverage |
Details |
|
Page number |
225 |
|
Base year |
2024 |
|
Historic period |
2019-2023 |
|
Forecast period |
2025-2029 |
|
Growth momentum & CAGR |
Accelerate at a CAGR of 3.3% |
|
Market growth 2025-2029 |
USD 19.6 billion |
|
Market structure |
Fragmented |
|
YoY growth 2024-2025(%) |
3.3 |
|
Key countries |
China, Japan, US, India, Germany, UK, South Korea, France, Canada, and Argentina |
|
Competitive landscape |
Leading Companies, Market Positioning of Companies, Competitive Strategies, and Industry Risks |
What are the Key Data Covered in this Copper Alloy Wire Market Research and Growth Report?
- CAGR of the Copper Alloy Wire industry during the forecast period
- Detailed information on factors that will drive the growth and forecasting between 2025 and 2029
- Precise estimation of the size of the market and its contribution of the industry in focus to the parent market
- Accurate predictions about upcoming growth and trends and changes in consumer behaviour
- Growth of the market across APAC, Europe, North America, South America, and Middle East and Africa
- Thorough analysis of the market's competitive landscape and detailed information about companies
- Comprehensive analysis of factors that will challenge the copper alloy wire market growth of industry companies
We can help! Our analysts can customize this copper alloy wire market research report to meet your requirements.
 RIA -
RIA - 
