Copper Market Analysis, Size, and Forecast 2026-2030: APAC (China, India, and Japan), Europe (Germany, France, and UK), North America (US, Canada, and Mexico), South America (Brazil, Argentina, and Colombia), Middle East and Africa (Saudi Arabia, UAE, and South Africa), and Rest of World (ROW)

Copper Market Analysis, Size, and Forecast 2026-2030:
APAC (China, India, and Japan), Europe (Germany, France, and UK), North America (US, Canada, and Mexico), South America (Brazil, Argentina, and Colombia), Middle East and Africa (Saudi Arabia, UAE, and South Africa), and Rest of World (ROW)

Published: Apr 2026 313 Pages SKU: IRTNTR71748

Market Overview at a Glance

$99.13 B
Market Opportunity
6.8%
CAGR 2025 - 2030
70.8%
APAC Growth
$76.95 B
Electrical and electronics segment 2024

Copper Market Size 2026-2030

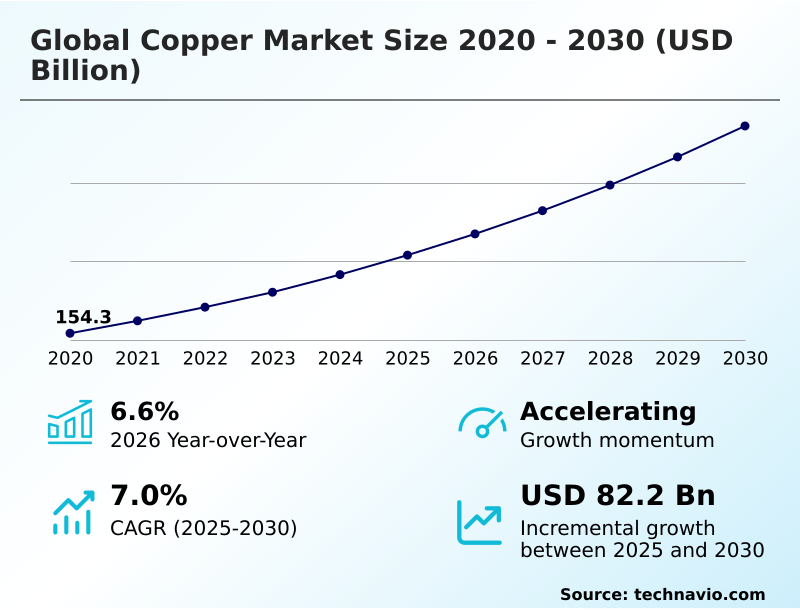
The copper market size is valued to increase by USD 99.13 billion, at a CAGR of 6.8% from 2025 to 2030. Structural grades in global primary mine production will drive the copper market.

Major Market Trends & Insights

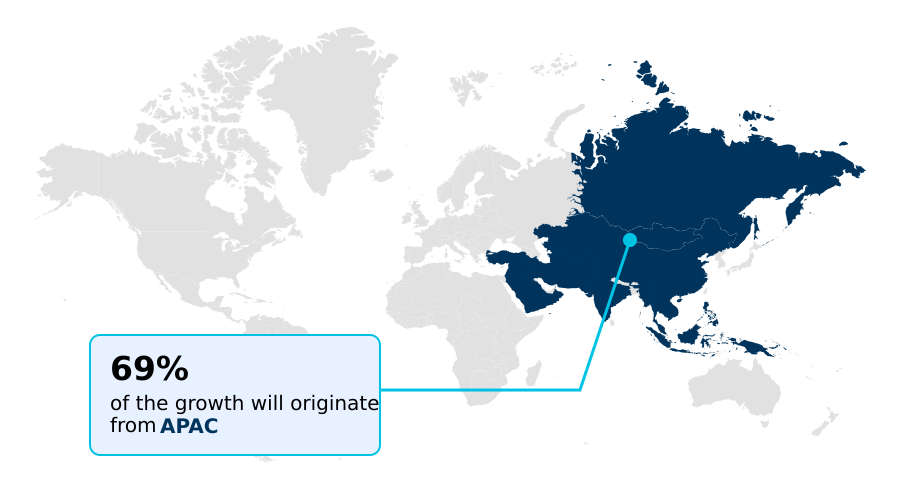
  • APAC dominated the market and accounted for a 70.8% growth during the forecast period.
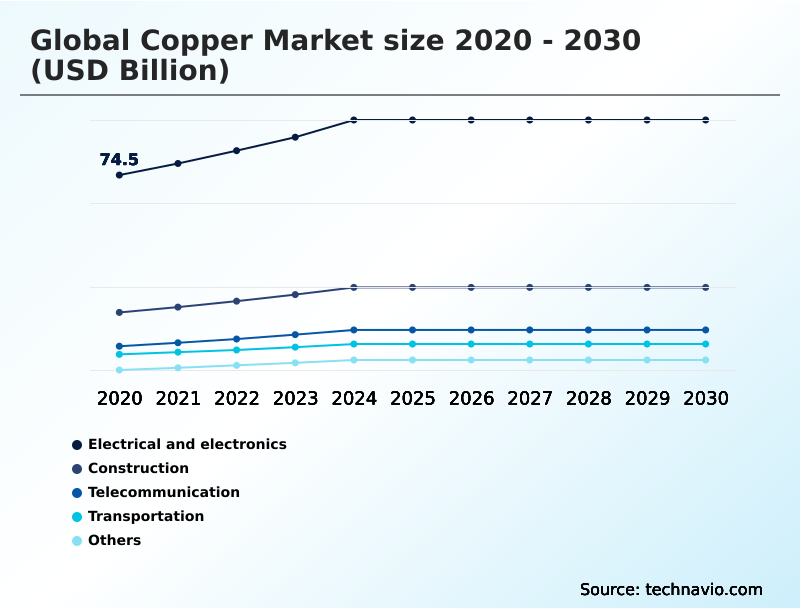
  • By Application - Electrical and electronics segment was valued at USD 76.95 billion in 2024
  • By Type - Primary segment accounted for the largest market revenue share in 2024

Market Size & Forecast

  • Market Opportunities: USD 151.37 billion
  • Market Future Opportunities: USD 99.13 billion
  • CAGR from 2025 to 2030 : 6.8%

Market Summary

  • The Copper Market is navigating a period of significant structural tightening, characterized by a growing divergence between the accelerating requirements of the energy transition and the persistent operational challenges facing primary extraction.
  • The material remains the fundamental conductor for the electrification of the economy, acting as an indispensable material for renewable energy systems, electric vehicle infrastructure, and the massive expansion of smart grid infrastructure.
  • However, the supply side is under increasing strain due to declining ore grades at long-life mines, escalating energy costs for pyrometallurgical smelting, and the technical complexity of developing new projects. Consequently, the industry is witnessing a profound shift toward the circular economy, with secondary copper recovery and urban mining technologies becoming critical.
  • As a business scenario, a manufacturer of HVDC submarine cables must now balance the need for high-purity copper cathodes against supply chain volatility, increasingly using predictive maintenance in mining data and digital twin modeling to forecast availability and secure long-term contracts for copper concentrate supply, mitigating risks associated with geologic disruptions and resource nationalism.
  • This evolution ensures copper maintains its status as a strategic critical mineral, essential for global decarbonization goals.

What will be the Size of the Copper Market during the forecast period?

Get Key Insights on Market Forecast (PDF) Request Free Sample

How is the Copper Market Segmented?

The copper industry research report provides comprehensive data (region-wise segment analysis), with forecasts and estimates in "USD million" for the period 2026-2030, as well as historical data from 2020-2024 for the following segments.

  • Application
    • Electrical and electronics
    • Construction
    • Transportation
    • Telecommunication
    • Others
  • Type
    • Primary
    • Secondary
  • Product type
    • Wire
    • Tube
    • Flat rolled products
    • Rods and bars
    • Foil
  • Geography
    • APAC
      • China
      • India
      • Japan
    • Europe
      • Germany
      • France
      • UK
    • North America
      • US
      • Canada
      • Mexico
    • South America
      • Brazil
      • Argentina
      • Colombia
    • Middle East and Africa
      • Saudi Arabia
      • UAE
      • South Africa
    • Rest of World (ROW)

By Application Insights

The electrical and electronics segment is estimated to witness significant growth during the forecast period.

The electrical and electronics segment is foundational, driven by copper's unmatched conductivity. Demand for high-purity copper cathodes and advanced materials like electrodeposited copper foil is intensifying, particularly for power distribution in data centers supporting AI, where electromigration resistance is key.

The proliferation of high-performance computing requires vast quantities of copper interconnects and efficient thermal management systems using inner-grooved copper tubes.

This demand is creating new, high-volume consumption channels, with some applications seeing a 28% increase in material specification upgrades to support high-frequency environments.

The push for miniaturization in semiconductors also relies on rolled copper foil and copper-tin alloys for reliable interconnects, while digital transformation in mining ensures a steady supply of these critical materials for legacy mining operations and modern high-voltage power transmission systems.

Request Free Sample

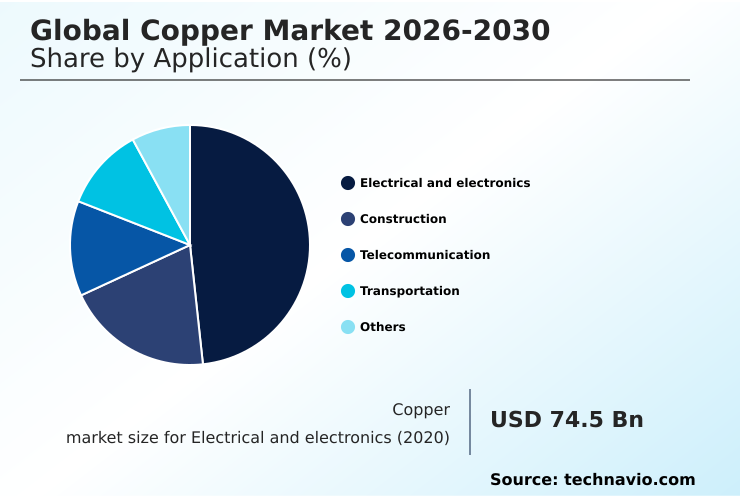
The Electrical and electronics segment was valued at USD 76.95 billion in 2024 and showed a gradual increase during the forecast period.

Request Free Sample

Regional Analysis

APAC is estimated to contribute 70.8% to the growth of the global market during the forecast period.Technavio’s analysts have elaborately explained the regional trends and drivers that shape the market during the forecast period.

See How Copper Market Demand is Rising in APAC Request Free Sample

The geographic landscape is shifting as regions prioritize domestic supply chain resilience and mineral security initiatives.

In North America, policy-driven inventory strategies have led to events such as a 28% increase in imports from specific trade partners ahead of anticipated tariffs.

APAC remains a consumption powerhouse, but its role is evolving toward advanced processing and urban mining technologies. In South America, binational mining treaties and green mining initiatives are enabling the development of complex ore bodies using advanced hydrometallurgical solvent extraction.

Meanwhile, the Middle East is securing upstream assets to support its own infrastructure goals.

This global recalibration is driven by the need to secure materials like oxygen-free high-conductivity copper and copper-clad aluminum wire for energy and tech sectors, reflecting a complex interplay of geology and geopolitics.

Market Dynamics

Our researchers analyzed the data with 2025 as the base year, along with the key drivers, trends, and challenges. A holistic analysis of drivers will help companies refine their marketing strategies to gain a competitive advantage.

  • The future of the copper market is inextricably linked to global megatrends, with the impact of AI on copper demand and the soaring copper demand for data center cooling creating new consumption frontiers.
  • The role of copper in electric vehicle batteries is particularly critical, with copper foil for lithium-ion battery anodes being a key component driving material specifications and purity requirements. A crucial industry debate remains copper vs aluminum in power transmission, where copper’s superior conductivity is weighed against aluminum's cost and weight advantages.
  • Concurrently, advanced copper recycling technology trends are gaining strategic importance to address the challenges in primary copper mine production and bolster the strategic importance of secondary copper supply. The impact of decarbonization on copper consumption is profound, increasing the copper intensity in renewable energy systems and highlighting the importance of sustainable copper mining and ESG factors.
  • This is seen in applications from optimizing copper use in HVAC systems to developing new copper alloys for high-speed rail infrastructure. Ultimately, the market is navigating copper price volatility and supply disruptions, the tariff impact on global copper trade, and the talent shortage in copper mining industry.
  • These factors shape everything from the production of high-purity copper in semiconductor manufacturing to copper's role in smart grid modernization.

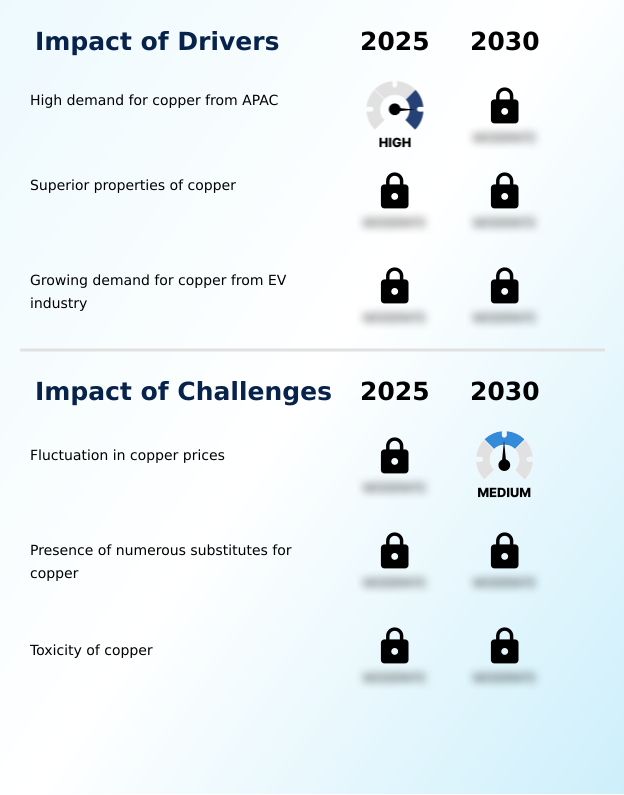
What are the key market drivers leading to the rise in the adoption of Copper Industry?

  • Declining structural grades in global primary mine production are a significant driver, creating supply constraints that directly influence market pricing and investment strategies.

  • The global energy transition is a primary driver, with massive investment in smart grid infrastructure and energy interconnectors demanding unprecedented volumes of copper.
  • Electrification is a key factor, with electric vehicles requiring up to four times more copper than conventional cars, driving demand for 800-volt architectures and related components.
  • This consumption is amplified by the build-out of data centers for AI, which places immense stress on power systems.
  • To meet this need, the industry is advancing green mining initiatives and adopting technologies like gearless mill drive technology and ring-geared mill drive systems.
  • These advanced grinding solutions, part of a broader push for digital transformation in mining, improve efficiency and help manage the challenge of declining ore grades and support the expansion of high-voltage power transmission networks.

What are the market trends shaping the Copper Industry?

  • A widening structural deficit is fundamentally reshaping the market landscape. This is compelling nations to engage in strategic stockpiling of copper, now viewed as a critical asset for energy security and defense readiness.

  • Market dynamics are increasingly shaped by structural deficit dynamics and the rise of strategic national stockpiling, transforming copper into a strategic asset. CRM Act compliance and a focus on allied supply chains are intensifying as nations pursue mineral security initiatives to counter resource nationalism. This has spurred investment in deep-sea mining exploration and technologies that deliver a low-carbon production footprint.
  • For instance, advancements in secondary copper recovery reduce energy use by up to 85% compared to primary extraction. This trend, coupled with the development of pyrometallurgical smelting and froth flotation process optimizations, reflects a market where supply security and sustainability are paramount, influencing everything from copper cathode production to the sourcing of copper-silver alloys.

What challenges does the Copper Industry face during its growth?

  • Escalating trade protectionism and the increasing complexity of tariff regulations present a key challenge, threatening the stability and efficiency of the global supply chain.

  • Key challenges revolve around supply chain integrity and operational capacity, with structural supply imbalances and geologic disruptions creating significant volatility. The industry confronts escalating trade protectionism policies and complex tariff regulatory complexity, which fragment the global market.
  • Furthermore, an interdisciplinary talent scarcity hinders the full implementation of advanced systems like autonomous hauling fleets and automated drilling systems in legacy mining operations. This skills gap is cited by 77% of executives as a primary barrier to digital strategies.
  • Overcoming these hurdles requires investment in both technology and human capital to enhance domestic supply chain resilience, improve ESG reporting benchmarks, and create a more robust data-liquid mining ecosystem.

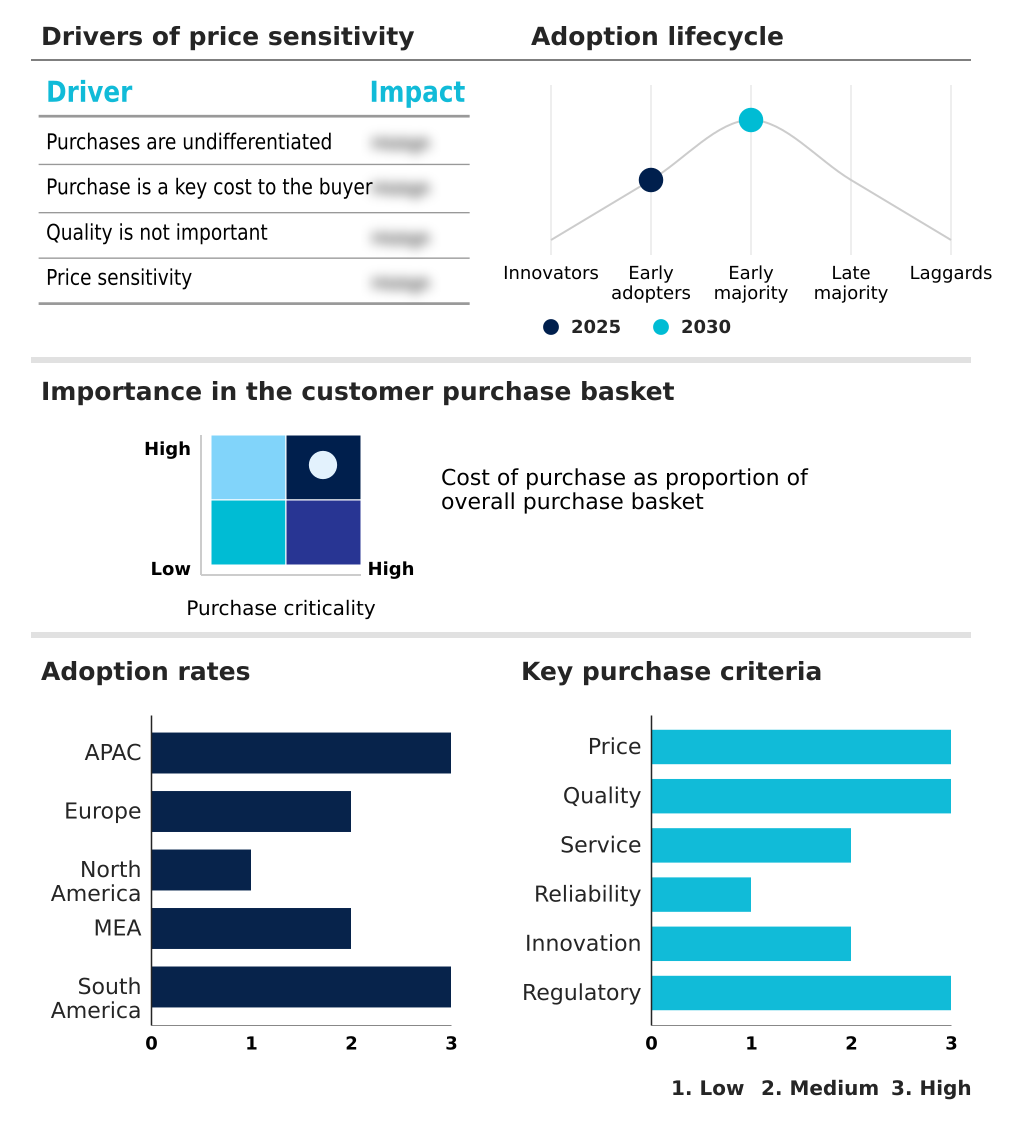
Exclusive Technavio Analysis on Customer Landscape

The copper market forecasting report includes the adoption lifecycle of the market, covering from the innovator’s stage to the laggard’s stage. It focuses on adoption rates in different regions based on penetration. Furthermore, the copper market report also includes key purchase criteria and drivers of price sensitivity to help companies evaluate and develop their market growth analysis strategies.

Customer Landscape of Copper Industry

Competitive Landscape

Companies are implementing various strategies, such as strategic alliances, copper market forecast, partnerships, mergers and acquisitions, geographical expansion, and product/service launches, to enhance their presence in the industry.

Aeris Resources Limited - Analysis indicates a focus on producing copper concentrates, refined cathodes, and a diversified mining portfolio for global industrial markets.

The industry research and growth report includes detailed analyses of the competitive landscape of the market and information about key companies, including:

  • Aeris Resources Limited
  • Anglo American plc
  • Antofagasta plc
  • Aurubis AG
  • BHP Group Ltd.
  • Boliden Group
  • Capstone Copper Corp
  • Freeport McMoRan Inc.
  • Glencore Plc
  • Hindustan Copper Ltd.
  • Jiangxi Copper Corp
  • KGHM Polska Miedz
  • Lundin Mining Corp.
  • MMG Ltd.
  • Rio Tinto Ltd.
  • Sandfire Resources Limited
  • Southern Copper Corp.
  • Sumitomo Metal Mining Co. Ltd.
  • Teck Resources Ltd.
  • Vale SA

Qualitative and quantitative analysis of companies has been conducted to help clients understand the wider business environment as well as the strengths and weaknesses of key industry players. Data is qualitatively analyzed to categorize companies as pure play, category-focused, industry-focused, and diversified; it is quantitatively analyzed to categorize companies as dominant, leading, strong, tentative, and weak.

Recent Development and News in Copper market

  • In December 2025, Glencore Plc reaffirmed its copper-led growth strategy, prioritizing low-capital projects at its Katanga complex to meet long-term production goals without pursuing large-scale mergers.
  • In January 2026, BHP Group Ltd. raised its copper production guidance for the fiscal year, citing record throughput at the Escondida mine and continued development of the Vicuna project.
  • In February 2026, Anglo American plc adjusted its production outlook to align with development phases at its Collahuasi and Quellaveco sites, confirming the temporary restart of a second plant at Los Bronces.
  • In April 2026, Antofagasta plc maintained its annual targets despite lower processing rates, underscoring its focus on advancing the Centinela Second Concentrator Project.

Dive into Technavio’s robust research methodology, blending expert interviews, extensive data synthesis, and validated models for unparalleled Copper Market insights. See full methodology.

Market Scope
Page number 313
Base year 2025
Historic period 2020-2024
Forecast period 2026-2030
Growth momentum & CAGR Accelerate at a CAGR of 6.8%
Market growth 2026-2030 USD 99131.1 million
Market structure Fragmented
YoY growth 2025-2026(%) 6.4%
Key countries China, India, Japan, South Korea, Indonesia, Australia, Germany, France, UK, Italy, The Netherlands, Spain, US, Canada, Mexico, Brazil, Argentina, Colombia, Saudi Arabia, UAE, South Africa, Turkey and Israel
Competitive landscape Leading Companies, Market Positioning of Companies, Competitive Strategies, and Industry Risks

Request Free Sample

Research Analyst Overview

  • The copper market is defined by the convergence of electrification and digitalization, creating intense, sustained demand. This is occurring alongside significant supply-side pressures from declining ore grades and the high capital costs of new mine development. The industry's response involves a deep focus on operational efficiency through technologies like pyrometallurgical smelting, hydrometallurgical solvent extraction, and the SX-EW process.
  • The adoption of gearless mill drive technology, autonomous hauling fleets, and ring-geared mill drive systems is becoming standard. A key boardroom decision revolves around the strategic pivot to circularity, with secondary copper recovery and urban mining technologies offering a path to mitigate supply risks.
  • For example, secondary production can reduce energy consumption by up to 85%, a metric that directly impacts ESG compliance and profitability.
  • This dynamic underscores the importance of securing copper concentrate supply through advanced froth flotation process techniques and heap leaching technology, while producing high-purity copper cathodes and specialized materials like electrodeposited copper foil, copper-clad steel, and copper interconnects to meet the demands of smart grid infrastructure, HVDC submarine cables, and advanced 800-volt architectures.

What are the Key Data Covered in this Copper Market Research and Growth Report?

  • What is the expected growth of the Copper Market between 2026 and 2030?

    • USD 99.13 billion, at a CAGR of 6.8%

  • What segmentation does the market report cover?

    • The report is segmented by Application (Electrical and electronics, Construction, Transportation, Telecommunication, and Others), Type (Primary, and Secondary), Product Type (Wire, Tube, Flat rolled products, Rods and bars, and Foil) and Geography (APAC, Europe, North America, South America, Middle East and Africa)

  • Which regions are analyzed in the report?

    • APAC, Europe, North America, South America and Middle East and Africa

  • What are the key growth drivers and market challenges?

    • Structural grades in global primary mine production, Escalating trade protectionism and tariff regulatory complexity

  • Who are the major players in the Copper Market?

    • Aeris Resources Limited, Anglo American plc, Antofagasta plc, Aurubis AG, BHP Group Ltd., Boliden Group, Capstone Copper Corp, Freeport McMoRan Inc., Glencore Plc, Hindustan Copper Ltd., Jiangxi Copper Corp, KGHM Polska Miedz, Lundin Mining Corp., MMG Ltd., Rio Tinto Ltd., Sandfire Resources Limited, Southern Copper Corp., Sumitomo Metal Mining Co. Ltd., Teck Resources Ltd. and Vale SA

Market Research Insights

  • The market is undergoing a structural shift driven by the twin engines of decarbonization and digitalization. The transition to electric mobility, where vehicles require up to four times more copper, and the expansion of renewable energy infrastructure are creating fundamental demand.
  • This is balanced by supply-side pressures, where the adoption of secondary copper recovery is critical, offering up to 85% energy savings compared to primary extraction. However, a persistent interdisciplinary talent scarcity, cited by 77% of executives as a barrier, challenges the implementation of digital transformation in mining and autonomous haulage systems.
  • This tension between surging demand from applications like high-voltage power transmission and operational constraints from geologic disruptions and resource nationalism defines the current landscape.

We can help! Our analysts can customize this copper market research report to meet your requirements.

Get in touch

1. Executive Summary

1.1 Market overview

Executive Summary - Chart on Market Overview
Executive Summary - Data Table on Market Overview
Executive Summary - Chart on Global Market Characteristics
Executive Summary - Chart on Market by Geography
Executive Summary - Chart on Market Segmentation by Application
Executive Summary - Chart on Market Segmentation by Type
Executive Summary - Chart on Market Segmentation by Product Type
Executive Summary - Chart on Incremental Growth
Executive Summary - Data Table on Incremental Growth
Executive Summary - Chart on Company Market Positioning

2. Technavio Analysis

2.1 Analysis of price sensitivity, lifecycle, customer purchase basket, adoption rates, and purchase criteria

2.2 Criticality of inputs and Factors of differentiation

Chart on Overview on criticality of inputs and factors of differentiation

2.3 Factors of disruption

Chart on Overview on factors of disruption

2.4 Impact of drivers and challenges

Chart on Impact of drivers and challenges in 2025 and 2030

3. Market Landscape

3.1 Market ecosystem

Chart on Parent Market
Data Table on - Parent Market

3.2 Market characteristics

Chart on Market characteristics analysis

3.3 Value chain analysis

Chart on Value chain analysis

4. Market Sizing

4.1 Market definition

Data Table on Offerings of companies included in the market definition

4.2 Market segment analysis

Market segments

4.3 Market size 2025

4.4 Market outlook: Forecast for 2025-2030

Chart on Global - Market size and forecast 2025-2030 ($ million)
Data Table on Global - Market size and forecast 2025-2030 ($ million)
Chart on Global Market: Year-over-year growth 2025-2030 (%)
Data Table on Global Market: Year-over-year growth 2025-2030 (%)

5. Historic Market Size

5.1 Global Copper Market 2020 - 2024

Historic Market Size - Data Table on Global Copper Market 2020 - 2024 ($ million)

5.2 Application segment analysis 2020 - 2024

Historic Market Size - Application Segment 2020 - 2024 ($ million)

5.3 Type segment analysis 2020 - 2024

Historic Market Size - Type Segment 2020 - 2024 ($ million)

5.4 Product Type segment analysis 2020 - 2024

Historic Market Size - Product Type Segment 2020 - 2024 ($ million)

5.5 Geography segment analysis 2020 - 2024

Historic Market Size - Geography Segment 2020 - 2024 ($ million)

5.6 Country segment analysis 2020 - 2024

Historic Market Size - Country Segment 2020 - 2024 ($ million)

6. Qualitative Analysis

6.1 Impact of AI in global copper market

6.2 Impact of geopolitical conflict on global copper market

7. Five Forces Analysis

7.1 Five forces summary

Five forces analysis - Comparison between 2025 and 2030

7.2 Bargaining power of buyers

Bargaining power of buyers - Impact of key factors 2025 and 2030

7.3 Bargaining power of suppliers

Bargaining power of suppliers - Impact of key factors in 2025 and 2030

7.4 Threat of new entrants

Threat of new entrants - Impact of key factors in 2025 and 2030

7.5 Threat of substitutes

Threat of substitutes - Impact of key factors in 2025 and 2030

7.6 Threat of rivalry

Threat of rivalry - Impact of key factors in 2025 and 2030

7.7 Market condition

Chart on Market condition - Five forces 2025 and 2030

8. Market Segmentation by Application

8.1 Market segments

Chart on Application - Market share 2025-2030 (%)
Data Table on Application - Market share 2025-2030 (%)

8.2 Comparison by Application

Chart on Comparison by Application
Data Table on Comparison by Application

8.3 Electrical and electronics - Market size and forecast 2025-2030

Chart on Electrical and electronics - Market size and forecast 2025-2030 ($ million)
Data Table on Electrical and electronics - Market size and forecast 2025-2030 ($ million)
Chart on Electrical and electronics - Year-over-year growth 2025-2030 (%)
Data Table on Electrical and electronics - Year-over-year growth 2025-2030 (%)

8.4 Construction - Market size and forecast 2025-2030

Chart on Construction - Market size and forecast 2025-2030 ($ million)
Data Table on Construction - Market size and forecast 2025-2030 ($ million)
Chart on Construction - Year-over-year growth 2025-2030 (%)
Data Table on Construction - Year-over-year growth 2025-2030 (%)

8.5 Transportation - Market size and forecast 2025-2030

Chart on Transportation - Market size and forecast 2025-2030 ($ million)
Data Table on Transportation - Market size and forecast 2025-2030 ($ million)
Chart on Transportation - Year-over-year growth 2025-2030 (%)
Data Table on Transportation - Year-over-year growth 2025-2030 (%)

8.6 Telecommunication - Market size and forecast 2025-2030

Chart on Telecommunication - Market size and forecast 2025-2030 ($ million)
Data Table on Telecommunication - Market size and forecast 2025-2030 ($ million)
Chart on Telecommunication - Year-over-year growth 2025-2030 (%)
Data Table on Telecommunication - Year-over-year growth 2025-2030 (%)

8.7 Others - Market size and forecast 2025-2030

Chart on Others - Market size and forecast 2025-2030 ($ million)
Data Table on Others - Market size and forecast 2025-2030 ($ million)
Chart on Others - Year-over-year growth 2025-2030 (%)
Data Table on Others - Year-over-year growth 2025-2030 (%)

8.8 Market opportunity by Application

Market opportunity by Application ($ million)
Data Table on Market opportunity by Application ($ million)

9. Market Segmentation by Type

9.1 Market segments

Chart on Type - Market share 2025-2030 (%)
Data Table on Type - Market share 2025-2030 (%)

9.2 Comparison by Type

Chart on Comparison by Type
Data Table on Comparison by Type

9.3 Primary - Market size and forecast 2025-2030

Chart on Primary - Market size and forecast 2025-2030 ($ million)
Data Table on Primary - Market size and forecast 2025-2030 ($ million)
Chart on Primary - Year-over-year growth 2025-2030 (%)
Data Table on Primary - Year-over-year growth 2025-2030 (%)

9.4 Secondary - Market size and forecast 2025-2030

Chart on Secondary - Market size and forecast 2025-2030 ($ million)
Data Table on Secondary - Market size and forecast 2025-2030 ($ million)
Chart on Secondary - Year-over-year growth 2025-2030 (%)
Data Table on Secondary - Year-over-year growth 2025-2030 (%)

9.5 Market opportunity by Type

Market opportunity by Type ($ million)
Data Table on Market opportunity by Type ($ million)

10. Market Segmentation by Product Type

10.1 Market segments

Chart on Product Type - Market share 2025-2030 (%)
Data Table on Product Type - Market share 2025-2030 (%)

10.2 Comparison by Product Type

Chart on Comparison by Product Type
Data Table on Comparison by Product Type

10.3 Wire - Market size and forecast 2025-2030

Chart on Wire - Market size and forecast 2025-2030 ($ million)
Data Table on Wire - Market size and forecast 2025-2030 ($ million)
Chart on Wire - Year-over-year growth 2025-2030 (%)
Data Table on Wire - Year-over-year growth 2025-2030 (%)

10.4 Tube - Market size and forecast 2025-2030

Chart on Tube - Market size and forecast 2025-2030 ($ million)
Data Table on Tube - Market size and forecast 2025-2030 ($ million)
Chart on Tube - Year-over-year growth 2025-2030 (%)
Data Table on Tube - Year-over-year growth 2025-2030 (%)

10.5 Flat rolled products - Market size and forecast 2025-2030

Chart on Flat rolled products - Market size and forecast 2025-2030 ($ million)
Data Table on Flat rolled products - Market size and forecast 2025-2030 ($ million)
Chart on Flat rolled products - Year-over-year growth 2025-2030 (%)
Data Table on Flat rolled products - Year-over-year growth 2025-2030 (%)

10.6 Rods and bars - Market size and forecast 2025-2030

Chart on Rods and bars - Market size and forecast 2025-2030 ($ million)
Data Table on Rods and bars - Market size and forecast 2025-2030 ($ million)
Chart on Rods and bars - Year-over-year growth 2025-2030 (%)
Data Table on Rods and bars - Year-over-year growth 2025-2030 (%)

10.7 Foil - Market size and forecast 2025-2030

Chart on Foil - Market size and forecast 2025-2030 ($ million)
Data Table on Foil - Market size and forecast 2025-2030 ($ million)
Chart on Foil - Year-over-year growth 2025-2030 (%)
Data Table on Foil - Year-over-year growth 2025-2030 (%)

10.8 Market opportunity by Product Type

Market opportunity by Product Type ($ million)
Data Table on Market opportunity by Product Type ($ million)

11. Customer Landscape

11.1 Customer landscape overview

Analysis of price sensitivity, lifecycle, customer purchase basket, adoption rates, and purchase criteria

12. Geographic Landscape

12.1 Geographic segmentation

Chart on Market share by geography 2025-2030 (%)
Data Table on Market share by geography 2025-2030 (%)

12.2 Geographic comparison

Chart on Geographic comparison
Data Table on Geographic comparison

12.3 APAC - Market size and forecast 2025-2030

Chart on APAC - Market size and forecast 2025-2030 ($ million)
Data Table on APAC - Market size and forecast 2025-2030 ($ million)
Chart on APAC - Year-over-year growth 2025-2030 (%)
Data Table on APAC - Year-over-year growth 2025-2030 (%)
Chart on Regional Comparison - APAC
Data Table on Regional Comparison - APAC

12.3.1 China - Market size and forecast 2025-2030

Chart on China - Market size and forecast 2025-2030 ($ million)
Data Table on China - Market size and forecast 2025-2030 ($ million)
Chart on China - Year-over-year growth 2025-2030 (%)
Data Table on China - Year-over-year growth 2025-2030 (%)

12.3.2 India - Market size and forecast 2025-2030

Chart on India - Market size and forecast 2025-2030 ($ million)
Data Table on India - Market size and forecast 2025-2030 ($ million)
Chart on India - Year-over-year growth 2025-2030 (%)
Data Table on India - Year-over-year growth 2025-2030 (%)

12.3.3 Japan - Market size and forecast 2025-2030

Chart on Japan - Market size and forecast 2025-2030 ($ million)
Data Table on Japan - Market size and forecast 2025-2030 ($ million)
Chart on Japan - Year-over-year growth 2025-2030 (%)
Data Table on Japan - Year-over-year growth 2025-2030 (%)

12.3.4 South Korea - Market size and forecast 2025-2030

Chart on South Korea - Market size and forecast 2025-2030 ($ million)
Data Table on South Korea - Market size and forecast 2025-2030 ($ million)
Chart on South Korea - Year-over-year growth 2025-2030 (%)
Data Table on South Korea - Year-over-year growth 2025-2030 (%)

12.3.5 Indonesia - Market size and forecast 2025-2030

Chart on Indonesia - Market size and forecast 2025-2030 ($ million)
Data Table on Indonesia - Market size and forecast 2025-2030 ($ million)
Chart on Indonesia - Year-over-year growth 2025-2030 (%)
Data Table on Indonesia - Year-over-year growth 2025-2030 (%)

12.3.6 Australia - Market size and forecast 2025-2030

Chart on Australia - Market size and forecast 2025-2030 ($ million)
Data Table on Australia - Market size and forecast 2025-2030 ($ million)
Chart on Australia - Year-over-year growth 2025-2030 (%)
Data Table on Australia - Year-over-year growth 2025-2030 (%)

12.4 Europe - Market size and forecast 2025-2030

Chart on Europe - Market size and forecast 2025-2030 ($ million)
Data Table on Europe - Market size and forecast 2025-2030 ($ million)
Chart on Europe - Year-over-year growth 2025-2030 (%)
Data Table on Europe - Year-over-year growth 2025-2030 (%)
Chart on Regional Comparison - Europe
Data Table on Regional Comparison - Europe

12.4.1 Germany - Market size and forecast 2025-2030

Chart on Germany - Market size and forecast 2025-2030 ($ million)
Data Table on Germany - Market size and forecast 2025-2030 ($ million)
Chart on Germany - Year-over-year growth 2025-2030 (%)
Data Table on Germany - Year-over-year growth 2025-2030 (%)

12.4.2 France - Market size and forecast 2025-2030

Chart on France - Market size and forecast 2025-2030 ($ million)
Data Table on France - Market size and forecast 2025-2030 ($ million)
Chart on France - Year-over-year growth 2025-2030 (%)
Data Table on France - Year-over-year growth 2025-2030 (%)

12.4.3 UK - Market size and forecast 2025-2030

Chart on UK - Market size and forecast 2025-2030 ($ million)
Data Table on UK - Market size and forecast 2025-2030 ($ million)
Chart on UK - Year-over-year growth 2025-2030 (%)
Data Table on UK - Year-over-year growth 2025-2030 (%)

12.4.4 Italy - Market size and forecast 2025-2030

Chart on Italy - Market size and forecast 2025-2030 ($ million)
Data Table on Italy - Market size and forecast 2025-2030 ($ million)
Chart on Italy - Year-over-year growth 2025-2030 (%)
Data Table on Italy - Year-over-year growth 2025-2030 (%)

12.4.5 The Netherlands - Market size and forecast 2025-2030

Chart on The Netherlands - Market size and forecast 2025-2030 ($ million)
Data Table on The Netherlands - Market size and forecast 2025-2030 ($ million)
Chart on The Netherlands - Year-over-year growth 2025-2030 (%)
Data Table on The Netherlands - Year-over-year growth 2025-2030 (%)

12.4.6 Spain - Market size and forecast 2025-2030

Chart on Spain - Market size and forecast 2025-2030 ($ million)
Data Table on Spain - Market size and forecast 2025-2030 ($ million)
Chart on Spain - Year-over-year growth 2025-2030 (%)
Data Table on Spain - Year-over-year growth 2025-2030 (%)

12.5 North America - Market size and forecast 2025-2030

Chart on North America - Market size and forecast 2025-2030 ($ million)
Data Table on North America - Market size and forecast 2025-2030 ($ million)
Chart on North America - Year-over-year growth 2025-2030 (%)
Data Table on North America - Year-over-year growth 2025-2030 (%)
Chart on Regional Comparison - North America
Data Table on Regional Comparison - North America

12.5.1 US - Market size and forecast 2025-2030

Chart on US - Market size and forecast 2025-2030 ($ million)
Data Table on US - Market size and forecast 2025-2030 ($ million)
Chart on US - Year-over-year growth 2025-2030 (%)
Data Table on US - Year-over-year growth 2025-2030 (%)

12.5.2 Canada - Market size and forecast 2025-2030

Chart on Canada - Market size and forecast 2025-2030 ($ million)
Data Table on Canada - Market size and forecast 2025-2030 ($ million)
Chart on Canada - Year-over-year growth 2025-2030 (%)
Data Table on Canada - Year-over-year growth 2025-2030 (%)

12.5.3 Mexico - Market size and forecast 2025-2030

Chart on Mexico - Market size and forecast 2025-2030 ($ million)
Data Table on Mexico - Market size and forecast 2025-2030 ($ million)
Chart on Mexico - Year-over-year growth 2025-2030 (%)
Data Table on Mexico - Year-over-year growth 2025-2030 (%)

12.6 South America - Market size and forecast 2025-2030

Chart on South America - Market size and forecast 2025-2030 ($ million)
Data Table on South America - Market size and forecast 2025-2030 ($ million)
Chart on South America - Year-over-year growth 2025-2030 (%)
Data Table on South America - Year-over-year growth 2025-2030 (%)
Chart on Regional Comparison - South America
Data Table on Regional Comparison - South America

12.6.1 Brazil - Market size and forecast 2025-2030

Chart on Brazil - Market size and forecast 2025-2030 ($ million)
Data Table on Brazil - Market size and forecast 2025-2030 ($ million)
Chart on Brazil - Year-over-year growth 2025-2030 (%)
Data Table on Brazil - Year-over-year growth 2025-2030 (%)

12.6.2 Argentina - Market size and forecast 2025-2030

Chart on Argentina - Market size and forecast 2025-2030 ($ million)
Data Table on Argentina - Market size and forecast 2025-2030 ($ million)
Chart on Argentina - Year-over-year growth 2025-2030 (%)
Data Table on Argentina - Year-over-year growth 2025-2030 (%)

12.6.3 Colombia - Market size and forecast 2025-2030

Chart on Colombia - Market size and forecast 2025-2030 ($ million)
Data Table on Colombia - Market size and forecast 2025-2030 ($ million)
Chart on Colombia - Year-over-year growth 2025-2030 (%)
Data Table on Colombia - Year-over-year growth 2025-2030 (%)

12.7 Middle East and Africa - Market size and forecast 2025-2030

Chart on Middle East and Africa - Market size and forecast 2025-2030 ($ million)
Data Table on Middle East and Africa - Market size and forecast 2025-2030 ($ million)
Chart on Middle East and Africa - Year-over-year growth 2025-2030 (%)
Data Table on Middle East and Africa - Year-over-year growth 2025-2030 (%)
Chart on Regional Comparison - Middle East and Africa
Data Table on Regional Comparison - Middle East and Africa

12.7.1 Saudi Arabia - Market size and forecast 2025-2030

Chart on Saudi Arabia - Market size and forecast 2025-2030 ($ million)
Data Table on Saudi Arabia - Market size and forecast 2025-2030 ($ million)
Chart on Saudi Arabia - Year-over-year growth 2025-2030 (%)
Data Table on Saudi Arabia - Year-over-year growth 2025-2030 (%)

12.7.2 UAE - Market size and forecast 2025-2030

Chart on UAE - Market size and forecast 2025-2030 ($ million)
Data Table on UAE - Market size and forecast 2025-2030 ($ million)
Chart on UAE - Year-over-year growth 2025-2030 (%)
Data Table on UAE - Year-over-year growth 2025-2030 (%)

12.7.3 South Africa - Market size and forecast 2025-2030

Chart on South Africa - Market size and forecast 2025-2030 ($ million)
Data Table on South Africa - Market size and forecast 2025-2030 ($ million)
Chart on South Africa - Year-over-year growth 2025-2030 (%)
Data Table on South Africa - Year-over-year growth 2025-2030 (%)

12.7.4 Turkey - Market size and forecast 2025-2030

Chart on Turkey - Market size and forecast 2025-2030 ($ million)
Data Table on Turkey - Market size and forecast 2025-2030 ($ million)
Chart on Turkey - Year-over-year growth 2025-2030 (%)
Data Table on Turkey - Year-over-year growth 2025-2030 (%)

12.7.5 Israel - Market size and forecast 2025-2030

Chart on Israel - Market size and forecast 2025-2030 ($ million)
Data Table on Israel - Market size and forecast 2025-2030 ($ million)
Chart on Israel - Year-over-year growth 2025-2030 (%)
Data Table on Israel - Year-over-year growth 2025-2030 (%)

12.8 Market opportunity by geography

Market opportunity by geography ($ million)
Data Tables on Market opportunity by geography ($ million)

13. Drivers, Challenges, and Opportunity

13.1 Market drivers

Structural grades in global primary mine production
Electrification of global transportation and mobility sector
Decarbonization imperatives and accelerated global grid modernization

13.2 Market challenges

Escalating trade protectionism and tariff regulatory complexity
Interdisciplinary talent scarcity and technological integration hurdles
Structural supply imbalances and acute geologic disruptions

13.3 Impact of drivers and challenges

Impact of drivers and challenges in 2025 and 2030

13.4 Market opportunities

Structural deficit and strategic national stockpiling
Shift toward zero-margin smelting benchmarks
Transition toward high-efficiency mineral processing technologies

14. Competitive Landscape

14.1 Overview

14.2

Overview on criticality of inputs and factors of differentiation

14.3 Landscape disruption

Overview on factors of disruption

14.4 Industry risks

Impact of key risks on business

15. Competitive Analysis

15.1 Companies profiled

Companies covered

15.2 Company ranking index

15.3 Market positioning of companies

Matrix on companies position and classification

15.4 Anglo American plc

Anglo American plc - Overview
Anglo American plc - Business segments
Anglo American plc - Key offerings
Anglo American plc - Segment focus
SWOT

15.5 Aurubis AG

Aurubis AG - Overview
Aurubis AG - Business segments
Aurubis AG - Key news
Aurubis AG - Key offerings
Aurubis AG - Segment focus
SWOT

15.6 BHP Group Ltd.

BHP Group Ltd. - Overview
BHP Group Ltd. - Business segments
BHP Group Ltd. - Key offerings
BHP Group Ltd. - Segment focus
SWOT

15.7 Boliden Group

Boliden Group - Overview
Boliden Group - Product / Service
Boliden Group - Key offerings
SWOT

15.8 Freeport McMoRan Inc.

Freeport McMoRan Inc. - Overview
Freeport McMoRan Inc. - Business segments
Freeport McMoRan Inc. - Key offerings
Freeport McMoRan Inc. - Segment focus
SWOT

15.9 Glencore Plc

Glencore Plc - Overview
Glencore Plc - Business segments
Glencore Plc - Key offerings
Glencore Plc - Segment focus
SWOT

15.10 Hindustan Copper Ltd.

Hindustan Copper Ltd. - Overview
Hindustan Copper Ltd. - Business segments
Hindustan Copper Ltd. - Key offerings
Hindustan Copper Ltd. - Segment focus
SWOT

15.11 Jiangxi Copper Corp

Jiangxi Copper Corp - Overview
Jiangxi Copper Corp - Business segments
Jiangxi Copper Corp - Key offerings
Jiangxi Copper Corp - Segment focus
SWOT

15.12 KGHM Polska Miedz

KGHM Polska Miedz - Overview
KGHM Polska Miedz - Business segments
KGHM Polska Miedz - Key offerings
KGHM Polska Miedz - Segment focus
SWOT

15.13 Lundin Mining Corp.

Lundin Mining Corp. - Overview
Lundin Mining Corp. - Product / Service
Lundin Mining Corp. - Key offerings
SWOT

15.14 MMG Ltd.

MMG Ltd. - Overview
MMG Ltd. - Business segments
MMG Ltd. - Key offerings
MMG Ltd. - Segment focus
SWOT

15.15 Rio Tinto Ltd.

Rio Tinto Ltd. - Overview
Rio Tinto Ltd. - Business segments
Rio Tinto Ltd. - Key news
Rio Tinto Ltd. - Key offerings
Rio Tinto Ltd. - Segment focus
SWOT

15.16 Sumitomo Metal Mining Co. Ltd.

Sumitomo Metal Mining Co. Ltd. - Overview
Sumitomo Metal Mining Co. Ltd. - Business segments
Sumitomo Metal Mining Co. Ltd. - Key offerings
Sumitomo Metal Mining Co. Ltd. - Segment focus
SWOT

15.17 Teck Resources Ltd.

Teck Resources Ltd. - Overview
Teck Resources Ltd. - Business segments
Teck Resources Ltd. - Key offerings
Teck Resources Ltd. - Segment focus
SWOT

15.18 Vale SA

Vale SA - Overview
Vale SA - Business segments
Vale SA - Key offerings
Vale SA - Segment focus
SWOT

16. Appendix

16.1 Scope of the report

Market definition
Objectives
Notes and caveats

16.2 Inclusions and exclusions checklist

Inclusions checklist
Exclusions checklist

16.3 Currency conversion rates for US$

16.4 Research methodology

16.5 Data procurement

Information sources

16.6 Data validation

16.7 Validation techniques employed for market sizing

16.8 Data synthesis

16.9 360 degree market analysis

16.10 List of abbreviations

Research Methodology

Technavio presents a detailed picture of the market by way of study, synthesis, and summation of data from multiple sources. The analysts have presented the various facets of the market with a particular focus on identifying the key industry influencers. The data thus presented is comprehensive, reliable, and the result of extensive research, both primary and secondary.

INFORMATION SOURCES

Primary sources

  • Manufacturers and suppliers
  • Channel partners
  • Industry experts
  • Strategic decision makers

Secondary sources

  • Industry journals and periodicals
  • Government data
  • Financial reports of key industry players
  • Historical data
  • Press releases

DATA ANALYSIS

Data Synthesis

  • Collation of data
  • Estimation of key figures
  • Analysis of derived insights

Data Validation

  • Triangulation with data models
  • Reference against proprietary databases
  • Corroboration with industry experts

REPORT WRITING

Qualitative

  • Market drivers
  • Market challenges
  • Market trends
  • Five forces analysis

Quantitative

  • Market size and forecast
  • Market segmentation
  • Geographical insights
  • Competitive landscape

Interested in this report?

Get your sample now to see our research methodology and insights!

Download Now

Frequently Asked Questions

Copper market growth will increase by USD 99131.1 million during 2026-2030.

The Copper market is expected to grow at a CAGR of 6.8% during 2026-2030.

Copper market is segmented by Application (Electrical and electronics, Construction, Transportation, Telecommunication, Others) Type (Primary, Secondary) Product type (Wire, Tube, Flat rolled products, Rods and bars, Foil)

Aeris Resources Limited, Anglo American plc, Antofagasta plc, Aurubis AG, BHP Group Ltd., Boliden Group, Capstone Copper Corp, Freeport McMoRan Inc., Glencore Plc, Hindustan Copper Ltd., Jiangxi Copper Corp, KGHM Polska Miedz, Lundin Mining Corp., MMG Ltd., Rio Tinto Ltd., Sandfire Resources Limited, Southern Copper Corp., Sumitomo Metal Mining Co. Ltd., Teck Resources Ltd., Vale SA are a few of the key vendors in the Copper market.

APAC will register the highest growth rate of 70.8% among the other regions. Therefore, the Copper market in APAC is expected to garner significant business opportunities for the vendors during the forecast period.

China, India, Japan, South Korea, Indonesia, Australia, Germany, France, UK, Italy, The Netherlands, Spain, US, Canada, Mexico, Brazil, Argentina, Colombia, Saudi Arabia, UAE, South Africa, Turkey, Israel

  • Structural grades in global primary mine production is the driving factor this market.

The Copper market vendors should focus on grabbing business opportunities from the Application segment as it accounted for the largest market share in the base year.
RIA - Research AI Assistant
Ask RIA