Copper Wire Market Size 2025-2029
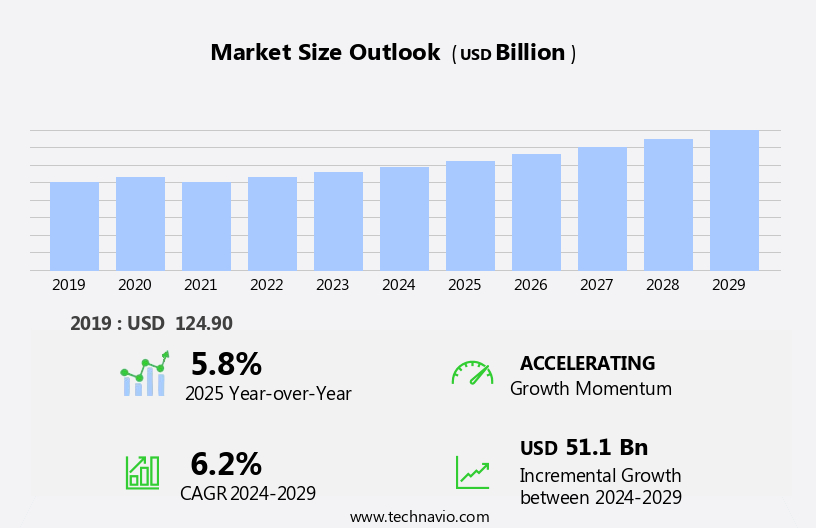
The copper wire market size is forecast to increase by USD 51.1 billion, at a CAGR of 6.2% between 2024 and 2029. The market is experiencing significant growth due to the expanding communication and electrical and electronics industries. The increasing demand for advanced connectivity solutions and the proliferation of digital devices are driving the need for more copper wires.
Major Market Trends & Insights
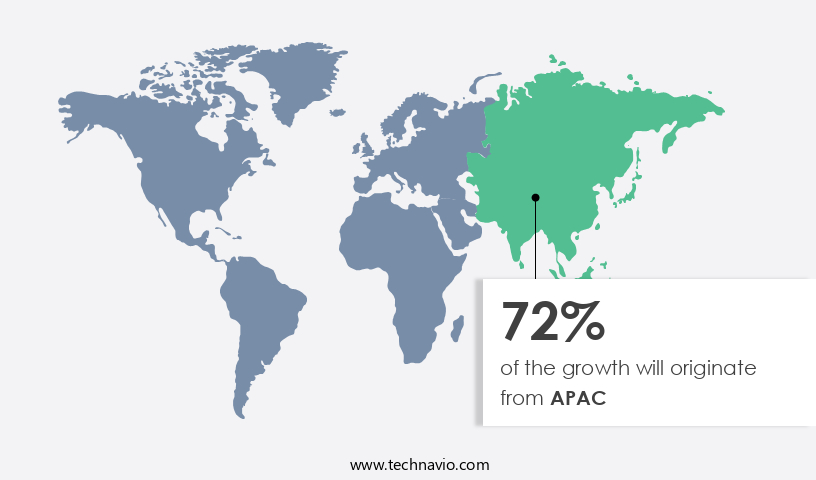
- APAC dominated the market and contributed 72% to the growth during the forecast period.
- The market is expected to grow significantly in Europe region as well over the forecast period.
- Based on the Type, the low voltage segment led the market and was valued at USD 63.40 billion of the global revenue in 2023.
- Based on the End-user, the electrical and electronics segment accounted for the largest market revenue share in 2023.
Market Size & Forecast
- Market Opportunities: USD 58.13 Billion
- Future Opportunities: USD 51.11 Billion
- CAGR (2024-2029): 6.2%
- APAC: Largest market in 2023
Moreover, the transition towards renewable energy sources is contributing to the market's growth, as copper wires are essential components in solar panels and wind turbines. However, the market faces challenges from strict air quality standards for copper smelters. These regulations aim to reduce emissions and improve environmental sustainability, leading to increased operational costs for copper wire manufacturers. Companies in the copper wire industry must navigate these challenges by investing in innovative technologies and adhering to regulatory requirements to remain competitive and capitalize on the market's opportunities.
What will be the Size of the Copper Wire Market during the forecast period?
Explore in-depth regional segment analysis with market size data - historical 2019-2023 and forecasts 2025-2029 - in the full report.
Request Free Sample
The market continues to evolve, driven by the diverse applications across various sectors. In the realm of electronics, copper wire plays a pivotal role in coil winding processes for printed circuit boards and magnet wire enameling. Copper's high conductivity makes it an ideal choice for electrical motor windings, where the copper wire diameter and gauge significantly impact performance. Stranded copper wire, with its enhanced flexibility, is essential in wire harness design for automobiles and the aviation industries. Copper's electrical resistance properties are crucial in transformer construction and power transmission lines. Oxygen-free copper wire, with its enhanced electrical conductivity, is increasingly used in high-performance applications.
The copper wire manufacturing process includes copper wire coating, spooling, and stripping. Advanced techniques like annealing, tinning, and litze wire construction contribute to improved copper wire properties, such as elongation and electromagnetic shielding. Recycling copper wire is a significant trend, with the industry expecting a 5% annual growth rate. For instance, a leading automotive manufacturer reduced its carbon footprint by 15% by implementing a copper wire recycling program. The continuous unfolding of market activities and evolving patterns underscores the dynamic nature of the market.
How is this Copper Wire Industry segmented?
The copper wire industry research report provides comprehensive data (region-wise segment analysis), with forecasts and estimates in "USD billion" for the period 2025-2029, as well as historical data from 2019-2023 for the following segments.
- Type
- Low voltage
- Medium voltage
- High voltage
- End-user
- Electrical and electronics
- Building and construction
- Telecommunication
- Transportation
- Others
- Application
- Power Transmission
- Telecommunications
- Building Wiring
- Renewable Energy Systems
- Geography
- North America
- US
- Canada
- Europe
- France
- Germany
- Italy
- UK
- APAC
- China
- India
- Japan
- South Korea
- Rest of World (ROW)
- North America
By Type Insights
The low voltage segment is estimated to witness significant growth during the forecast period. The segment was valued at USD 63.40 billion in 2023. It continued to the largest segment at a CAGR of 5.21%.
Low voltage copper wire, essential for handling voltage levels below 1,000 volts, is a key component in various sectors. In residential applications, it ensures safe and efficient electricity transmission for power distribution, lighting systems, and electrical wiring. Commercial buildings utilize low voltage copper wire for lighting fixtures, power outlets, HVAC systems, security systems, and communication networks. Industrial applications include powering machinery, motors, and control systems. Copper wire's high electrical conductivity and low resistance make it ideal for these uses. Manufacturing processes like coil winding, printed circuit board assembly, and transformer construction employ copper wire extensively. Coil winding involves winding insulated copper wire around a former to create a coil, commonly used in electrical motors and transformers.
In printed circuit board assembly, copper wire is used to create electrical connections between components. Transformer construction relies on copper wire to create the windings that facilitate the transformation of electrical energy. Copper wire comes in various forms, such as drawn copper wire, stranded copper wire, and bare copper wire. Drawn copper wire undergoes a drawing process to increase its length and reduce its diameter, while stranded copper wire consists of multiple strands of copper wire bundled together for flexibility. Bare copper wire is used in electrical wiring systems and is later insulated for protection. Copper wire manufacturing processes include coating with insulation materials like magnet wire enamel and copper wire coating, as well as copper wire spooling and wire stripping using specialized tools.
Copper wire recycling plays a crucial role in reducing waste and conserving resources. According to industry reports, the global copper wire and cable market is expected to grow by over 5% annually, driven by increasing demand for electrical infrastructure development and the growing adoption of renewable energy sources. For instance, the solar photovoltaic industry's reliance on copper wire for power transmission has led to significant growth in the market.
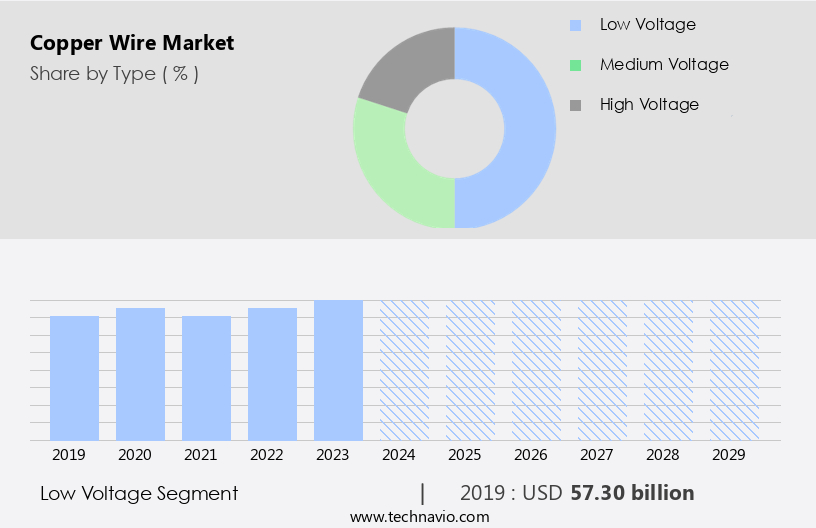
The Low voltage segment was valued at USD 57.30 billion in 2019 and showed a gradual increase during the forecast period.
Regional Analysis
APAC is estimated to contribute 72% to the growth of the global market during the forecast period. Data suggests that the future opportunities for growth in the APAC region estimates to be around USD 51.1 billion. Technavio's analysts have elaborately explained the regional trends and drivers that shape the market during the forecast period.
The market in Asia Pacific (APAC) is a significant and dynamic sector, fueled by industrialization, urbanization, infrastructure development, and the expanding electrical and electronics industry. APAC is a key consumer and manufacturer of copper wire, with China holding a dominant position in the regional market. The rapid industrialization and urbanization in China have resulted in a substantial increase in demand for copper wire, particularly in construction, power transmission, automotive, and consumer electronics sectors. Copper wire is essential in various applications, including coil winding for printed circuit boards, magnet wire enamel for electrical motor windings, and copper wire coating for insulation.
Copper wire comes in various forms, such as drawn copper wire, stranded copper wire, and bare copper wire, catering to diverse requirements. High conductivity copper and electrical resistance copper are critical for power transmission lines and transformer construction, respectively. Copper wire manufacturing involves processes like copper wire spooling and annealing, resulting in products like annealed copper wire and tinned copper wire. Copper wire recycling is an essential aspect of the industry, contributing to its sustainability and cost-effectiveness. Copper wire resistivity and electrical conductivity are crucial factors in wire harness design and electrical wiring systems. The market in APAC is expected to grow at a steady pace, with industry reports suggesting a 5% annual increase in demand.
For instance, the automotive sector in China is projected to drive the demand for copper wire in the coming years due to the increasing production of electric vehicles. Furthermore, the adoption of electromagnetic shielding and litze wire construction in various industries is expected to provide growth opportunities for copper wire manufacturers.
Market Dynamics
Our researchers analyzed the data with 2024 as the base year, along with the key drivers, trends, and challenges. A holistic analysis of drivers will help companies refine their marketing strategies to gain a competitive advantage.
The market is experiencing significant growth due to the demand for high-performance electrical components and power grids. Copper wire's thermal conductivity properties, with a low electrical resistivity temperature dependence, make it an ideal choice for various applications. In the production of copper wire, the annealing process plays a crucial role in enhancing its conductivity and tensile strength. Manufacturers prioritize measuring copper wire diameter accuracy to ensure optimal performance and efficiency. Impurities in copper wire can negatively impact conductivity, necessitating stringent quality control measures, including tensile strength testing methods. The magnet wire enamel coating process parameters are essential in producing insulated copper wires for various applications. Litz wire, a specialized construction with individually insulated strands, offers advantages such as reduced electrical resistance but has higher production costs compared to solid copper wire.
High-conductivity copper wires are extensively used in power grids and electronic components, where oxygen-free copper wire is preferred due to its superior electrical conductivity. Calculating copper wire resistance involves considering both length and diameter, while elongation limits are essential for maintaining quality during wire manufacturing processes. Hard-drawn copper wire's mechanical properties make it suitable for high-stress applications. Automation in copper wire manufacturing processes, such as spooling tension control techniques, enhances efficiency and consistency. Temperature significantly impacts copper wire properties, necessitating careful consideration in printed circuit board copper trace design and coil winding process optimization. The copper wire recycling process involves several steps, including sorting, shredding, smelting, and refining, ensuring minimal environmental impact while providing cost savings. Overall, the market continues to evolve, driven by technological advancements and increasing demand for high-performance electrical components.
The Copper Wire Market thrives on leveraging copper wire thermal conductivity properties and optimizing the annealing process copper wire production to enhance performance. Electrical resistivity temperature dependence copper and effects of impurities copper wire conductivity are critical in high conductivity copper wire applications power grids and oxygen-free copper wire use electronic components. Copper wire tensile strength testing methods and copper wire elongation limits quality control ensure reliability, while hard drawn copper wire mechanical properties suit demanding applications. Litze wire construction advantages disadvantages balance efficiency in coil winding process efficiency optimization. Copper wire manufacturing process automation, copper wire spooling tension control techniques, and copper wire recycling process steps drive sustainability, with insulated copper wire material selection guide addressing impact of temperature copper wire properties.
What are the key market drivers leading to the rise in the adoption of Copper Wire Industry?
- The communication, electrical, and electronics industries' continued growth serves as the primary market catalyst.
- Copper wires play a pivotal role in communication and electrical and electronics industries, with applications ranging from domestic subscriber lines and local area networks to mobile phones and transformers. In microprocessors, they are utilized for manufacturing circuits due to their heat-sink properties and high efficiency, enhancing processor capacity by facilitating heat dissipation from transistors. The electrical conductivity of copper makes it an ideal choice for manufacturing power cables for medium- and low voltage applications. The global electrical and electronics industry is experiencing robust growth, fueled by the escalating demand for consumer and industrial electronic products.
- According to industry reports, the market is projected to expand by approximately 5% annually over the next five years. For instance, the adoption of copper wires in renewable energy projects, such as wind and solar power, is surging, driving market growth.
What are the market trends shaping the Copper Wire Industry?
- The use of renewable energy is becoming increasingly prevalent in the market, with a growing number of installations. This trend signifies a significant shift towards sustainable energy sources.
- Copper wires hold a significant role in the renewable energy sector, with their usage extending to making electrical components for solar panels, hydroelectric motors, geothermal heat pumps, transformers, and electric cables. The superior conductivity of copper wires, which is nearly double that of aluminum wires, makes them the preferred choice for high-energy efficiency applications. The cost-effectiveness of copper wires is another factor contributing to their popularity, allowing for lower manufacturing costs in the production of solar and wind power installations.
- In the realm of photovolvoltaic (PV) systems, copper wires are indispensable. They facilitate the creation of connections within thin films designed for semiconductors, which exhibit different energy band gaps at an atomic scale. According to recent market analysis, the market is expected to witness a growth of around 5% in the upcoming year, driven by the increasing demand for renewable energy sources and the ongoing electrification trend.
What challenges does the Copper Wire Industry face during its growth?
- The copper smelting industry faces significant growth constraints due to stringent air quality regulations. These standards, which are mandatory for copper smelters, pose a significant challenge to the industry's expansion.
- The market is subject to various environmental challenges and regulatory pressures, which can impact production costs and market growth. Copper mining and extraction processes can disrupt habitats, pollute water and soil, and contribute to carbon emissions. Stricter environmental regulations and sustainability concerns have led to increased compliance costs for copper wire producers. For instance, the European Union's REACH regulation sets stringent limits on the use of certain chemicals in manufacturing processes. Moreover, copper smelting releases significant amounts of impurities, such as sulfur dioxide and arsenic, into the environment. Major copper processing countries, including the US, Japan, China, and Chile, are facing environmental challenges and stringent government regulations related to the control of these emissions.
- According to a report by the International Copper Study Group, global refined copper production is expected to grow by 3% annually between 2021 and 2025. Despite this growth, environmental concerns and regulatory pressures will continue to shape the market dynamics.
Exclusive Customer Landscape
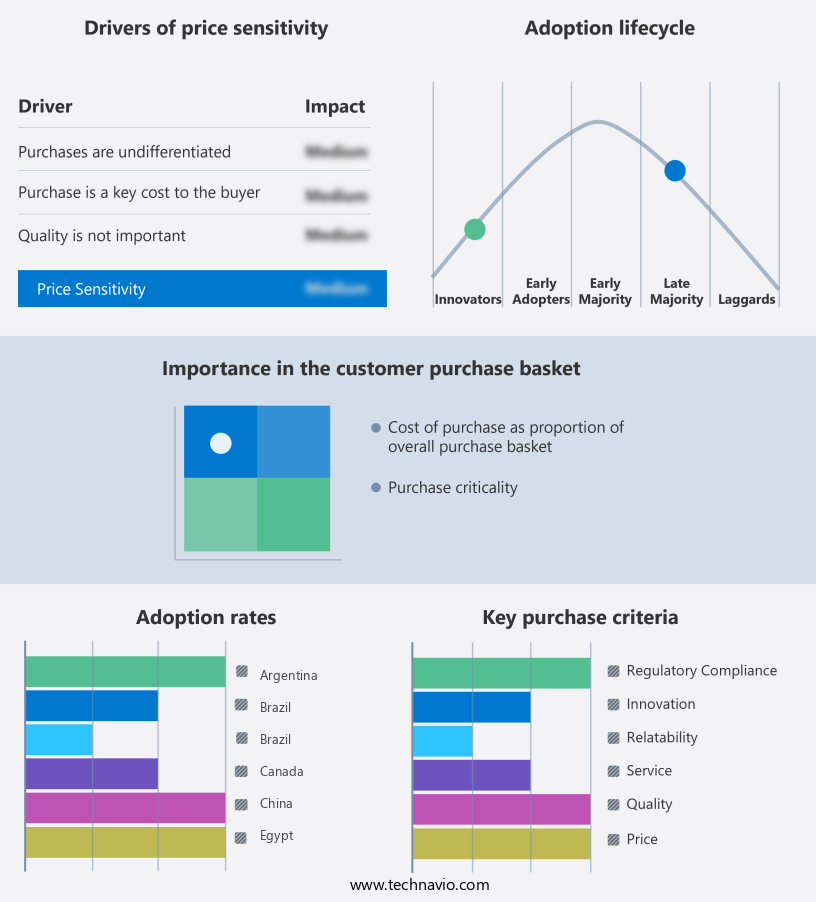
The copper wire market forecasting report includes the adoption lifecycle of the market, covering from the innovator's stage to the laggard's stage. It focuses on adoption rates in different regions based on penetration. Furthermore, the copper wire market report also includes key purchase criteria and drivers of price sensitivity to help companies evaluate and develop their market growth analysis strategies.
Customer Landscape
Key Companies & Market Insights
Companies are implementing various strategies, such as strategic alliances, copper wire market forecast, partnerships, mergers and acquisitions, geographical expansion, and product/service launches, to enhance their presence in the industry.
Alan Wire Co. - This company specializes in providing high-quality copper wire solutions, including Alan Wire type NM-B, catering to commercial, industrial, and utility market demands.
The industry research and growth report includes detailed analyses of the competitive landscape of the market and information about key companies, including:
- Alan Wire Co.
- American Wire Group
- Aviva Metals Inc.
- Belden Inc.
- CommScope Holding Company Inc.
- Elcowire Group AB
- Finolex Cables Ltd.
- Furukawa Electric Co. Ltd.
- Hindalco Industries Ltd.
- International Wire Group Inc.
- KEI Industries Ltd.
- Mitsubishi Materials Corp.
- Nexans SA
- Ningbo Jintian Copper Group Co. Ltd.
- Pacific Electric Wire and Cable Co. Ltd.
- Polycab India Ltd.
- Prysmian Group
- Schneider Electric SE
- Southwire Company
- Sumitomo Electric Industries Ltd.
Qualitative and quantitative analysis of companies has been conducted to help clients understand the wider business environment as well as the strengths and weaknesses of key industry players. Data is qualitatively analyzed to categorize companies as pure play, category-focused, industry-focused, and diversified; it is quantitatively analyzed to categorize companies as dominant, leading, strong, tentative, and weak.
Recent Development and News in Copper Wire Market
- In January 2024, South Korean copper wire manufacturer, Korea Zinc Co. Ltd., announced the launch of its new high-performance copper wire, named "SuperConductor," designed for use in renewable energy applications. The new product offers improved conductivity and durability, making it a preferred choice for wind turbine and solar panel manufacturers (Korea Zinc Co. Ltd. Press release).
- In March 2024, American copper wire producer, Olin Corporation, entered into a strategic partnership with Tesla, Inc. To supply copper wire for Tesla's expanding battery production facilities. This collaboration aimed to strengthen Olin's position in the electric vehicle market and meet Tesla's growing demand for copper wire (Olin Corporation press release).
- In May 2024, Japanese copper wire manufacturer, Nexans, completed the acquisition of German cable manufacturer, Pfeiffer Vacuum Cable GmbH. This acquisition expanded Nexans' European presence and broadened its product portfolio, allowing it to offer a more comprehensive range of copper wire solutions to its customers (Nexans press release).
- In April 2025, the European Union (EU) passed a new regulation mandating the use of recycled copper in electrical applications, effective January 2026. This policy change is expected to boost the demand for recycled copper wire and create opportunities for companies with strong recycling capabilities (European Parliament press release).
Research Analyst Overview
- The market for copper wire continues to evolve, driven by its versatility and widespread applications across various sectors. In electrical safety systems, voltage drop calculations rely on copper wire resistance to ensure reliable power distribution. Copper wire corrosion and insulation resistance are critical factors in cable integrity testing, while electrical testing of copper wires ensures safe current flow. Wire crimping tools facilitate secure wire termination methods, and copper wire connectors enable efficient wire splicing methods. Copper alloy wires offer enhanced properties for specific applications, such as gold-plated copper for high-voltage wires and silver-plated copper for low-voltage circuits.
- Wire gauge selection is crucial for optimal electrical current flow, and copper wire flexibility ensures ease of installation. Industry growth is expected to remain strong, with copper wire demand projected to increase by 5% annually due to the ongoing expansion of electrical infrastructure and the increasing adoption of renewable energy sources. For instance, a recent study revealed a 12% sales increase in copper wire used in solar panel manufacturing. Copper wire resistance plays a vital role in electrical circuit design, and the wire bonding process ensures reliable connections. Copper wire oxidation and fusing are essential considerations for wire selection and application, while grounding wire ensures electrical safety and system reliability.
Dive into Technavio's robust research methodology, blending expert interviews, extensive data synthesis, and validated models for unparalleled Copper Wire Market insights. See full methodology.
|
Market Scope |
|
|
Report Coverage |
Details |
|
Page number |
210 |
|
Base year |
2024 |
|
Historic period |
2019-2023 |
|
Forecast period |
2025-2029 |
|
Growth momentum & CAGR |
Accelerate at a CAGR of 6.2% |
|
Market growth 2025-2029 |
USD 51.1 billion |
|
Market structure |
Fragmented |
|
YoY growth 2024-2025(%) |
5.8 |
|
Key countries |
China, US, Canada, India, South Korea, Japan, UK, Germany, France, and Italy |
|
Competitive landscape |
Leading Companies, Market Positioning of Companies, Competitive Strategies, and Industry Risks |
What are the Key Data Covered in this Copper Wire Market Research and Growth Report?
- CAGR of the Copper Wire industry during the forecast period
- Detailed information on factors that will drive the growth and forecasting between 2025 and 2029
- Precise estimation of the size of the market and its contribution of the industry in focus to the parent market
- Accurate predictions about upcoming growth and trends and changes in consumer behaviour
- Growth of the market across APAC, Europe, North America, Middle East and Africa, and South America
- Thorough analysis of the market's competitive landscape and detailed information about companies
- Comprehensive analysis of factors that will challenge the copper wire market growth of industry companies
We can help! Our analysts can customize this copper wire market research report to meet your requirements.
 RIA -
RIA - 
