Wire Harness Market Analysis, Size, and Forecast 2026-2030: North America (US, Canada, and Mexico), Europe (Germany, UK, and France), APAC (China, Japan, and India), South America (Brazil, Argentina, and Colombia), Middle East and Africa (Saudi Arabia, UAE, and South Africa), and Rest of World (ROW)

Wire Harness Market Analysis, Size, and Forecast 2026-2030:
North America (US, Canada, and Mexico), Europe (Germany, UK, and France), APAC (China, Japan, and India), South America (Brazil, Argentina, and Colombia), Middle East and Africa (Saudi Arabia, UAE, and South Africa), and Rest of World (ROW)

Published: Mar 2026 320 Pages SKU: IRTNTR40441

Market Overview at a Glance

$58.44 B
Market Opportunity
7.4%
CAGR 2025 - 2030
45.8%
North America Growth
$48.21 B
Automotive segment 2024

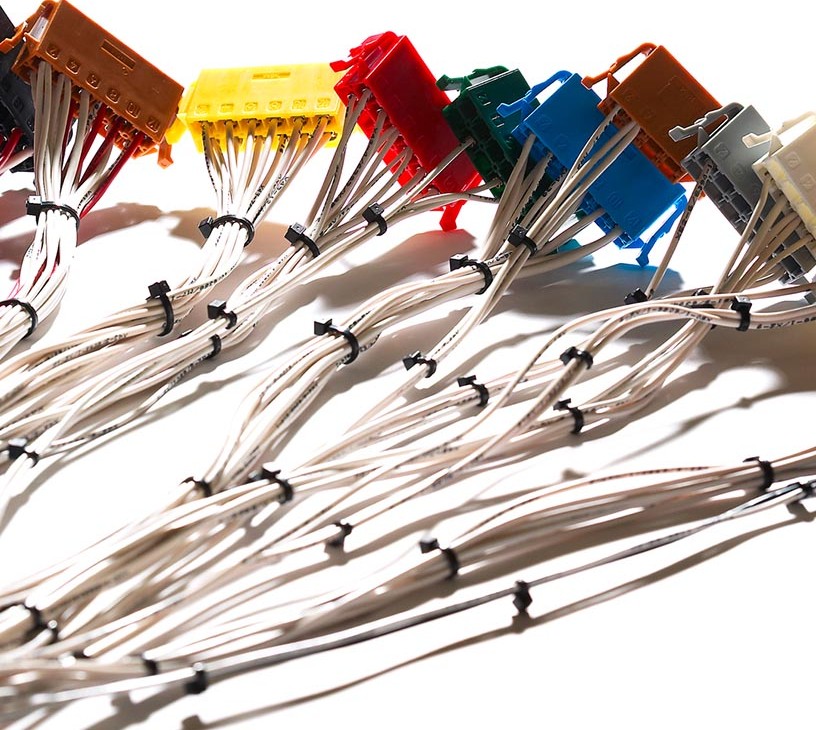
Wire Harness Market Size 2026-2030

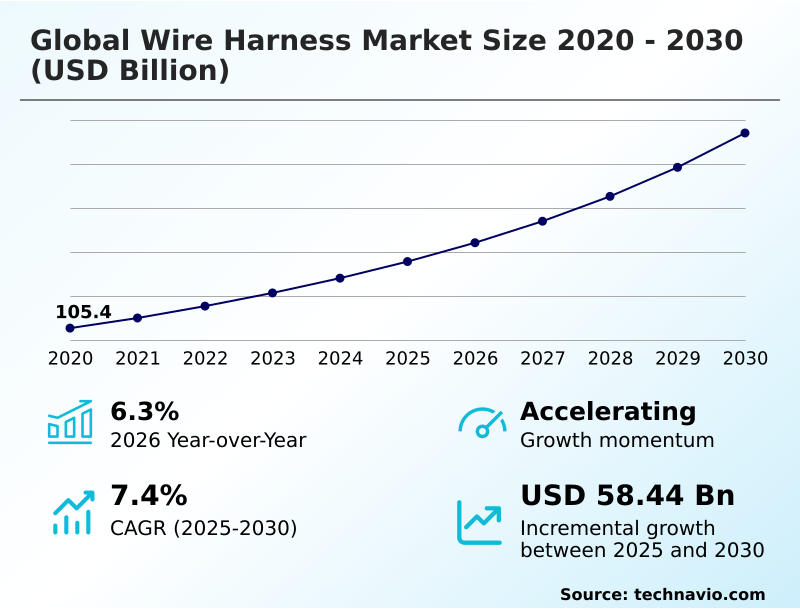
The wire harness market size is valued to increase by USD 58.44 billion, at a CAGR of 7.4% from 2025 to 2030. EV growth driving high-voltage harness ramp-up will drive the wire harness market.

Major Market Trends & Insights

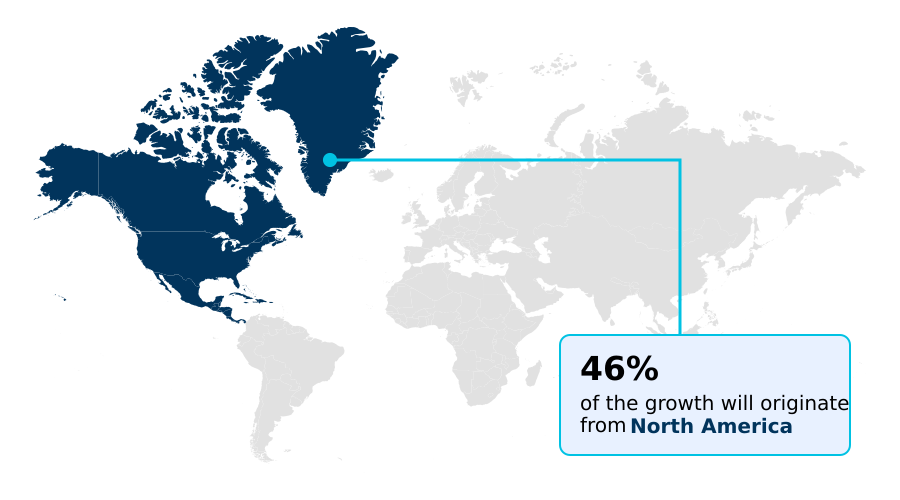
  • North America dominated the market and accounted for a 45.8% growth during the forecast period.
  • By Application - Automotive segment was valued at USD 48.21 billion in 2024
  • By Material - PVC segment accounted for the largest market revenue share in 2024

Market Size & Forecast

  • Market Opportunities: USD 88.69 billion
  • Market Future Opportunities: USD 58.44 billion
  • CAGR from 2025 to 2030 : 7.4%

Market Summary

  • The wire harness market serves as the critical nervous system for modern technology, evolving far beyond simple power delivery. Its trajectory is shaped by the immense demands of powertrain electrification, which requires robust high-voltage harness solutions capable of managing unprecedented power loads. This is complemented by a push toward miniaturized harness design for increasingly compact medical and consumer electronics.
  • However, the industry grapples with significant manufacturing complexity stemming from high degrees of wire harness customization, where bespoke designs for aerospace and industrial automation limit economies of scale.
  • For instance, a Tier-1 automotive supplier transitioning to a modular harness design for a new electric vehicle platform must re-tool its entire assembly process, integrating advanced robotics and quality control systems to handle high-flexibility cabling. This scenario highlights the balance between meeting specialized client needs and maintaining production efficiency.
  • The adoption of lightweight harness solutions and advanced materials remains a key focus to optimize performance across all sectors.

What will be the Size of the Wire Harness Market during the forecast period?

Get Key Insights on Market Forecast (PDF) Request Free Sample

How is the Wire Harness Market Segmented?

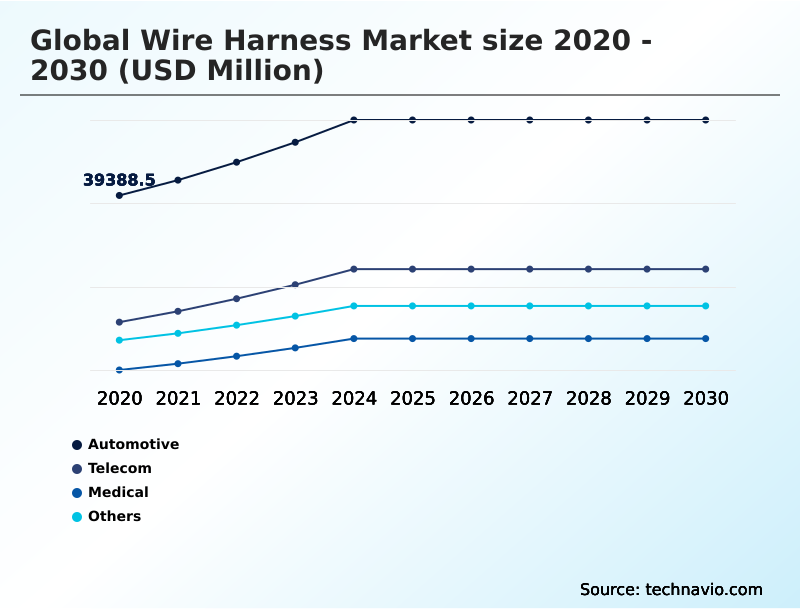
The wire harness industry research report provides comprehensive data (region-wise segment analysis), with forecasts and estimates in "USD million" for the period 2026-2030, as well as historical data from 2020-2024 for the following segments.

  • Application
    • Automotive
    • Telecom
    • Medical
    • Others
  • Material
    • PVC
    • Vinyl
    • Thermoplastic elastomer
    • Polyurethane
    • Polyethylene
  • Product type
    • Electric wires
    • Connectors
    • Terminals
    • Others
  • Type
    • Data transmission
    • Wiring
  • Geography
    • North America
      • US
      • Canada
      • Mexico
    • Europe
      • Germany
      • UK
      • France
    • APAC
      • China
      • Japan
      • India
    • South America
      • Brazil
      • Argentina
      • Colombia
    • Middle East and Africa
      • Saudi Arabia
      • UAE
      • South Africa
    • Rest of World (ROW)

By Application Insights

The automotive segment is estimated to witness significant growth during the forecast period.

The automotive segment is foundational to the wire harness market, driven by the profound shift in electrical architecture design. The transition to electric vehicle architecture necessitates complex high-voltage harness systems for powertrain electrification and advanced safety systems.

Concurrently, the integration of advanced driver-assistance systems (ADAS) requires high-bandwidth communication capabilities, pushing the boundaries of data transmission protocols.

In response, manufacturers are adopting lightweight harness solutions and modular zonal architecture, with some designs reducing physical complexity by up to 25%.

This evolution toward software-defined vehicles depends on robust signal and power solutions and specialized harness systems to ensure reliability and performance, reshaping vehicle nervous systems from the ground up.

Request Free Sample

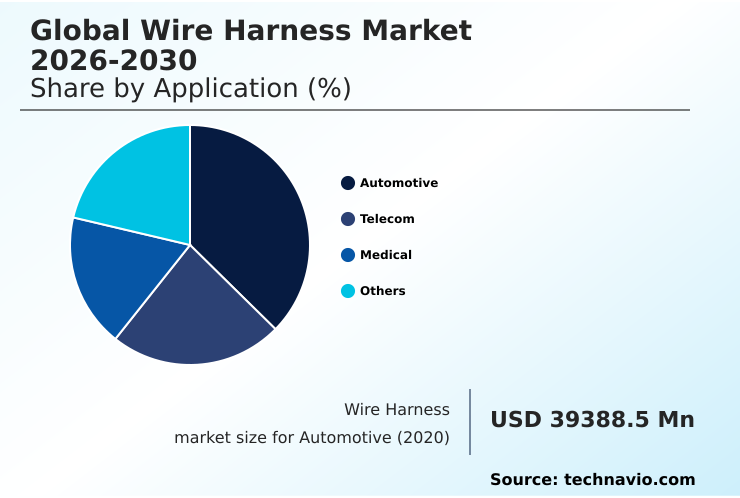
The Automotive segment was valued at USD 48.21 billion in 2024 and showed a gradual increase during the forecast period.

Request Free Sample

Regional Analysis

North America is estimated to contribute 45.8% to the growth of the global market during the forecast period.Technavio’s analysts have elaborately explained the regional trends and drivers that shape the market during the forecast period.

See How Wire Harness Market Demand is Rising in North America Request Free Sample

The global wire harness market's geographic landscape is characterized by a strategic division of labor, with APAC contributing over 45% of the market's incremental growth.

This region, particularly China, leads in volume production of components for electric vehicle architecture and consumer electronics, leveraging vast manufacturing ecosystems.

In contrast, North America and Europe are epicenters for high-value applications, focusing on advanced driver-assistance systems (ADAS) and complex aerospace wiring standards.

A notable trend is the nearshoring of production to hubs in Mexico and Eastern Europe, which enhances supply chain resilience for Western markets. For example, facilities in Mexico have demonstrated a 15% reduction in lead times for North American OEMs.

This dynamic showcases a market balancing cost-effective scale with high-tech specialization, driven by demands for everything from smart grid connectivity to specialized harness systems.

Market Dynamics

Our researchers analyzed the data with 2025 as the base year, along with the key drivers, trends, and challenges. A holistic analysis of drivers will help companies refine their marketing strategies to gain a competitive advantage.

  • The evolution of the wire harness market is increasingly defined by niche applications and advanced engineering requirements. The demand for a high-voltage harness for commercial EVs is pushing the boundaries of thermal management for EV harnesses and high-voltage connector safety standards.
  • Simultaneously, the industry-wide push for efficiency is accelerating the adoption of lightweight materials, where overcoming aluminum wire harness corrosion resistance is a key research focus. This trend towards lightweight harness for fuel efficiency is mirrored in aerospace, where every gram impacts operational costs.
  • Beyond transportation, the need for a miniaturized harness for medical devices and flexible printed circuits in consumer electronics highlights a move toward micro-scale precision. In industrial settings, a custom wire harness for industrial robotics is essential for reliable operation, while a ruggedized harness for mining equipment must withstand extreme conditions.
  • The entire production lifecycle is also being reimagined, with the automated wire harness assembly process becoming a critical differentiator. Firms that have adopted this automation report defect rates nearly half those of manual facilities. This is complemented by a focus on sustainable materials in automotive wiring, reflecting a broader commitment to a circular economy in wire harness production.
  • As systems become more complex, factors like EMI shielding for high-frequency signals, the impact of zonal architecture on harness design, and the advantages of solid-state power distribution are becoming central to innovation. The integration of technologies like fiber-optic integration in data centers and specialized EV battery management system wiring further illustrates the market's diversification.

What are the key market drivers leading to the rise in the adoption of Wire Harness Industry?

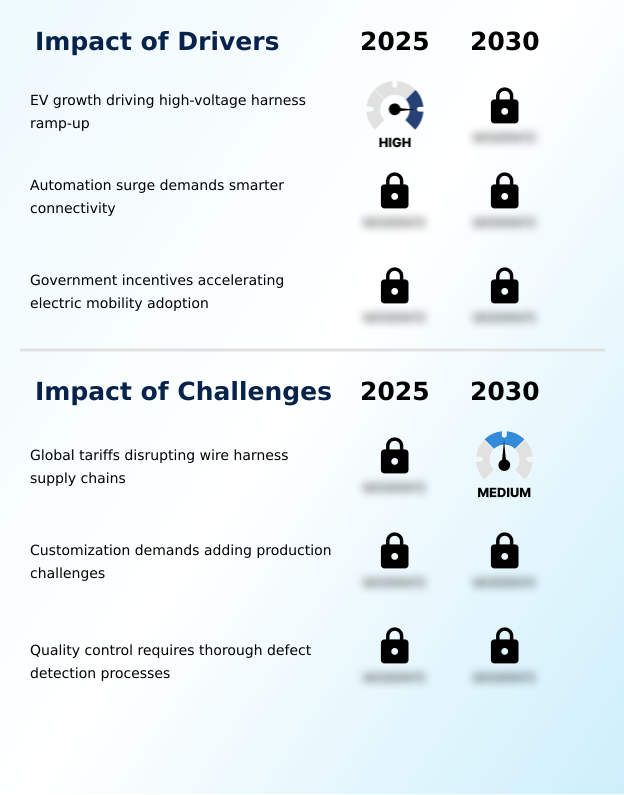
  • The accelerating growth of the electric vehicle market is a key driver, fueling a substantial ramp-up in demand for high-voltage wire harnesses.

  • The market's primary growth drivers are rooted in the electrification and automation of key global industries.
  • The ramp-up in EV charging infrastructure and powertrain electrification is a dominant force, as the wiring content in an average electric vehicle is more than double that of its internal combustion counterpart.
  • This surge requires advanced thermal management systems and robust high-voltage connectors. Concurrently, the expansion of industrial automation connectivity fuels demand for durable, high-flexibility cabling in smart factories.
  • Facilities that have upgraded to advanced industrial automation connectivity report up to a 25% increase in operational uptime.
  • These powerful drivers, spanning from automotive to industrial sectors, are accelerating innovation in both power delivery and data communication technologies, including automotive ethernet.

What are the market trends shaping the Wire Harness Industry?

  • The growing demand for compact device integration is driving a significant trend toward miniaturized harnesses. This shift addresses critical needs for space efficiency and lightweight designs in modern electronics.

  • Key market trends are reshaping wire harness design and application, driven by demands for greater efficiency and functionality. The adoption of lightweight materials is critical, with aluminum wiring solutions reducing harness mass by up to 30% compared to traditional copper, directly enhancing EV range. In parallel, the trend toward miniaturized harness design is enabling more compact and feature-rich electronics.
  • Innovations in high-density interconnects and flexible printed circuits are supporting this shift, with some high-bandwidth communication systems achieving a 40% increase in data throughput within the same physical footprint. Furthermore, there is a growing emphasis on precision engineering and the use of high-performance alloys to ensure durability in high-stress environments.
  • These trends collectively push the industry toward more sophisticated and integrated electrical systems.

What challenges does the Wire Harness Industry face during its growth?

  • Disruptions across supply chains caused by global tariffs present a key challenge to the wire harness industry's growth.

  • The wire harness market navigates significant operational challenges that impact cost and scalability. High customization requirements for applications like aerospace and industrial robotics introduce manufacturing complexity, with bespoke projects often extending development lead times by as much as 50% compared to standardized products.
  • This complexity is compounded by stringent quality control mandates, where advanced optical inspection systems are needed to achieve over 99% defect detection accuracy, thereby minimizing rework. Furthermore, volatile global tariffs disrupt intricate supply chains, affecting the cost and availability of critical components for high-voltage powertrains and data-centric vehicle architecture.
  • These hurdles necessitate a focus on modular vehicle design and resilient sourcing strategies to maintain profitability and market responsiveness.

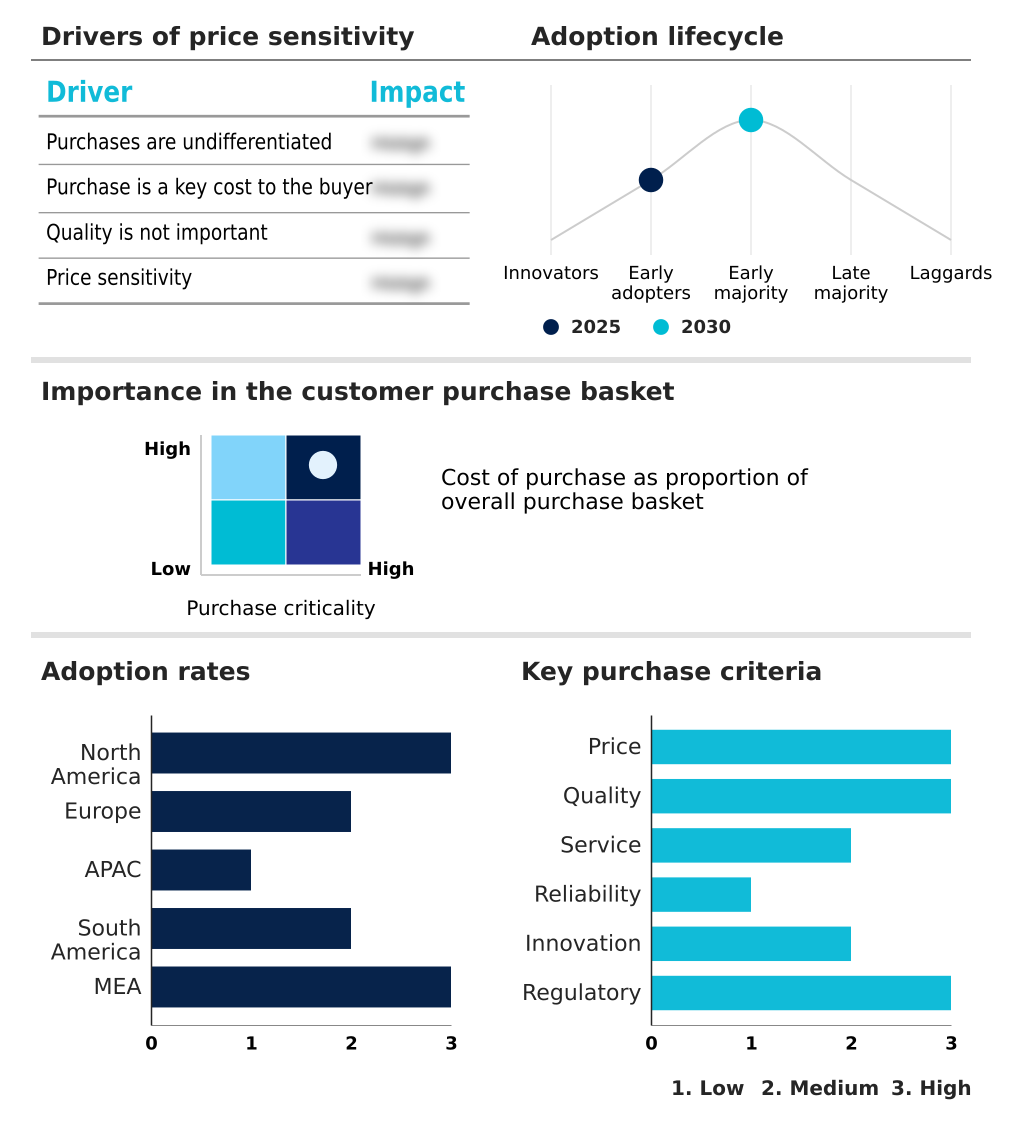
Exclusive Technavio Analysis on Customer Landscape

The wire harness market forecasting report includes the adoption lifecycle of the market, covering from the innovator’s stage to the laggard’s stage. It focuses on adoption rates in different regions based on penetration. Furthermore, the wire harness market report also includes key purchase criteria and drivers of price sensitivity to help companies evaluate and develop their market growth analysis strategies.

Customer Landscape of Wire Harness Industry

Competitive Landscape

Companies are implementing various strategies, such as strategic alliances, wire harness market forecast, partnerships, mergers and acquisitions, geographical expansion, and product/service launches, to enhance their presence in the industry.

Aptiv Plc - Offerings encompass engineered components for high-voltage power distribution, specialized data transfer, and advanced safety systems, reflecting a strategic focus on complex electrical architectures.

The industry research and growth report includes detailed analyses of the competitive landscape of the market and information about key companies, including:

  • Aptiv Plc
  • Cloom Tech
  • Coroplast
  • Dongguan Konnra Co., Ltd.
  • Fujikura Co. Ltd.
  • Furukawa Electric Co. Ltd.
  • Lear Corp.
  • Leoni AG
  • Linkwings
  • Motherson Group
  • Nexans Autoelectric Group
  • Omega Leads
  • Prysmian S.p.A
  • Sumitomo Electric Industries
  • Wiringo

Qualitative and quantitative analysis of companies has been conducted to help clients understand the wider business environment as well as the strengths and weaknesses of key industry players. Data is qualitatively analyzed to categorize companies as pure play, category-focused, industry-focused, and diversified; it is quantitatively analyzed to categorize companies as dominant, leading, strong, tentative, and weak.

Recent Development and News in Wire harness market

  • In February, 2025, Sumitomo Electric Industries announced the successful commercialization of an ultra-flexible high-voltage wire, specifically engineered to meet the tight routing constraints within compact electric vehicle battery packs.
  • In March, 2025, Sumitomo Electric Industries inaugurated a specialized production facility in North Africa, dedicated to manufacturing high-speed data transmission harnesses to meet surging automotive connectivity demands.
  • In April, 2025, TE Connectivity introduced a modular high-voltage connector system for heavy-duty commercial trucks, featuring an integrated safety interlock loop to enhance serviceability and reduce electrical risks.
  • In May, 2025, Yazaki Corporation unveiled a new series of low-insertion-force terminals featuring a proprietary surface geometry that reduces manual assembly effort, improving ergonomics in large-scale harness production.

Dive into Technavio’s robust research methodology, blending expert interviews, extensive data synthesis, and validated models for unparalleled Wire Harness Market insights. See full methodology.

Market Scope
Page number 320
Base year 2025
Historic period 2020-2024
Forecast period 2026-2030
Growth momentum & CAGR Accelerate at a CAGR of 7.4%
Market growth 2026-2030 USD 58437.2 million
Market structure Fragmented
YoY growth 2025-2026(%) 6.3%
Key countries US, Canada, Mexico, Germany, UK, France, Italy, Spain, The Netherlands, China, Japan, India, South Korea, Australia, Indonesia, Brazil, Argentina, Colombia, Saudi Arabia, UAE, South Africa, Israel and Turkey
Competitive landscape Leading Companies, Market Positioning of Companies, Competitive Strategies, and Industry Risks

Request Free Sample

Research Analyst Overview

  • The wire harness market functions as a critical enabler of technological advancement, with its evolution dictated by the increasing complexity of modern electrical systems. The transition toward high-voltage powertrains and modular zonal architecture in vehicles is driving demand for sophisticated electrical distribution systems and specialized high-voltage harness solutions.
  • Innovations in lightweight materials, including aluminum wiring and flexible printed circuits, are pivotal for enhancing efficiency. This trend is coupled with a push for high-speed data transmission capabilities, supported by automotive ethernet and optical fiber integration.
  • At the boardroom level, the adoption of sustainable insulation materials and circular economy manufacturing is now a core strategic decision, directly impacting supply chain partnerships and compliance with global environmental mandates. The shift to solid-state power distribution in some platforms has demonstrated weight reductions of up to 30%.
  • Concurrently, custom wire harness production relies on automated assembly and low-insertion-force terminals to manage complexity while ensuring reliability. The use of halogen-free materials and heat-resistant connectors in signal and power solutions addresses stringent safety and performance requirements across industries.

What are the Key Data Covered in this Wire Harness Market Research and Growth Report?

  • What is the expected growth of the Wire Harness Market between 2026 and 2030?

    • USD 58.44 billion, at a CAGR of 7.4%

  • What segmentation does the market report cover?

    • The report is segmented by Application (Automotive, Telecom, Medical, and Others), Material (PVC, Vinyl, Thermoplastic elastomer, Polyurethane, and Polyethylene), Product Type (Electric wires, Connectors, Terminals, and Others), Type (Data transmission, and Wiring) and Geography (North America, Europe, APAC, South America, Middle East and Africa)

  • Which regions are analyzed in the report?

    • North America, Europe, APAC, South America and Middle East and Africa

  • What are the key growth drivers and market challenges?

    • EV growth driving high-voltage harness ramp-up, Global tariffs disrupting wire harness supply chains

  • Who are the major players in the Wire Harness Market?

    • Aptiv Plc, Cloom Tech, Coroplast, Dongguan Konnra Co., Ltd., Fujikura Co. Ltd., Furukawa Electric Co. Ltd., Lear Corp., Leoni AG, Linkwings, Motherson Group, Nexans Autoelectric Group, Omega Leads, Prysmian S.p.A, Sumitomo Electric Industries and Wiringo

Market Research Insights

  • The wire harness market is defined by a rapid technological pivot, where traditional electrical frameworks are being re-engineered. The rise of electric vehicle architecture is compelling a shift toward high-voltage systems, with wiring content in EVs being over double that of internal combustion vehicles.
  • Concurrently, smart factory wiring for industrial automation connectivity demands ruggedized harness assembly solutions that reduce maintenance-related downtime by over 15%. Innovations in advanced driver-assistance systems (ADAS) are fueling the need for high-fidelity signaling, while miniaturized harness design is enabling the development of more compact and sophisticated electronic devices.
  • The integration of high-flexibility cabling ensures reliability in dynamic applications, from robotics to aerospace, underscoring the market's role as an enabler of next-generation technology.

We can help! Our analysts can customize this wire harness market research report to meet your requirements.

Get in touch

1. Executive Summary

1.1 Market overview

Executive Summary - Chart on Market Overview
Executive Summary - Data Table on Market Overview
Executive Summary - Chart on Global Market Characteristics
Executive Summary - Chart on Market by Geography
Executive Summary - Chart on Market Segmentation by Application
Executive Summary - Chart on Market Segmentation by Material
Executive Summary - Chart on Market Segmentation by Product Type
Executive Summary - Chart on Market Segmentation by Type
Executive Summary - Chart on Incremental Growth
Executive Summary - Data Table on Incremental Growth
Executive Summary - Chart on Company Market Positioning

2. Technavio Analysis

2.1 Analysis of price sensitivity, lifecycle, customer purchase basket, adoption rates, and purchase criteria

2.2 Criticality of inputs and Factors of differentiation

Chart on Overview on criticality of inputs and factors of differentiation

2.3 Factors of disruption

Chart on Overview on factors of disruption

2.4 Impact of drivers and challenges

Chart on Impact of drivers and challenges in 2025 and 2030

3. Market Landscape

3.1 Market ecosystem

Chart on Parent Market
Data Table on - Parent Market

3.2 Market characteristics

Chart on Market characteristics analysis

3.3 Value chain analysis

Chart on Value chain analysis

4. Market Sizing

4.1 Market definition

Data Table on Offerings of companies included in the market definition

4.2 Market segment analysis

Market segments

4.3 Market size 2025

4.4 Market outlook: Forecast for 2025-2030

Chart on Global - Market size and forecast 2025-2030 ($ million)
Data Table on Global - Market size and forecast 2025-2030 ($ million)
Chart on Global Market: Year-over-year growth 2025-2030 (%)
Data Table on Global Market: Year-over-year growth 2025-2030 (%)

5. Historic Market Size

5.1 Global Wire Harness Market 2020 - 2024

Historic Market Size - Data Table on Global Wire Harness Market 2020 - 2024 ($ million)

5.2 Application segment analysis 2020 - 2024

Historic Market Size - Application Segment 2020 - 2024 ($ million)

5.3 Material segment analysis 2020 - 2024

Historic Market Size - Material Segment 2020 - 2024 ($ million)

5.4 Product Type segment analysis 2020 - 2024

Historic Market Size - Product Type Segment 2020 - 2024 ($ million)

5.5 Type segment analysis 2020 - 2024

Historic Market Size - Type Segment 2020 - 2024 ($ million)

5.6 Geography segment analysis 2020 - 2024

Historic Market Size - Geography Segment 2020 - 2024 ($ million)

5.7 Country segment analysis 2020 - 2024

Historic Market Size - Country Segment 2020 - 2024 ($ million)

6. Qualitative Analysis

6.1 The Impact of AI in Global Wire Harness Market

7. Five Forces Analysis

7.1 Five forces summary

Five forces analysis - Comparison between 2025 and 2030

7.2 Bargaining power of buyers

Bargaining power of buyers - Impact of key factors 2025 and 2030

7.3 Bargaining power of suppliers

Bargaining power of suppliers - Impact of key factors in 2025 and 2030

7.4 Threat of new entrants

Threat of new entrants - Impact of key factors in 2025 and 2030

7.5 Threat of substitutes

Threat of substitutes - Impact of key factors in 2025 and 2030

7.6 Threat of rivalry

Threat of rivalry - Impact of key factors in 2025 and 2030

7.7 Market condition

Chart on Market condition - Five forces 2025 and 2030

8. Market Segmentation by Application

8.1 Market segments

Chart on Application - Market share 2025-2030 (%)
Data Table on Application - Market share 2025-2030 (%)

8.2 Comparison by Application

Chart on Comparison by Application
Data Table on Comparison by Application

8.3 Automotive - Market size and forecast 2025-2030

Chart on Automotive - Market size and forecast 2025-2030 ($ million)
Data Table on Automotive - Market size and forecast 2025-2030 ($ million)
Chart on Automotive - Year-over-year growth 2025-2030 (%)
Data Table on Automotive - Year-over-year growth 2025-2030 (%)

8.4 Telecom - Market size and forecast 2025-2030

Chart on Telecom - Market size and forecast 2025-2030 ($ million)
Data Table on Telecom - Market size and forecast 2025-2030 ($ million)
Chart on Telecom - Year-over-year growth 2025-2030 (%)
Data Table on Telecom - Year-over-year growth 2025-2030 (%)

8.5 Medical - Market size and forecast 2025-2030

Chart on Medical - Market size and forecast 2025-2030 ($ million)
Data Table on Medical - Market size and forecast 2025-2030 ($ million)
Chart on Medical - Year-over-year growth 2025-2030 (%)
Data Table on Medical - Year-over-year growth 2025-2030 (%)

8.6 Others - Market size and forecast 2025-2030

Chart on Others - Market size and forecast 2025-2030 ($ million)
Data Table on Others - Market size and forecast 2025-2030 ($ million)
Chart on Others - Year-over-year growth 2025-2030 (%)
Data Table on Others - Year-over-year growth 2025-2030 (%)

8.7 Market opportunity by Application

Market opportunity by Application ($ million)
Data Table on Market opportunity by Application ($ million)

9. Market Segmentation by Material

9.1 Market segments

Chart on Material - Market share 2025-2030 (%)
Data Table on Material - Market share 2025-2030 (%)

9.2 Comparison by Material

Chart on Comparison by Material
Data Table on Comparison by Material

9.3 PVC - Market size and forecast 2025-2030

Chart on PVC - Market size and forecast 2025-2030 ($ million)
Data Table on PVC - Market size and forecast 2025-2030 ($ million)
Chart on PVC - Year-over-year growth 2025-2030 (%)
Data Table on PVC - Year-over-year growth 2025-2030 (%)

9.4 Vinyl - Market size and forecast 2025-2030

Chart on Vinyl - Market size and forecast 2025-2030 ($ million)
Data Table on Vinyl - Market size and forecast 2025-2030 ($ million)
Chart on Vinyl - Year-over-year growth 2025-2030 (%)
Data Table on Vinyl - Year-over-year growth 2025-2030 (%)

9.5 Thermoplastic elastomer - Market size and forecast 2025-2030

Chart on Thermoplastic elastomer - Market size and forecast 2025-2030 ($ million)
Data Table on Thermoplastic elastomer - Market size and forecast 2025-2030 ($ million)
Chart on Thermoplastic elastomer - Year-over-year growth 2025-2030 (%)
Data Table on Thermoplastic elastomer - Year-over-year growth 2025-2030 (%)

9.6 Polyurethane - Market size and forecast 2025-2030

Chart on Polyurethane - Market size and forecast 2025-2030 ($ million)
Data Table on Polyurethane - Market size and forecast 2025-2030 ($ million)
Chart on Polyurethane - Year-over-year growth 2025-2030 (%)
Data Table on Polyurethane - Year-over-year growth 2025-2030 (%)

9.7 Polyethylene - Market size and forecast 2025-2030

Chart on Polyethylene - Market size and forecast 2025-2030 ($ million)
Data Table on Polyethylene - Market size and forecast 2025-2030 ($ million)
Chart on Polyethylene - Year-over-year growth 2025-2030 (%)
Data Table on Polyethylene - Year-over-year growth 2025-2030 (%)

9.8 Market opportunity by Material

Market opportunity by Material ($ million)
Data Table on Market opportunity by Material ($ million)

10. Market Segmentation by Product Type

10.1 Market segments

Chart on Product Type - Market share 2025-2030 (%)
Data Table on Product Type - Market share 2025-2030 (%)

10.2 Comparison by Product Type

Chart on Comparison by Product Type
Data Table on Comparison by Product Type

10.3 Electric wires - Market size and forecast 2025-2030

Chart on Electric wires - Market size and forecast 2025-2030 ($ million)
Data Table on Electric wires - Market size and forecast 2025-2030 ($ million)
Chart on Electric wires - Year-over-year growth 2025-2030 (%)
Data Table on Electric wires - Year-over-year growth 2025-2030 (%)

10.4 Connectors - Market size and forecast 2025-2030

Chart on Connectors - Market size and forecast 2025-2030 ($ million)
Data Table on Connectors - Market size and forecast 2025-2030 ($ million)
Chart on Connectors - Year-over-year growth 2025-2030 (%)
Data Table on Connectors - Year-over-year growth 2025-2030 (%)

10.5 Terminals - Market size and forecast 2025-2030

Chart on Terminals - Market size and forecast 2025-2030 ($ million)
Data Table on Terminals - Market size and forecast 2025-2030 ($ million)
Chart on Terminals - Year-over-year growth 2025-2030 (%)
Data Table on Terminals - Year-over-year growth 2025-2030 (%)

10.6 Others - Market size and forecast 2025-2030

Chart on Others - Market size and forecast 2025-2030 ($ million)
Data Table on Others - Market size and forecast 2025-2030 ($ million)
Chart on Others - Year-over-year growth 2025-2030 (%)
Data Table on Others - Year-over-year growth 2025-2030 (%)

10.7 Market opportunity by Product Type

Market opportunity by Product Type ($ million)
Data Table on Market opportunity by Product Type ($ million)

11. Market Segmentation by Type

11.1 Market segments

Chart on Type - Market share 2025-2030 (%)
Data Table on Type - Market share 2025-2030 (%)

11.2 Comparison by Type

Chart on Comparison by Type
Data Table on Comparison by Type

11.3 Data transmission - Market size and forecast 2025-2030

Chart on Data transmission - Market size and forecast 2025-2030 ($ million)
Data Table on Data transmission - Market size and forecast 2025-2030 ($ million)
Chart on Data transmission - Year-over-year growth 2025-2030 (%)
Data Table on Data transmission - Year-over-year growth 2025-2030 (%)

11.4 Wiring - Market size and forecast 2025-2030

Chart on Wiring - Market size and forecast 2025-2030 ($ million)
Data Table on Wiring - Market size and forecast 2025-2030 ($ million)
Chart on Wiring - Year-over-year growth 2025-2030 (%)
Data Table on Wiring - Year-over-year growth 2025-2030 (%)

11.5 Market opportunity by Type

Market opportunity by Type ($ million)
Data Table on Market opportunity by Type ($ million)

12. Customer Landscape

12.1 Customer landscape overview

Analysis of price sensitivity, lifecycle, customer purchase basket, adoption rates, and purchase criteria

13. Geographic Landscape

13.1 Geographic segmentation

Chart on Market share by geography 2025-2030 (%)
Data Table on Market share by geography 2025-2030 (%)

13.2 Geographic comparison

Chart on Geographic comparison
Data Table on Geographic comparison

13.3 North America - Market size and forecast 2025-2030

Chart on North America - Market size and forecast 2025-2030 ($ million)
Data Table on North America - Market size and forecast 2025-2030 ($ million)
Chart on North America - Year-over-year growth 2025-2030 (%)
Data Table on North America - Year-over-year growth 2025-2030 (%)
Chart on Regional Comparison - North America
Data Table on Regional Comparison - North America

13.3.1 US - Market size and forecast 2025-2030

Chart on US - Market size and forecast 2025-2030 ($ million)
Data Table on US - Market size and forecast 2025-2030 ($ million)
Chart on US - Year-over-year growth 2025-2030 (%)
Data Table on US - Year-over-year growth 2025-2030 (%)

13.3.2 Canada - Market size and forecast 2025-2030

Chart on Canada - Market size and forecast 2025-2030 ($ million)
Data Table on Canada - Market size and forecast 2025-2030 ($ million)
Chart on Canada - Year-over-year growth 2025-2030 (%)
Data Table on Canada - Year-over-year growth 2025-2030 (%)

13.3.3 Mexico - Market size and forecast 2025-2030

Chart on Mexico - Market size and forecast 2025-2030 ($ million)
Data Table on Mexico - Market size and forecast 2025-2030 ($ million)
Chart on Mexico - Year-over-year growth 2025-2030 (%)
Data Table on Mexico - Year-over-year growth 2025-2030 (%)

13.4 Europe - Market size and forecast 2025-2030

Chart on Europe - Market size and forecast 2025-2030 ($ million)
Data Table on Europe - Market size and forecast 2025-2030 ($ million)
Chart on Europe - Year-over-year growth 2025-2030 (%)
Data Table on Europe - Year-over-year growth 2025-2030 (%)
Chart on Regional Comparison - Europe
Data Table on Regional Comparison - Europe

13.4.1 Germany - Market size and forecast 2025-2030

Chart on Germany - Market size and forecast 2025-2030 ($ million)
Data Table on Germany - Market size and forecast 2025-2030 ($ million)
Chart on Germany - Year-over-year growth 2025-2030 (%)
Data Table on Germany - Year-over-year growth 2025-2030 (%)

13.4.2 UK - Market size and forecast 2025-2030

Chart on UK - Market size and forecast 2025-2030 ($ million)
Data Table on UK - Market size and forecast 2025-2030 ($ million)
Chart on UK - Year-over-year growth 2025-2030 (%)
Data Table on UK - Year-over-year growth 2025-2030 (%)

13.4.3 France - Market size and forecast 2025-2030

Chart on France - Market size and forecast 2025-2030 ($ million)
Data Table on France - Market size and forecast 2025-2030 ($ million)
Chart on France - Year-over-year growth 2025-2030 (%)
Data Table on France - Year-over-year growth 2025-2030 (%)

13.4.4 Italy - Market size and forecast 2025-2030

Chart on Italy - Market size and forecast 2025-2030 ($ million)
Data Table on Italy - Market size and forecast 2025-2030 ($ million)
Chart on Italy - Year-over-year growth 2025-2030 (%)
Data Table on Italy - Year-over-year growth 2025-2030 (%)

13.4.5 Spain - Market size and forecast 2025-2030

Chart on Spain - Market size and forecast 2025-2030 ($ million)
Data Table on Spain - Market size and forecast 2025-2030 ($ million)
Chart on Spain - Year-over-year growth 2025-2030 (%)
Data Table on Spain - Year-over-year growth 2025-2030 (%)

13.4.6 The Netherlands - Market size and forecast 2025-2030

Chart on The Netherlands - Market size and forecast 2025-2030 ($ million)
Data Table on The Netherlands - Market size and forecast 2025-2030 ($ million)
Chart on The Netherlands - Year-over-year growth 2025-2030 (%)
Data Table on The Netherlands - Year-over-year growth 2025-2030 (%)

13.5 APAC - Market size and forecast 2025-2030

Chart on APAC - Market size and forecast 2025-2030 ($ million)
Data Table on APAC - Market size and forecast 2025-2030 ($ million)
Chart on APAC - Year-over-year growth 2025-2030 (%)
Data Table on APAC - Year-over-year growth 2025-2030 (%)
Chart on Regional Comparison - APAC
Data Table on Regional Comparison - APAC

13.5.1 China - Market size and forecast 2025-2030

Chart on China - Market size and forecast 2025-2030 ($ million)
Data Table on China - Market size and forecast 2025-2030 ($ million)
Chart on China - Year-over-year growth 2025-2030 (%)
Data Table on China - Year-over-year growth 2025-2030 (%)

13.5.2 Japan - Market size and forecast 2025-2030

Chart on Japan - Market size and forecast 2025-2030 ($ million)
Data Table on Japan - Market size and forecast 2025-2030 ($ million)
Chart on Japan - Year-over-year growth 2025-2030 (%)
Data Table on Japan - Year-over-year growth 2025-2030 (%)

13.5.3 India - Market size and forecast 2025-2030

Chart on India - Market size and forecast 2025-2030 ($ million)
Data Table on India - Market size and forecast 2025-2030 ($ million)
Chart on India - Year-over-year growth 2025-2030 (%)
Data Table on India - Year-over-year growth 2025-2030 (%)

13.5.4 South Korea - Market size and forecast 2025-2030

Chart on South Korea - Market size and forecast 2025-2030 ($ million)
Data Table on South Korea - Market size and forecast 2025-2030 ($ million)
Chart on South Korea - Year-over-year growth 2025-2030 (%)
Data Table on South Korea - Year-over-year growth 2025-2030 (%)

13.5.5 Australia - Market size and forecast 2025-2030

Chart on Australia - Market size and forecast 2025-2030 ($ million)
Data Table on Australia - Market size and forecast 2025-2030 ($ million)
Chart on Australia - Year-over-year growth 2025-2030 (%)
Data Table on Australia - Year-over-year growth 2025-2030 (%)

13.5.6 Indonesia - Market size and forecast 2025-2030

Chart on Indonesia - Market size and forecast 2025-2030 ($ million)
Data Table on Indonesia - Market size and forecast 2025-2030 ($ million)
Chart on Indonesia - Year-over-year growth 2025-2030 (%)
Data Table on Indonesia - Year-over-year growth 2025-2030 (%)

13.6 South America - Market size and forecast 2025-2030

Chart on South America - Market size and forecast 2025-2030 ($ million)
Data Table on South America - Market size and forecast 2025-2030 ($ million)
Chart on South America - Year-over-year growth 2025-2030 (%)
Data Table on South America - Year-over-year growth 2025-2030 (%)
Chart on Regional Comparison - South America
Data Table on Regional Comparison - South America

13.6.1 Brazil - Market size and forecast 2025-2030

Chart on Brazil - Market size and forecast 2025-2030 ($ million)
Data Table on Brazil - Market size and forecast 2025-2030 ($ million)
Chart on Brazil - Year-over-year growth 2025-2030 (%)
Data Table on Brazil - Year-over-year growth 2025-2030 (%)

13.6.2 Argentina - Market size and forecast 2025-2030

Chart on Argentina - Market size and forecast 2025-2030 ($ million)
Data Table on Argentina - Market size and forecast 2025-2030 ($ million)
Chart on Argentina - Year-over-year growth 2025-2030 (%)
Data Table on Argentina - Year-over-year growth 2025-2030 (%)

13.6.3 Colombia - Market size and forecast 2025-2030

Chart on Colombia - Market size and forecast 2025-2030 ($ million)
Data Table on Colombia - Market size and forecast 2025-2030 ($ million)
Chart on Colombia - Year-over-year growth 2025-2030 (%)
Data Table on Colombia - Year-over-year growth 2025-2030 (%)

13.7 Middle East and Africa - Market size and forecast 2025-2030

Chart on Middle East and Africa - Market size and forecast 2025-2030 ($ million)
Data Table on Middle East and Africa - Market size and forecast 2025-2030 ($ million)
Chart on Middle East and Africa - Year-over-year growth 2025-2030 (%)
Data Table on Middle East and Africa - Year-over-year growth 2025-2030 (%)
Chart on Regional Comparison - Middle East and Africa
Data Table on Regional Comparison - Middle East and Africa

13.7.1 Saudi Arabia - Market size and forecast 2025-2030

Chart on Saudi Arabia - Market size and forecast 2025-2030 ($ million)
Data Table on Saudi Arabia - Market size and forecast 2025-2030 ($ million)
Chart on Saudi Arabia - Year-over-year growth 2025-2030 (%)
Data Table on Saudi Arabia - Year-over-year growth 2025-2030 (%)

13.7.2 UAE - Market size and forecast 2025-2030

Chart on UAE - Market size and forecast 2025-2030 ($ million)
Data Table on UAE - Market size and forecast 2025-2030 ($ million)
Chart on UAE - Year-over-year growth 2025-2030 (%)
Data Table on UAE - Year-over-year growth 2025-2030 (%)

13.7.3 South Africa - Market size and forecast 2025-2030

Chart on South Africa - Market size and forecast 2025-2030 ($ million)
Data Table on South Africa - Market size and forecast 2025-2030 ($ million)
Chart on South Africa - Year-over-year growth 2025-2030 (%)
Data Table on South Africa - Year-over-year growth 2025-2030 (%)

13.7.4 Israel - Market size and forecast 2025-2030

Chart on Israel - Market size and forecast 2025-2030 ($ million)
Data Table on Israel - Market size and forecast 2025-2030 ($ million)
Chart on Israel - Year-over-year growth 2025-2030 (%)
Data Table on Israel - Year-over-year growth 2025-2030 (%)

13.7.5 Turkey - Market size and forecast 2025-2030

Chart on Turkey - Market size and forecast 2025-2030 ($ million)
Data Table on Turkey - Market size and forecast 2025-2030 ($ million)
Chart on Turkey - Year-over-year growth 2025-2030 (%)
Data Table on Turkey - Year-over-year growth 2025-2030 (%)

13.8 Market opportunity by geography

Market opportunity by geography ($ million)
Data Tables on Market opportunity by geography ($ million)

14. Drivers, Challenges, and Opportunity

14.1 Market drivers

EV growth driving high-voltage harness ramp-up
Automation surge demands smarter connectivity
Government incentives accelerating electric mobility adoption

14.2 Market challenges

Global tariffs disrupting wire harness supply chains
Customization demands adding production challenges
Quality control requires thorough defect detection processes

14.3 Impact of drivers and challenges

Impact of drivers and challenges in 2025 and 2030

14.4 Market opportunities

Miniaturized harnesses for compact device integration
Optimized weight with aluminum solutions
Sustainable materials and circular‑economy manufacturing practices

15. Competitive Landscape

15.1 Overview

15.2

Overview on criticality of inputs and factors of differentiation

15.3 Landscape disruption

Overview on factors of disruption

15.4 Industry risks

Impact of key risks on business

16. Competitive Analysis

16.1 Companies profiled

Companies covered

16.2 Company ranking index

16.3 Market positioning of companies

Matrix on companies position and classification

16.4 Aptiv Plc

Aptiv Plc - Overview
Aptiv Plc - Business segments
Aptiv Plc - Key news
Aptiv Plc - Key offerings
Aptiv Plc - Segment focus
SWOT

16.5 Cloom Tech

Cloom Tech - Overview
Cloom Tech - Product / Service
Cloom Tech - Key offerings
SWOT

16.6 Coroplast

Coroplast - Overview
Coroplast - Product / Service
Coroplast - Key offerings
SWOT

16.7 Dongguan Konnra Co., Ltd.

Dongguan Konnra Co., Ltd. - Overview
Dongguan Konnra Co., Ltd. - Product / Service
Dongguan Konnra Co., Ltd. - Key offerings
SWOT

16.8 Fujikura Co. Ltd.

Fujikura Co. Ltd. - Overview
Fujikura Co. Ltd. - Business segments
Fujikura Co. Ltd. - Key news
Fujikura Co. Ltd. - Key offerings
Fujikura Co. Ltd. - Segment focus
SWOT

16.9 Furukawa Electric Co. Ltd.

Furukawa Electric Co. Ltd. - Overview
Furukawa Electric Co. Ltd. - Product / Service
Furukawa Electric Co. Ltd. - Key news
Furukawa Electric Co. Ltd. - Key offerings
SWOT

16.10 Lear Corp.

Lear Corp. - Overview
Lear Corp. - Business segments
Lear Corp. - Key offerings
Lear Corp. - Segment focus
SWOT

16.11 Leoni AG

Leoni AG - Overview
Leoni AG - Product / Service
Leoni AG - Key offerings
SWOT

16.12 Linkwings

Linkwings - Overview
Linkwings - Product / Service
Linkwings - Key offerings
SWOT

16.13 Motherson Group

Motherson Group - Overview
Motherson Group - Business segments
Motherson Group - Key offerings
Motherson Group - Segment focus
SWOT

16.14 Nexans Autoelectric Group

Nexans Autoelectric Group - Overview
Nexans Autoelectric Group - Product / Service
Nexans Autoelectric Group - Key offerings
SWOT

16.15 Omega Leads

Omega Leads - Overview
Omega Leads - Product / Service
Omega Leads - Key offerings
SWOT

16.16 Prysmian S.p.A

Prysmian S.p.A - Overview
Prysmian S.p.A - Product / Service
Prysmian S.p.A - Key offerings
SWOT

16.17 Sumitomo Electric Industries

Sumitomo Electric Industries - Overview
Sumitomo Electric Industries - Business segments
Sumitomo Electric Industries - Key news
Sumitomo Electric Industries - Key offerings
Sumitomo Electric Industries - Segment focus
SWOT

16.18 Wiringo

Wiringo - Overview
Wiringo - Product / Service
Wiringo - Key offerings
SWOT

17. Appendix

17.1 Scope of the report

Market definition
Objectives
Notes and caveats

17.2 Inclusions and exclusions checklist

Inclusions checklist
Exclusions checklist

17.3 Currency conversion rates for US$

17.4 Research methodology

17.5 Data procurement

Information sources

17.6 Data validation

17.7 Validation techniques employed for market sizing

17.8 Data synthesis

17.9 360 degree market analysis

17.10 List of abbreviations

Research Methodology

Technavio presents a detailed picture of the market by way of study, synthesis, and summation of data from multiple sources. The analysts have presented the various facets of the market with a particular focus on identifying the key industry influencers. The data thus presented is comprehensive, reliable, and the result of extensive research, both primary and secondary.

INFORMATION SOURCES

Primary sources

  • Manufacturers and suppliers
  • Channel partners
  • Industry experts
  • Strategic decision makers

Secondary sources

  • Industry journals and periodicals
  • Government data
  • Financial reports of key industry players
  • Historical data
  • Press releases

DATA ANALYSIS

Data Synthesis

  • Collation of data
  • Estimation of key figures
  • Analysis of derived insights

Data Validation

  • Triangulation with data models
  • Reference against proprietary databases
  • Corroboration with industry experts

REPORT WRITING

Qualitative

  • Market drivers
  • Market challenges
  • Market trends
  • Five forces analysis

Quantitative

  • Market size and forecast
  • Market segmentation
  • Geographical insights
  • Competitive landscape

Interested in this report?

Get your sample now to see our research methodology and insights!

Download Now

Frequently Asked Questions

Wire Harness market growth will increase by USD 58437.2 million during 2026-2030.

The Wire Harness market is expected to grow at a CAGR of 7.4% during 2026-2030.

Wire Harness market is segmented by Application (Automotive, Telecom, Medical, Others) Material (PVC, Vinyl, Thermoplastic elastomer, Polyurethane, Polyethylene) Product type (Electric wires, Connectors, Terminals, Others) Type (Data transmission, Wiring)

Aptiv Plc, Cloom Tech, Coroplast, Dongguan Konnra Co., Ltd., Fujikura Co. Ltd., Furukawa Electric Co. Ltd., Lear Corp., Leoni AG, Linkwings, Motherson Group, Nexans Autoelectric Group, Omega Leads, Prysmian S.p.A, Sumitomo Electric Industries, Wiringo are a few of the key vendors in the Wire Harness market.

North America will register the highest growth rate of 45.8% among the other regions. Therefore, the Wire Harness market in North America is expected to garner significant business opportunities for the vendors during the forecast period.

US, Canada, Mexico, Germany, UK, France, Italy, Spain, The Netherlands, China, Japan, India, South Korea, Australia, Indonesia, Brazil, Argentina, Colombia, Saudi Arabia, UAE, South Africa, Israel, Turkey

  • EV growth driving high-voltage harness ramp-up is the driving factor this market.

The Wire Harness market vendors should focus on grabbing business opportunities from the Application segment as it accounted for the largest market share in the base year.
RIA - Research AI Assistant
Ask RIA