Europe Coronavirus Test Kits Market Size 2024-2028
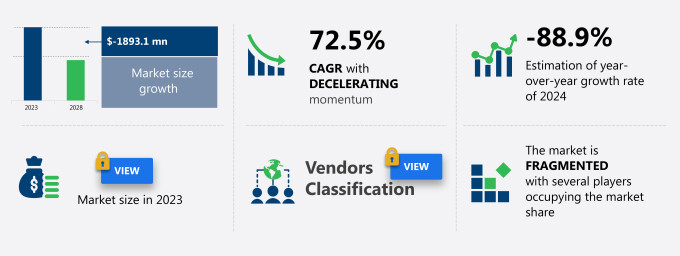
The coronavirus test kits market in Europe size is forecast to decrease by USD 1.89 billion at a CAGR of -72.5% between 2023 and 2028.
- The European coronavirus test kits market is experiencing significant growth due to the increasing demand for rapid diagnostic solutions. The emergence of SARS-CoV-2 variants, such as the Delta variant, has highlighted the importance of accurate and timely testing. Oropharyngeal swabs, nasal swabs, and sputum samples are commonly used for diagnosing COVID-19 infections. Point-of-Care (PoC) kits have gained popularity due to their convenience and quick results. However, the accuracy of diagnostic tests remains a challenge, with the Indian Council of Medical Research (ICMR) and the Health Ministry reporting false positives and negatives. The market is expected to continue its expansion as the world navigates the ongoing pandemic.
What will be the Size of the Market During the Forecast Period?
- The European coronavirus test kits market is witnessing significant growth due to the ongoing pandemic caused by SARS-CoV-2. The demand for test kits is driven by the need for early detection and rapid screening of infected individuals to prevent the spread of the virus within communities. According to the medical device database from GlobalData, RT-PCR tests remain the gold standard for diagnosing SARS-CoV-2 infection. These tests detect viral genetic material from human nasal samples, providing accurate results. However, the time-consuming nature of these tests and the requirement for specialized equipment have led to the emergence of alternative solutions, such as SARS-CoV-2 antigen tests.
- Moreover, rapid antigen tests, also known as point-of-care (PoC) kits, offer user-friendly solutions for healthcare systems. These tests provide results within minutes, making them ideal for mass screening in various settings, including schools, workplaces, and airports. The Delta variant and the emerging Omicron variant of SARS-CoV-2 have added to the urgency for effective testing solutions. The European Union has been proactive in addressing this need, with initiatives such as the European Health Union and the EU Digital COVID Certificate system. The European coronavirus test kits market is expected to continue its growth trajectory, driven by the ongoing pandemic and the need for regular testing to ensure public health and safety
How is this market segmented and which is the largest segment?
The market research report provides comprehensive data (region-wise segment analysis), with forecasts and estimates in "USD million" for the period 2024-2028, as well as historical data from 2018-2022 for the following segments.
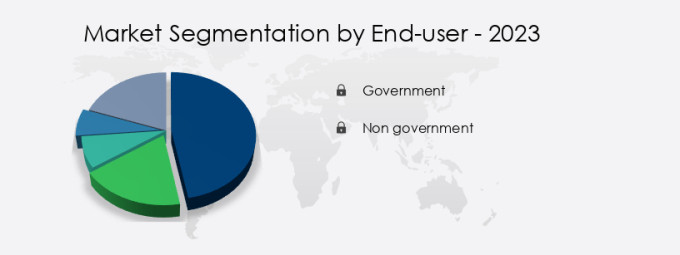
- End-user
- Government
- Non government
- Type
- Rapid test kit
- RT-PCR
- Others
- Geography
- Europe
- Germany
- UK
- France
- Europe
By End-user Insights
- The government segment is estimated to witness significant growth during the forecast period.
In Europe, various diagnostic techniques are utilized to identify COVID-19 cases, with WHO recommending that countries with limited testing capacity or inexperienced national laboratories send their initial positive and negative samples to five referral laboratories in Europe for confirmatory testing. These laboratories include the German coronavirus diagnostic working group at Charite and Robert Koch Institute in Berlin, Erasmus Medical Center in Rotterdam, the Institute Pasteur in Paris, and the Respiratory Virus Unit at Public Health England. Additionally, several other laboratories in Belgium, Luxembourg, the Netherlands, and Spain offer diagnostic testing support. In the UK, Public Health England (PHE) regional laboratories provide testing facilities alongside WHO referral laboratories. As the world awaits vaccinations and booster doses, public awareness remains crucial. During the flu season, mask mandates and social distancing measures continue to be essential preventative measures.
Get a glance at the market report of share of various segments Request Free Sample
Market Dynamics
Our Europe Coronavirus Test Kits Market researchers analyzed the data with 2023 as the base year, along with the key drivers, trends, and challenges. A holistic analysis of drivers will help companies refine their marketing strategies to gain a competitive advantage.
What are the key market drivers leading to the rise in the adoption of the European coronavirus Test Kits Market?
Rising adoption of rapid coronavirus test kits is the key driver of the market.
- In Europe, the coronavirus pandemic has put immense pressure on healthcare systems, particularly in terms of diagnostic capabilities. To mitigate this challenge, European governments have prioritized expanding their testing capacity through various means. In 2022, there was a significant push to distribute coronavirus test kits across the region. The European Commission compiled a list of approved antigen tests, which was frequently updated to ensure access to reliable testing solutions. Furthermore, the European Union's Joint Research Centre (JRC) created a comprehensive database of over 2600 coronavirus test devices and methods, making it one of the most extensive inventories globally. This initiative aimed to facilitate timely and accurate diagnoses, ultimately reducing the burden on healthcare facilities.
- Moreover, the Biden administration in the United States has also shown interest in increasing the availability of coronavirus testing. In this context, the European approach to mass testing, including the distribution of home testing kits and the creation of extensive testing inventories, could serve as valuable insights for the US. As the economic impact of nationwide lockdowns continues, the need for efficient and accessible testing solutions becomes increasingly crucial. In the realm of diagnostic testing, RT-PCR assay kits remain a popular choice due to their high accuracy. However, the specimen type and collection method, such as nasopharyngeal swabs, can influence the overall efficiency and accessibility of testing programs. Such factors will increase the market growth during the forecast period.
What are the market trends shaping the Europe Coronavirus Test Kits Market?
The advent of SARS-CoV-2 mutation is the upcoming trend in the market.
- The emergence of new variants of the SARS-CoV-2 virus, such as BA.2 or stealth omicron, has led to concerns regarding their potential impact on the virus's transmission and symptom severity. The World Health Organization (WHO) has classified these variants as variants of concern. The ongoing COVID-19 outbreaks, particularly in areas where safety measures have been relaxed, have been linked to these highly contagious strains. Consequently, the increasing prevalence of COVID-19 variants is expected to boost the demand for coronavirus test kits in Europe. However, the vaccination rollout and the administration of booster doses may slow down the market growth during the forecast period. Such factors will increase the market trends during the forecast period.
What challenges does Europe Coronavirus Test Kits Market face during the growth?
The inaccuracy of diagnostic tests is a key challenge affecting the market growth.
- The use of coronavirus diagnostic test kits in Europe has gained significance due to the urgent need for accurate and rapid results. However, the inconsistency in test results, including false negatives and false positives, can hinder the adoption of these kits. Regulatory bodies, such as the Indian Council of Medical Research (ICMR) and the Health Ministry, have not issued specific guidelines on conducting these tests. In the early stages of the pandemic, Spain, one of the worst-affected countries, relied on imports from China for testing equipment and supplies. However, upon implementation, it was discovered that these test kits, specifically those using oropharyngeal swabs and nasal swabs, had a sensitivity of only 30% for detecting the SARS-CoV-2 virus.
- However, this is significantly lower than the recommended sensitivity of around 80%. To mitigate such issues, regulatory bodies must issue clear guidelines and for manufacturers to ensure the accuracy and reliability of their PoC (Point of Care) kits, particularly those using RT-PCR (Reverse Transcription Polymerase Chain Reaction) technology, for detecting the Delta variant and other mutations of the virus. By prioritizing the quality and consistency of test results, we can enhance the overall effectiveness of the testing process and contribute to the ongoing efforts to combat the spread of the virus. Such factors will hinder the market growth during the forecast period.
Exclusive Customer Landscape
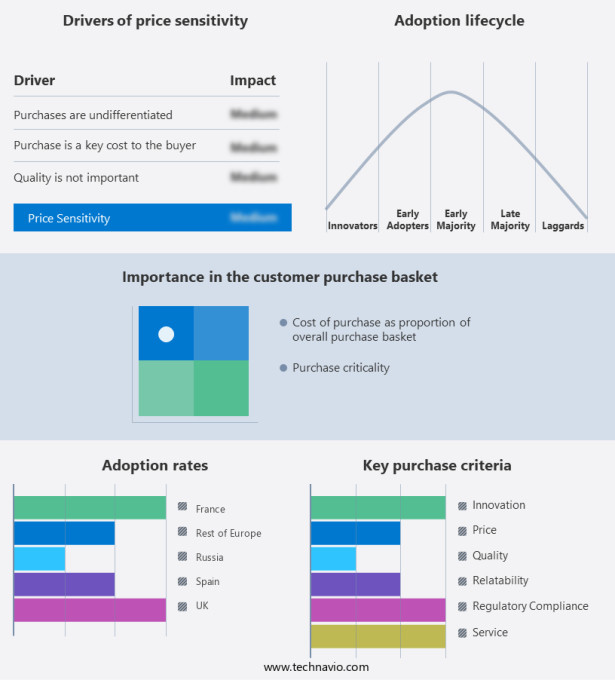
The market forecasting report includes the adoption lifecycle of the market, covering from the innovator's stage to the laggard's stage. It focuses on adoption rates in different regions based on penetration. Furthermore, the market report also includes key purchase criteria and drivers of price sensitivity to help companies evaluate and develop their market growth analysis strategies.
Customer Landscape
Key Companies & Market Insights
Companies are implementing various strategies, such as strategic alliances, market forecast, partnerships, mergers and acquisitions, geographical expansion, and product/service launches, to enhance their presence in the market.
3D Biomedicine Science and Technology Co. Ltd. - The company provides advanced coronavirus test kits, including the Fluorescent qPCR-based COVID-19 plus Influenza AB Combo Test Kit, ensuring accurate and efficient diagnosis for laboratories and healthcare facilities.
The market research and growth report includes detailed analyses of the competitive landscape of the market and information about key companies, including:
- Abbott Laboratories
- altona Diagnostics GmbH
- BGI Genomics Co. Ltd.
- Bio Rad Laboratories Inc.
- BioMerieux SA
- BIOSYNEX SA
- Bruker Corp.
- Co Diagnostics Inc
- Danaher Corp.
- Edinburgh Genetics Ltd.
- F. Hoffmann La Roche Ltd.
- MultiplexDX
- Perkin Elmer Inc.
- QIAGEN N.V.
- Robert Bosch GmbH
- Sd Biosensor Inc.
- Seegene Inc.
- Thermo Fisher Scientific Inc.
- ZEKMED
Qualitative and quantitative analysis of companies has been conducted to help clients understand the wider business environment as well as the strengths and weaknesses of key market players. Data is qualitatively analyzed to categorize companies as pure play, category-focused, industry-focused, and diversified; it is quantitatively analyzed to categorize companies as dominant, leading, strong, tentative, and weak.
Research Analyst Overview
The European market for coronavirus test kits has experienced significant growth due to the ongoing global health crisis caused by the novel coronavirus, SARS-CoV-2. The World Health Organization (WHO) has emphasized the importance of early detection and isolation of infected individuals to control the spread of the virus. Various diagnostic techniques, including RT-PCR tests, are used to identify viral genetic material in human samples. Roche and Hologic are some of the leading medical device companies that manufacture and supply RT-PCR test kits. The medical device database of these companies lists various test kits that have been approved by regulatory bodies for use in developed nations.
Moreover, public awareness campaigns, mask mandates, social distancing measures, and self-precautionary standards have played a crucial role in reducing the spread of the virus. However, with the emergence of new variant viruses such as delta and omicron, the need for rapid screening and early detection remains essential. Point-of-care testing, including rapid antigen tests, has gained popularity due to their user-friendly nature and quick results. These tests are particularly useful for communities with limited access to diagnostic centers and hospitals. The financial impact of the pandemic on healthcare systems has led to a growing demand for cost-effective test kits.
Similarly, the Biden administration's efforts to increase vaccinations and booster doses have also boosted the market for test kits. Clinical trials for intranasal vaccines, such as those developed by Bharat Biotech and Incovacc, are underway. These vaccines, in the form of nasal drops, offer a cost-effective and convenient alternative to traditional vaccines. The re-opening of borders and the resumption of travel have increased the demand for test kits in the European market. SARS-CoV-2 test kits are essential interventions for public health and are critical to controlling the spread of infectious diseases.
|
Market Scope |
|
|
Report Coverage |
Details |
|
Page number |
162 |
|
Base year |
2023 |
|
Historic period |
2018-2022 |
|
Forecast period |
2024-2028 |
|
Growth momentum & CAGR |
Decelerate at a CAGR of 72.5% |
|
Market growth 2024-2028 |
USD -1.89 billion |
|
Market structure |
Fragmented |
|
YoY growth 2023-2024(%) |
-88.9 |
|
Key countries |
Russia, UK, Germany, France, and Rest of Europe |
|
Competitive landscape |
Leading Companies, Market Positioning of Companies, Competitive Strategies, and Industry Risks |
What are the Key Data Covered in this Market Research and Growth Report?
- CAGR of the market during the forecast period
- Detailed information on factors that will drive the market growth and forecasting between 2024 and 2028
- Precise estimation of the size of the market and its contribution of the market in focus to the parent market
- Accurate predictions about upcoming market growth and trends and changes in consumer behaviour
- Growth of the market across Europe
- Thorough analysis of the market's competitive landscape and detailed information about companies
- Comprehensive analysis of factors that will challenge the growth of market companies
We can help! Our analysts can customize this market research report to meet your requirements. Get in touch


