
Vaccines Market Size 2025-2029
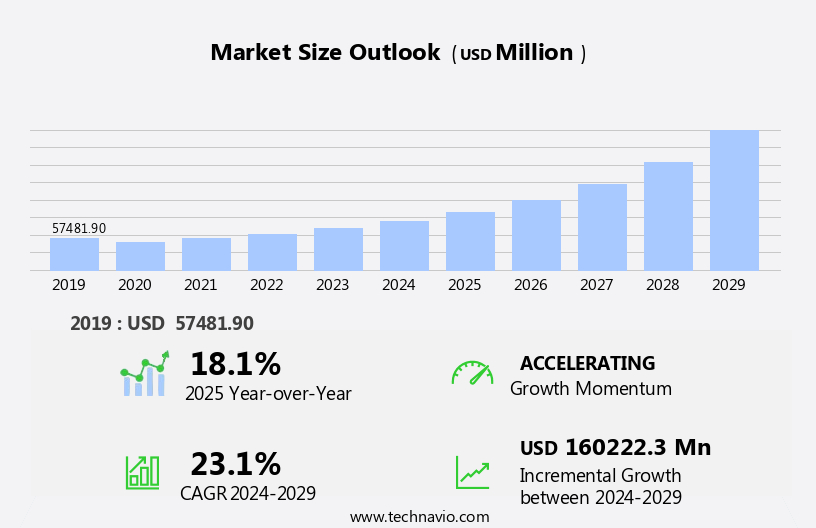
The vaccines market size is forecast to increase by USD 160.22 billion at a CAGR of 23.1% between 2024 and 2029.
- The market is experiencing significant growth, driven by increased funding for research and development, leading to the launch of new vaccines. One of the most promising trends in this market is the development of nanoparticle vaccines, which offer enhanced immunogenicity and improved delivery systems. This trend is particularly evident in the development of nanoparticle vaccines, which offer enhanced efficacy and safety. However, the high cost of research, development, and manufacturing poses a significant challenge for market players. Examples include the inactivated polio vaccine (IPV) and influenza vaccine. These costs can be attributed to the complex production processes involved in vaccine creation, as well as the need for rigorous clinical trials to ensure safety and efficacy.
- However, the high cost of vaccine research, development, and manufacturing remains a significant challenge for market participants. Despite this, the market presents numerous opportunities for companies seeking to capitalize on the growing demand for vaccines, particularly in emerging economies with rising healthcare expenditures. Strategic partnerships, collaborations, and acquisitions are key strategies for companies looking to navigate the competitive landscape and stay ahead of the curve.
- Overall, the market is poised for continued growth, with significant opportunities for innovation and investment in the coming years. Companies that can effectively address the challenges of cost and regulatory compliance while delivering high-quality, effective vaccines will be well-positioned to succeed.
What will be the Size of the Vaccines Market during the forecast period?
- The market driven by the continuous development of immunization programs and the pursuit of vaccine equity. Immunological memory, antibody response, and cost-effectiveness analysis are key factors influencing market growth. Vaccine supply chain, efficacy testing, preservation, patent, and licensing are essential aspects of the market. Nanotechnology and universal vaccines are emerging trends, aiming to improve vaccine accessibility and quality control. Vaccine manufacturing, regulatory approval, and economic impact are crucial elements in the market, with intellectual property, vaccine shelf life, and vaccine development pipeline being significant factors.
- Vaccine innovation and vaccine safety monitoring are essential for addressing disease burden and ensuring potency, stability, and sterility. Vaccine logistics and vaccine stability are critical for successful distribution and administration, while vaccine safety monitoring emphasizes the importance of ongoing surveillance and immune response assessment.
How is this Vaccines Industry segmented?
The vaccines industry research report provides comprehensive data (region-wise segment analysis), with forecasts and estimates in "USD million" for the period 2025-2029, as well as historical data from 2019-2023 for the following segments.
- Type
- Subunit vaccines
- Live attenuated vaccines
- Inactivated vaccines
- Toxoid vaccines
- Others
- End-user
- Hospitals
- Clinics
- Technology
- mRNA vaccines
- Viral vector vaccines
- Protein based vaccines
- DNA vaccines
- Others
- Route Of Administration
- Intramuscular
- Subcutaneous
- Oral
- Intranasal
- Others
- Disease Type
- Influenza
- Human papillomavirus
- Hepatitis
- Measles
- mumps
- rubella
- Others
- Age Group
- Pediatric
- Adult
- Adolescent
- Geriatric
- Geography
- North America
- US
- Canada
- Europe
- France
- Germany
- Italy
- UK
- APAC
- China
- India
- Japan
- South America
- Brazil
- Rest of World (ROW)
- North America
By Type Insights
The subunit vaccines segment is estimated to witness significant growth during the forecast period.
Subunit vaccines, integral components of the healthcare system's disease prevention strategy, employ specific antigenic pieces of a pathogen, such as proteins, sugars, or capsids, to induce a robust immune response. These vaccines, including the mRNA vaccines, are designed to target specific components of the pathogen, making them highly effective in preventing infections. The development process involves identifying and isolating these antigenic components, followed by formulation and rigorous testing to ensure safety and efficacy. For instance, in the realm of disease outbreak prevention, a phase 3 trial for the subunit TB vaccine candidate M72/AS01E was initiated in March 2024 in South Africa.
This trial aims to evaluate the vaccine's efficacy in preventing the progression from latent TB to active pulmonary TB, contributing to herd immunity and ultimately, disease surveillance and vaccine distribution within the healthcare system. Immunization registries play a crucial role in ensuring effective vaccine administration and population immunity tracking.
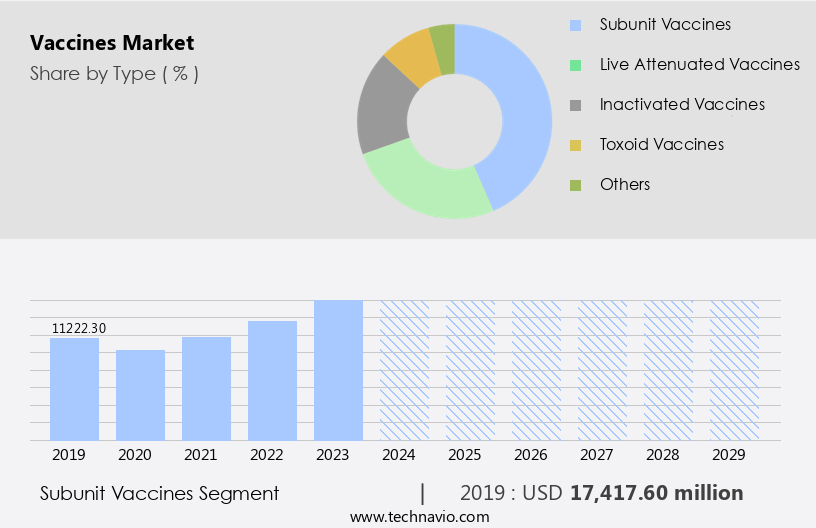
The Subunit vaccines segment was valued at USD 17.42 billion in 2019 and showed a gradual increase during the forecast period.
Regional Analysis
North America is estimated to contribute 39% to the growth of the global market during the forecast period.Technavio's analysts have elaborately explained the regional trends and drivers that shape the market during the forecast period.
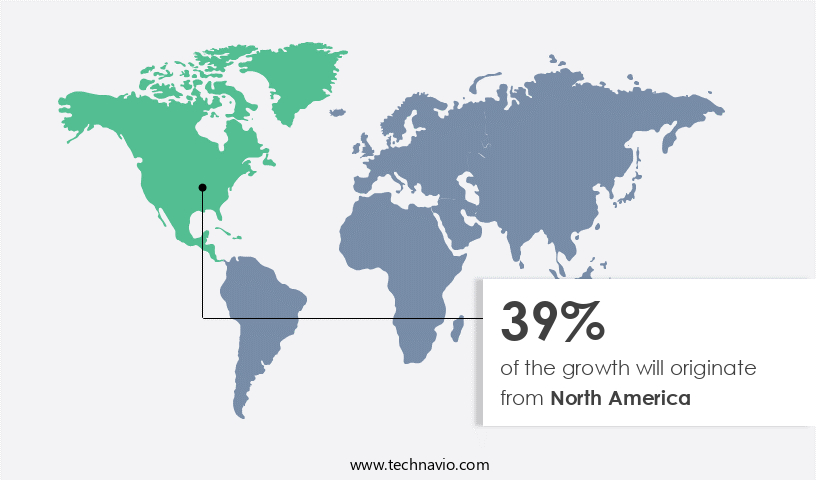
North America holds the largest share of the global vaccines market, primarily due to the increasing number of immunization programs and the strong prevalence of infectious diseases such as influenza, hepatitis A, hepatitis B, HIV, measles, malaria, and TB, and non-infectious diseases such as cancer. The prevalence of several infectious and non-infectious diseases has been increasing at a significant rate in the developed countries of the region. For instance, in the US, the prevalence of influenza rises every year in November and remains high for several weeks, from January to February each year. The vaccine segment has only a few global players (who account for major shares of the market). Most of them are based in the US, including GlaxoSmithKline Plc, Merck and Co. Inc., and Johnson & Johnson.
The presence of government bodies, such as the Advisory Committee on Immunization Practices (ACIP), which provides recommended immunization schedules for pediatric and adult vaccinations, plays a pivotal role in shaping the market in the region. The adult vaccination segment (both preventive and therapeutic) has experienced high acceptance in the Americas compared with other regions. The regional market has witnessed increasing access to vaccines and a growing number of initiatives to generate awareness of immunization programs, which has driven the market growth. For instance, HIV is the most common sexually transmitted infection in the US, with a high prevalence.
To address this issue, several initiatives are being taken by different organizations, which will help in increasing access to vaccines. The initiatives aimed to provide information and generate awareness about HPV vaccination programs. The development of therapeutic and preventive vaccines for various diseases will provide patients with novel therapeutic options that offer high safety and efficacy, which will help in accelerating market growth during the forecast period.
Market Dynamics
Our researchers analyzed the data with 2024 as the base year, along with the key drivers, trends, and challenges. A holistic analysis of drivers will help companies refine their marketing strategies to gain a competitive advantage.
What are the key market drivers leading to the rise in the adoption of Vaccines Industry?
- The primary catalyst for the market's growth is the substantial funding increase for vaccine research and subsequent new vaccine introductions.
- The vaccine market has witnessed significant advancements in recent research, with a focus on preventive care and the development of various types of vaccines, including inactivated, subunit, and conjugate vaccines. Vaccine storage and distribution are critical aspects of ensuring vaccine efficacy and accessibility, particularly for booster doses and those recommended for pregnant women. Adverse events are a concern, and rigorous testing and monitoring are essential to ensure vaccine safety. In the context of pandemic preparedness, collaboration between manufacturers, regulators, and stakeholders is crucial for addressing the challenges and opportunities in vaccine development.
- Public-private partnerships play a vital role in this process, involving government, researchers, manufacturers, purchasers, and policymakers. Ensuring the technical capabilities of vaccine manufacturers and addressing regulatory requirements are essential for timely vaccine development and availability.
What are the market trends shaping the Vaccines Industry?
- Nanoparticle vaccine development represents a significant market trend in the scientific community due to its potential for advanced immunotherapies and enhanced vaccine efficacy.
- Infectious diseases pose a significant health risk to populations worldwide, necessitating ongoing research and development of effective vaccines. Traditional vaccines have been derived from protein subunits and killed pathogens, while live attenuated organisms have also been used. However, live attenuated vaccines carry the risk of regaining pathogenicity under certain immunocompromised conditions. To address this challenge, the development of efficient vaccines in conjunction with suitable delivery systems is crucial for achieving optimal humoral and cell-mediated immunity against specific diseases. Vaccine administration is a critical aspect of disease prevention, and herd immunity can be achieved through effective disease surveillance and vaccine distribution within the healthcare system.
- Immunization registries play a vital role in tracking vaccine administration and ensuring that individuals receive the necessary doses. In recent research, mRNA vaccines have emerged as a promising alternative, offering potential advantages in terms of efficacy and rapid development. Ensuring the availability and accessibility of these vaccines is essential for maintaining public health and mitigating disease outbreaks.
What challenges does the Vaccines Industry face during its growth?
- The high cost of research, development, and manufacturing poses a significant challenge to the growth of the vaccine industry. This expense, which is a crucial aspect of bringing new vaccines to market, places a substantial financial burden on industry players.
- Vaccines have been instrumental in combating infectious diseases, with notable successes such as the eradication of smallpox in several countries. However, the development of new vaccines is a costly and complex process, requiring significant investment. The Coalition for Epidemic Preparedness Innovations (CEPI) is dedicated to creating vaccines for epidemic diseases, with the cost of developing a single vaccine from preclinical trials to Phase IIa estimated to be between USD31-USD68 million, contingent on the absence of clinical trial failures. The cold chain, a critical component of vaccine distribution, ensures the preservation of vaccine efficacy. However, vaccine hesitancy, a growing concern, can hinder the widespread adoption of vaccines.
- Vaccine safety and efficacy are paramount, with ongoing vaccine surveillance playing a crucial role in monitoring their impact. Two prominent types of vaccines are toxoid vaccines and viral vector vaccines. Toxoid vaccines use inactivated or modified toxins to stimulate an immune response, while viral vector vaccines use a harmless virus to deliver genetic material that instructs cells to produce a specific protein. Drug development for vaccines involves rigorous testing and clinical trials to ensure safety and efficacy. The vaccine market continues to evolve, with ongoing research and innovation in vaccine technology. Despite the challenges, the importance of vaccines in protecting against infectious diseases remains undeniable.
Exclusive Customer Landscape
The vaccines market forecasting report includes the adoption lifecycle of the market, covering from the innovator's stage to the laggard's stage. It focuses on adoption rates in different regions based on penetration. Furthermore, the vaccines market report also includes key purchase criteria and drivers of price sensitivity to help companies evaluate and develop their market growth analysis strategies.

Customer Landscape
Key Companies & Market Insights
Companies are implementing various strategies, such as strategic alliances, vaccines market forecast, partnerships, mergers and acquisitions, geographical expansion, and product/service launches, to enhance their presence in the industry.
Arcturus Therapeutics Holdings Inc. - The company introduces its innovative MAPS vaccine, designed to prevent and mitigate the transmission of pneumococcal disease. This cutting-edge immunization solution aims to safeguard individuals from this bacterial infection, contributing significantly to global public health. The MAPS vaccine undergoes rigorous research and development, ensuring its efficacy and safety. By employing advanced technology and scientific expertise, the company is at the forefront of combating pneumococcal disease, ultimately improving overall population health.
The industry research and growth report includes detailed analyses of the competitive landscape of the market and information about key companies, including:
- Arcturus Therapeutics Holdings Inc.
- Astellas Pharma Inc.
- Bavarian Nordic AS
- Bharat Biotech Ltd.
- CSL Ltd.
- Daiichi Sankyo Co. Ltd.
- Dynavax Technologies Corp.
- Emergent BioSolutions Inc.
- GlaxoSmithKline Plc
- Johnson and Johnson Services Inc.
- Merck KGaA
- Moderna Inc.
- Novavax Inc.
- Pfizer Inc.
- Sanofi SA
- Serum Institute of India Pvt. Ltd.
- Sinovac Biotech Ltd.
- Takeda Pharmaceutical Co. Ltd.
- Vaxart Inc.
- VBI Vaccines Inc.
Qualitative and quantitative analysis of companies has been conducted to help clients understand the wider business environment as well as the strengths and weaknesses of key industry players. Data is qualitatively analyzed to categorize companies as pure play, category-focused, industry-focused, and diversified; it is quantitatively analyzed to categorize companies as dominant, leading, strong, tentative, and weak.
Recent Development and News in Vaccines Market
- The market has witnessed significant developments in recent years, with key players focusing on product launches, technological collaborations, mergers and acquisitions, and geographic expansions to strengthen their market presence.
- In October 2024, Pfizer Inc. And BioNTech SE announced the launch of their COVID-19 vaccine, Comirnaty, for children aged 5 to 11. This expansion marked a significant milestone in the global fight against the pandemic and further solidified Pfizer and BioNTech's position as leading players in the market (Technavio, 2024).
- In March 2025, Merck & Co. Inc. And IAVI (International AIDS Vaccine Initiative) entered into a technological collaboration to develop a mRNA-based HIV vaccine. This partnership aimed to leverage Merck's expertise in mRNA technology and IAVI's experience in HIV vaccine research and development (Merck & Co. Inc., 2025).
- In July 2024, Sanofi Pasteur and GSK announced their merger, creating a leading global vaccines company. This strategic move was expected to enhance their combined capabilities in research, development, and manufacturing, enabling them to address the growing demand for vaccines against various diseases (Sanofi Pasteur, 2024).
- In November 2025, Johnson & Johnson expanded its vaccine manufacturing capacity by investing USD1.5 billion in a new facility in the United States. This expansion aimed to increase the company's production capabilities for its COVID-19 vaccine and other vaccines, addressing the ongoing global demand for vaccines (Johnson & Johnson, 2025).
Research Analyst Overview
The market continues to evolve as new innovations and advancements emerge, shaping the landscape of preventive care in the healthcare system. Clinical trials for various vaccine types, including recombinant protein, conjugate, subunit, inactivated, live attenuated, mRNA, toxoid, and viral vector vaccines, are ongoing to address vaccine-preventable diseases and bolster pandemic preparedness. Public health initiatives emphasize the importance of adhering to immunization schedules for primary care patients, ensuring optimal protection against infectious diseases. Travel vaccines are also crucial for individuals planning international journeys, safeguarding against diseases endemic to specific regions. Seasonal vaccines play a vital role in preventing the spread of illnesses during seasonal outbreaks, contributing to herd immunity and overall population health.
Vaccine distribution and storage, particularly in the cold chain, are essential components of effective vaccine administration. Epidemiological data and disease surveillance are integral to understanding the ongoing dynamics of vaccine-preventable diseases and informing healthcare providers about the most up-to-date recommendations. Vaccine safety and efficacy are continually monitored, with adverse events carefully documented and investigated to ensure the continuous improvement of vaccine offerings. Pregnant women represent a critical demographic in vaccination efforts, with tailored vaccine schedules designed to protect both mother and child. Vaccine hesitancy, a growing concern in public health, is addressed through education and outreach efforts, emphasizing the importance of vaccines in maintaining a healthy population.
Drug development in the market is a continuous process, with ongoing research and innovation driving the creation of new vaccine types and improvements to existing ones. The role of healthcare providers in vaccine administration and education is crucial in ensuring that individuals receive the appropriate vaccines and understand their importance in maintaining personal and public health. Infectious diseases remain a significant challenge for the healthcare system, with ongoing disease outbreaks requiring swift and effective responses. Vaccines serve as a critical tool in preventing the spread of these diseases and mitigating their impact on public health. In summary, the market is a dynamic and evolving landscape, with ongoing research, innovation, and implementation of new vaccine types and strategies shaping the future of preventive care.
The importance of vaccines in addressing vaccine-preventable diseases, maintaining herd immunity, and ensuring overall population health cannot be overstated.
Dive into Technavio's robust research methodology, blending expert interviews, extensive data synthesis, and validated models for unparalleled Vaccines Market insights. See full methodology.
|
Market Scope |
|
|
Report Coverage |
Details |
|
Page number |
298 |
|
Base year |
2024 |
|
Historic period |
2019-2023 |
|
Forecast period |
2025-2029 |
|
Growth momentum & CAGR |
Accelerate at a CAGR of 23.1% |
|
Market growth 2025-2029 |
USD 160222.3 million |
|
Market structure |
Fragmented |
|
YoY growth 2024-2025(%) |
18.1 |
|
Key countries |
US, Germany, India, UK, France, Canada, China, Japan, Italy, and Brazil |
|
Competitive landscape |
Leading Companies, Market Positioning of Companies, Competitive Strategies, and Industry Risks |
What are the Key Data Covered in this Vaccines Market Research and Growth Report?
- CAGR of the Vaccines industry during the forecast period
- Detailed information on factors that will drive the growth and forecasting between 2025 and 2029
- Precise estimation of the size of the market and its contribution of the industry in focus to the parent market
- Accurate predictions about upcoming growth and trends and changes in consumer behaviour
- Growth of the market across North America, Europe, Asia, and Rest of World (ROW)
- Thorough analysis of the market's competitive landscape and detailed information about companies
- Comprehensive analysis of factors that will challenge the vaccines market growth of industry companies
We can help! Our analysts can customize this vaccines market research report to meet your requirements.
 RIA -
RIA - 
