
Corporate Event Market Size 2025-2029
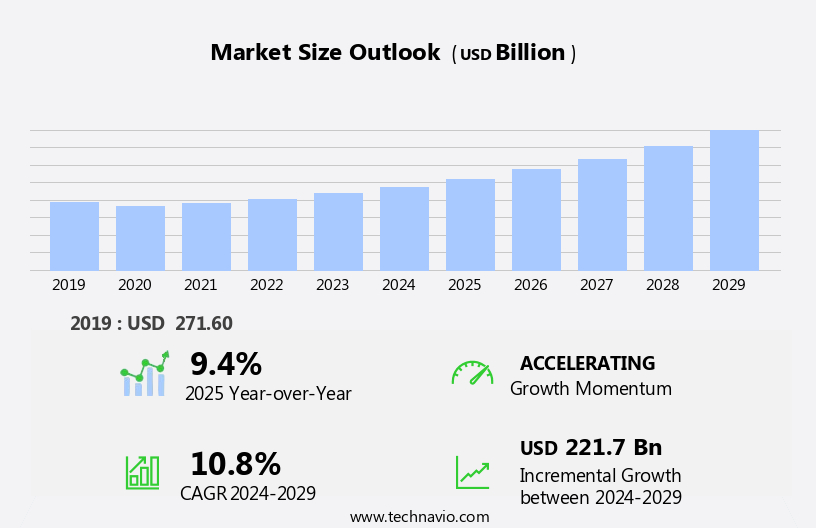
The corporate event market size is forecast to increase by USD 221.7 billion at a CAGR of 10.8% between 2024 and 2029.
- The market is experiencing significant growth due to several key factors. One of the primary drivers is the increasing corporate budgets allocated towards organizing events. Another trend shaping the market is the adoption of artificial intelligence (AI) and machine learning technology for event management, offering enhanced efficiency and personalized experiences. Geopolitical and economic uncertainty also present opportunities for the market, as companies turn to events as a means of building relationships and addressing business challenges. These trends, coupled with the ongoing digital transformation, are expected to shape the future of the market.
What will be the Size of the Corporate Event Market during the Forecast Period?
- The market encompasses a diverse range of activities designed to foster knowledge sharing, team-building, and organizational success. These events include workshops, project-based gatherings, product launches, and conferences, among others. They serve various business objectives, such as networking, brand awareness, and strategic planning. Company culture is strengthened through appreciation dinners, seminars, and leadership engagement programs. Trade shows, exhibitions, and business seminars provide opportunities for business expansion and innovation, while entrepreneurship events ignite new ideas and opportunities. Incentive group activities and training programs cater to professional development and employee motivation. Silent conferences and lunch clubbing encourage introspection and networking in unique settings.
- The strong economic climate has led to an increase in corporate event demand, with companies investing in both traditional and online events. Branded multi-use apps, projection mapping, and foreign direct investment are transforming the event landscape, offering new opportunities for corporate organizations. Overall, the market is a vibrant and evolving sector, driven by the ever-changing needs of businesses and the continuous pursuit of organizational growth.
How is this Corporate Event Industry segmented and which is the largest segment?
The corporate event industry research report provides comprehensive data (region-wise segment analysis), with forecasts and estimates in "USD billion" for the period 2025-2029, as well as historical data from 2019-2023 for the following segments.
- Type
- Conferences
- Trade shows
- Incentive programs
- Company meetings
- Others
- Platform
- Physical events
- Virtual events
- Hybrid events
- Geography
- North America
- Canada
- US
- Europe
- Germany
- UK
- France
- APAC
- China
- Japan
- Singapore
- Middle East and Africa
- South America
- North America
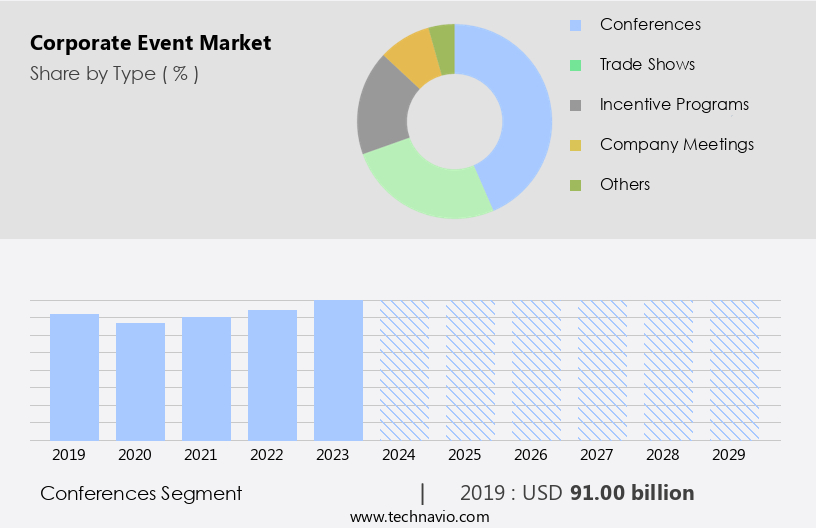
By Type Insights
- The conferences segment is estimated to witness significant growth during the forecast period.
The market encompasses conferences and seminars that serve as crucial platforms for knowledge sharing, networking, and industry discourse. These events cater to diverse audiences, including corporate leaders, employees, and industry experts. Industry conferences, such as the Consumer Electronics Show (CES) and Web Summit, showcase industry trends, technological advancements, and networking opportunities. Business executives, innovators, and thought leaders attend these events to exchange insights, explore innovations, and discuss emerging trends. CES is an annual conference held at the Las Vegas Convention Center in Winchester, Nevada, US, while Web Summit takes place every November at the MEO Arena and Lisbon Exhibition and Congress Centre in Lisbon, Portugal.
Get a glance at the market report of share of various segments Request Free Sample
The conferences segment was valued at USD 91.00 billion in 2019 and showed a gradual increase during the forecast period.
Regional Analysis
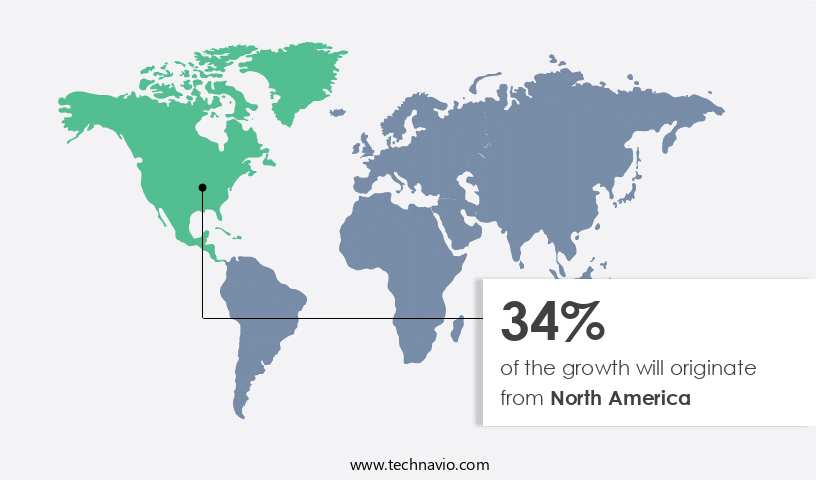
- North America is estimated to contribute 34% to the growth of the global market during the forecast period.
Technavio's analysts have elaborately explained the regional trends and drivers that shape the market during the forecast period.
For more insights on the market share of various regions, Request Free Sample
The North American market is characterized by substantial corporate spending, advanced event infrastructure, and a significant presence of multinational companies. The US dominates the region, hosting a majority of events due to its strong business ecosystem, world-class venues, and high demand for in-person networking opportunities. Canada also plays a crucial role, with major cities like Toronto, Vancouver, and Montreal serving as key event destinations. Notable events such as the Consumer Electronics Show (CES) in Las Vegas, Dreamforce in San Francisco, and Collision in Toronto attract thousands of corporate attendees, exhibitors, and industry leaders.
Market Dynamics
Our researchers analyzed the data with 2024 as the base year, along with the key drivers, trends, and challenges. A holistic analysis of drivers will help companies refine their marketing strategies to gain a competitive advantage.
What are the key market drivers leading to the rise In the adoption of Corporate Event Industry?
Growing corporate budgets is the key driver of the market.
- The market experiences continuous growth as businesses invest more in conferences, trade shows, and networking events to enhance brand visibility, build partnerships, and stimulate business expansion. This trend is fueled by the strategic importance of these events in achieving business objectives. For instance, Apple's annual Worldwide Developers Conference (WWDC) represents substantial corporate investment in events, with an estimated USD 770 million allocated to advertising and marketing efforts in 2023. The WWDC, held from June 10-14, 2024, combined online sessions and an in-person event at Apple Park. Event catering, partner relationships, and hybrid events are key market dynamics. Event marketing, sustainability initiatives, and technology trends are critical factors shaping the corporate event landscape.
- Event sponsorship, attendee segmentation, staffing, and speaker management are essential aspects of event planning and execution. Market competition, event moderator, and stakeholder engagement are critical factors in the corporate event industry. Event technology trends, such as AI in events and machine learning, are transforming the way events are planned and executed. Event profitability, marketing automation, and sustainability are essential considerations for businesses In the market.
What are the market trends shaping the Corporate Event Industry?
AI-powered event management is the upcoming market trend.
- Artificial intelligence (AI) is significantly transforming the market by optimizing various aspects of planning and management. AI technologies, such as chatbots, automated scheduling, personalized attendee experiences, and predictive analytics, are increasingly being adopted to enhance event logistics, improve attendee engagement, and develop effective event strategies. AI-driven chatbots are revolutionizing attendee support by offering instant, self-serve assistance. These chatbots can handle a multitude of inquiries, from event details to registration concerns, thereby reducing the workload on event staff. Automated scheduling tools, powered by AI, efficiently manage event timelines, ensuring that sessions, meetings, and activities are coordinated seamlessly. Personalized attendee experiences are another key application of AI in events.
- AI algorithms analyze attendee data to create customized schedules, recommendations, and content, enhancing overall attendee satisfaction. Predictive analytics, leveraging AI, help event organizers anticipate attendee needs and preferences, enabling them to tailor the event to their audience. Moreover, AI is also being used to optimize event budgets, manage event risks, and improve stakeholder engagement. Event management software equipped with AI capabilities streamlines the registration process, manages the event agenda, and facilitates effective communication between event planners, speakers, and attendees. AI-driven event technology trends, such as virtual event platforms, ticket purchase systems, and event app development, are also gaining popularity In the market.
What challenges does the Corporate Event Industry face during its growth?
Geopolitical and economic uncertainty is a key challenge affecting the industry growth.
- The market encounters numerous challenges due to geopolitical and economic instability. Political unrest, trade restrictions, and economic downturns can significantly impact international business travel and event planning. Events are subject to various risks, including visa restrictions, fluctuating currencies, and differing regulatory requirements across regions. Political instability can lead to last-minute cancellations or postponements, causing financial losses. For instance, on December 4, 2024, major Korean business lobbies and private companies, such as the Federation of Korean Industries (FKI) and MBK Partners, altered their scheduled corporate events due to escalating political tensions following President Yoon Suk Yeol's failed martial law declaration. Event catering, partner relationships, and client satisfaction remain crucial in this dynamic market.
- Hybrid events, combining in-person and virtual components, have become increasingly popular due to their flexibility and accessibility. Event marketing, branding, and attendee engagement are essential elements of successful events. Event technology, including virtual event platforms, event registration software, and event management tools, plays a significant role in enhancing the attendee experience and streamlining event planning. Event sustainability initiatives, such as reducing waste and carbon footprint, are gaining importance. Event security, speaker management, and risk management are vital aspects of event execution.
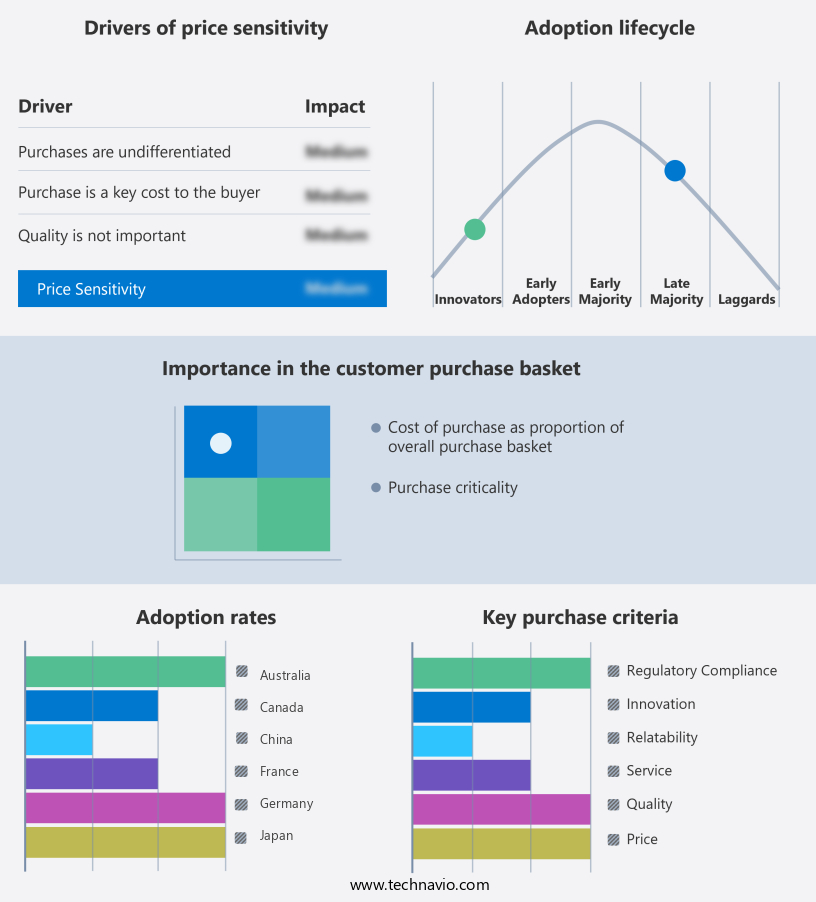
Exclusive Customer Landscape
The corporate event market forecasting report includes the adoption lifecycle of the market, covering from the innovator's stage to the laggard's stage. It focuses on adoption rates in different regions based on penetration. Furthermore, the corporate event market report also includes key purchase criteria and drivers of price sensitivity to help companies evaluate and develop their market growth analysis strategies.
Customer Landscape
Key Companies & Market Insights
Companies are implementing various strategies, such as strategic alliances, corporate event market forecast, partnerships, mergers and acquisitions, geographical expansion, and product/service launches, to enhance their presence In the industry.
360 Destination Group - The company offers corporate event services such as escape games in New York City or Jeep tours in Ojai which is crafted tours that feel less like an add-on and more like an integral part of event production.
The industry research and growth report includes detailed analyses of the competitive landscape of the market and information about key companies, including:
- Access Destination Services
- BCD Meetings and Events
- BI WORLDWIDE
- Cor-Events LLC
- Creative Group Inc.
- CWT
- Draper Management Co.
- Eventique
- Events Unlimited
- FCM Travel Solutions
- Forums Events Inc.
- funfdrei eventagentur GmbH
- GLOBAL PRODUCE CO. LTD.
- HJT Exhibition Shanghai Co. LTD.
- ITA Group
- Maritz Holdings Inc.
- Reed Exhibitions Ltd.
- Thats Innovative Pte Ltd.
- The Webster Group
Qualitative and quantitative analysis of companies has been conducted to help clients understand the wider business environment as well as the strengths and weaknesses of key industry players. Data is qualitatively analyzed to categorize companies as pure play, category-focused, industry-focused, and diversified; it is quantitatively analyzed to categorize companies as dominant, leading, strong, tentative, and weak.
Research Analyst Overview
Corporate events continue to play a pivotal role in fostering business relationships and driving growth in the global business landscape. These events, which encompass a wide range of formats from in-person gatherings to hybrid and virtual events, serve as platforms for showcasing a company's brand, engaging stakeholders, and motivating employees. Partnerships have become a cornerstone of successful events. Collaborating with strategic business partners can help expand reach, enhance the event experience, and share resources and expertise. In turn, these relationships can lead to increased revenue opportunities and long-term business growth. Hybrid events have emerged as a popular choice In the event industry, offering the benefits of both in-person and virtual experiences.
The corporate event market is a dynamic and evolving industry, encompassing a wide range of services and offerings. From event planning and design to speaker selection and entertainment, the goal is to create successful and memorable experiences for clients and their stakeholders. Central to this process is effective event evaluation and feedback collection, allowing for continuous improvement and enhanced attendee engagement. Event planning services cover everything from event budget management and vendor selection to event registration process and accessibility. Event insurance, risk management, and legal compliance are crucial elements, ensuring peace of mind for clients and protecting against unforeseen circumstances. Speaker management and selection, as well as business partner and agency relationships, are vital for securing top talent and fostering collaborative partnerships.
Virtual event platforms, hybrid event strategies, and event marketing automation are increasingly popular trends, enabling more inclusive and accessible events. Sustainability in events, from event design to attendee behavior, is another key focus area. Event data analytics and content creation are essential for effective communication and engagement, while QA and event budget management ensure a seamless event experience. Event entertainment, networking opportunities, and attendee engagement strategies further enhance the overall event success. Startup events and SMEs also benefit from these services, offering opportunities for growth and innovation. Event platform comparison and hybrid event trends continue to shape the industry, with a focus on creating engaging, accessible, and sustainable experiences for all.
In addition, this format allows organizations to engage a larger and more diverse audience while maintaining the personal touch of traditional events. Hybrid events also provide greater flexibility in terms of location, schedule, and budget. Event marketing has evolved to become an essential component of corporate events. Effective event marketing strategies help generate buzz, attract attendees, and maximize ROI. This can include targeted digital campaigns, influencer partnerships, and creative event branding. The event theme plays a crucial role in setting the tone and atmosphere for any corporate event. A well-planned theme can help create a memorable experience for attendees and align with a company's brand identity.
Furthermore, sustainability is an increasingly important consideration In the event industry. Implementing eco-friendly practices, such as using renewable energy sources, reducing waste, and implementing virtual elements, can help minimize the environmental impact of events while also demonstrating a company's commitment to corporate social responsibility. Event decor plays a significant role in creating an enriching and engaging event experience. Careful planning and execution can help transform a space and set the stage for a successful event. Event security is a critical aspect of event planning, ensuring the safety and well-being of attendees, speakers, and staff. Implementing strong security measures can help mitigate risks and create a secure environment for all involved.
Moreover, event registration is a crucial part of the event planning process. A seamless registration process can help attract attendees, manage capacity, and streamline logistics. The event agenda is a key component of any successful corporate event. A well-planned agenda can help keep attendees engaged and ensure that all objectives are met. Event speakers are an essential part of many corporate events. Careful speaker selection and management can help attract high-profile attendees, generate buzz, and deliver valuable insights and expertise. Event photography and videography help capture the essence of an event and provide lasting memories for attendees.
|
Market Scope |
|
|
Report Coverage |
Details |
|
Page number |
211 |
|
Base year |
2024 |
|
Historic period |
2019-2023 |
|
Forecast period |
2025-2029 |
|
Growth momentum & CAGR |
Accelerate at a CAGR of 10.8% |
|
Market growth 2025-2029 |
USD 221.7 billion |
|
Market structure |
Fragmented |
|
YoY growth 2024-2025(%) |
9.4 |
|
Key countries |
US, Germany, UK, China, Singapore, France, Australia, Canada, Japan, and UAE |
|
Competitive landscape |
Leading Companies, market growth and forecasting, Market Positioning of Companies, Competitive Strategies, and Industry Risks |
What are the Key Data Covered in this Corporate Event Market Research and Growth Report?
- CAGR of the Corporate Event industry during the forecast period
- Detailed information on factors that will drive the growth and forecasting between 2025 and 2029
- Precise estimation of the size of the market and its contribution of the industry in focus to the parent market
- Accurate predictions about upcoming growth and trends and changes in consumer behaviour
- Growth of the market across North America, Europe, APAC, Middle East and Africa, and South America
- Thorough analysis of the market's competitive landscape and detailed information about companies
- Comprehensive analysis of factors that will challenge the corporate event market growth of industry companies
We can help! Our analysts can customize this corporate event market research report to meet your requirements.
 RIA -
RIA - 
