
Corporate Net-Zero Strategy Consulting Market Size and Growth Forecast 2026-2030
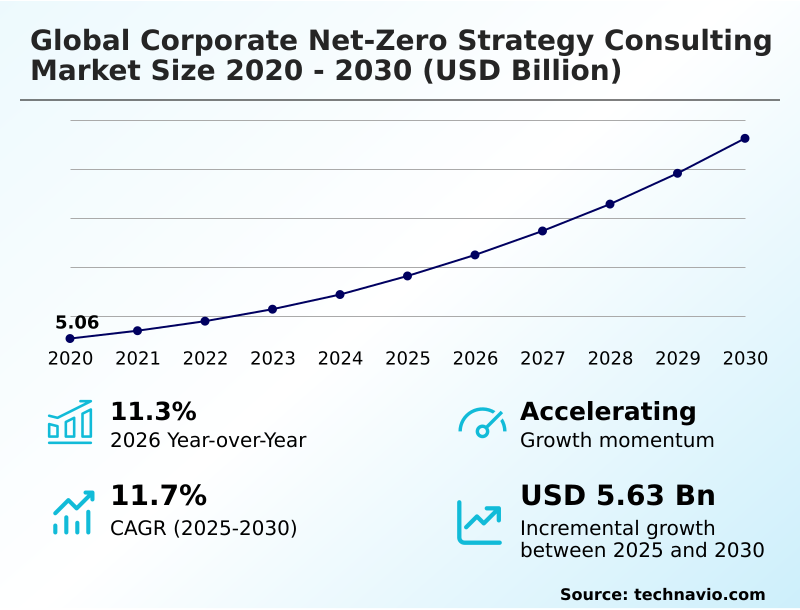
The Corporate Net-Zero Strategy Consulting Market size was valued at USD 7.62 billion in 2025 growing at a CAGR of 11.7% during the forecast period 2026-2030.
North America accounts for 30.9% of incremental growth during the forecast period. The Strategy development segment by Type was valued at USD 2.05 billion in 2024, while the Energy and utilities segment holds the largest revenue share by End-user.
The market is projected to grow by USD 8.19 billion from 2020 to 2030, with USD 5.63 billion of the growth expected during the forecast period of 2025 to 2030.
Get Key Insights on Market Forecast (PDF) Request Free Sample
Corporate Net-Zero Strategy Consulting Market Overview
The corporate net-zero strategy consulting market is expanding at a significant rate, with year-over-year growth exceeding 11.3%, driven by the convergence of regulatory mandates and investor pressures. In North America, which accounts for 30.9% of the market's incremental growth, firms are compelled to transform climate pledges into actionable operational plans. This involves developing a robust corporate climate strategy that moves beyond compliance. Consultants provide critical expertise in decarbonization pathway modeling, utilizing standards like the greenhouse gas (ghg) protocol for accurate emissions accounting. A key service includes conducting a detailed life cycle assessment (lca) for products to identify carbon hotspots. In practice, a multinational consumer goods company will engage advisors to structure a large-scale renewable power purchase agreement (ppa) for its manufacturing sites, a move that directly reduces Scope 2 emissions. This expertise becomes essential as mandates like the corporate sustainability reporting directive (csrd) in Europe require auditable data on climate performance, making third-party strategic guidance a core component of risk management and long-term value creation.
Drivers, Trends, and Challenges in the Corporate Net-Zero Strategy Consulting Market
Navigating the path to net-zero presents distinct challenges and opportunities across sectors, pushing firms to seek specialized advisory. For industrial players, developing scope 3 emissions reduction strategies for manufacturing is a primary focus, as it directly impacts competitiveness under frameworks like the EU's Carbon Border Adjustment Mechanism.
For instance, an automotive supplier aiming to manage cbam compliance for exporters to the eu must implement rigorous material traceability and energy efficiency programs. This process is far more complex than for a service-based company.
The cost of net-zero transition for the energy sector, for example, is several orders of magnitude higher than for the IT sector due to asset-intensive infrastructure overhauls. Tax incentives, such as those within the US Inflation Reduction Act (IRA) of 2022, are critical for making investments in green hydrogen or CCUS economically viable.
Another key area involves integrating climate risk into financial reporting tcfd, which is now a board-level concern. Even smaller businesses face pressure, with a growing need for guidance on developing science-based net-zero targets for smes to remain viable partners in decarbonized supply chains.
The overarching challenges in corporate net-zero strategy implementation, from data acquisition to talent shortages, underscore the critical role of expert consulting in translating climate goals into operational reality.
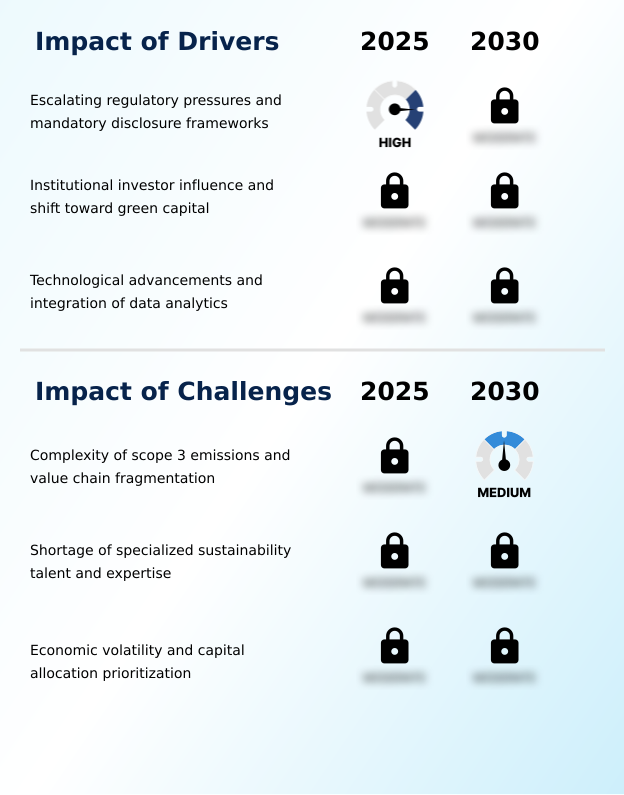
Primary Growth Driver: Escalating regulatory pressures and the expansion of mandatory disclosure frameworks are primary catalysts for market expansion.
Investor influence is a powerful market driver, with a year-over-year growth of over 11% fueled by capital allocation decisions tied to ESG factors.
Institutional investors now demand clear pathways to net-zero, requiring portfolio companies to conduct detailed financed emissions calculation and transition risk analysis.
This pressure makes access to capital contingent on a mature sustainability profile, spurring demand for green bond framework advisory and sustainability-linked loan advisory services. In response, consulting engagements increasingly include decarbonization technology assessment to identify cost-effective interventions.
Firms are also deploying sophisticated esg data management platform solutions to automate data collection and improve the accuracy of reporting, ensuring they can build trust with shareholders and signal a commitment to long-term value creation in a decarbonizing financial ecosystem.
Emerging Market Trend: A primary market trend is the strategic shift toward comprehensive supply chain decarbonization. This involves a profound emphasis on measuring and optimizing Scope 3 emissions across the entire value chain.
Corporate strategies are expanding beyond direct emissions to integrate social equity and nature-positive outcomes. This pivot involves a focus on implementing a just transition strategy, which includes workforce retraining and social impact assessments to manage the human dimension of decarbonization.
Simultaneously, there's a convergence of carbon reduction with biodiversity goals, leading to the adoption of nature-based solutions (nbs) like reforestation and regenerative agriculture. Procurement of high-quality offsets with verifiable co-benefits requires enhanced carbon credit integrity and expert voluntary carbon market (vcm) advisory.
Firms now conduct a thorough biodiversity impact assessment to align with frameworks like the Taskforce on Nature-related Financial Disclosures (TNFD), reflecting a more holistic view of sustainability that balances internal decarbonization with external investments in natural capital.
Key Industry Challenge: The inherent complexity of measuring Scope 3 emissions, compounded by significant value chain fragmentation, presents a formidable challenge to market growth.
The complexity of scope 3 emissions, which can constitute over 70% of a company's total environmental impact, remains a significant market challenge. Effective value chain decarbonization is hindered by fragmented data from thousands of suppliers, making accurate supply chain emissions tracking an arduous task.
This often forces reliance on secondary estimates for product carbon footprinting, which lack the precision for robust strategic planning. The absence of standardized reporting practices complicates carbon footprint verification and the ability to present a holistic view of climate impact.
This data gap necessitates specialized environmental compliance consulting to navigate inconsistencies, but the logistical complexity and resource intensity of engaging global partners can deter companies from pursuing comprehensive net-zero targets and achieving full transparency in their reporting.
Explore Full Market Dynamics Analysis Request Free Sample
Corporate Net-Zero Strategy Consulting Market Segmentation
The corporate net-zero strategy consulting industry research report provides comprehensive data including region-wise segment analysis, with forecasts and analysis for the period 2026-2030, as well as historical data from 2020-2024 for the following segments.
Type Segment Analysis
The strategy development segment is estimated to witness significant growth during the forecast period.
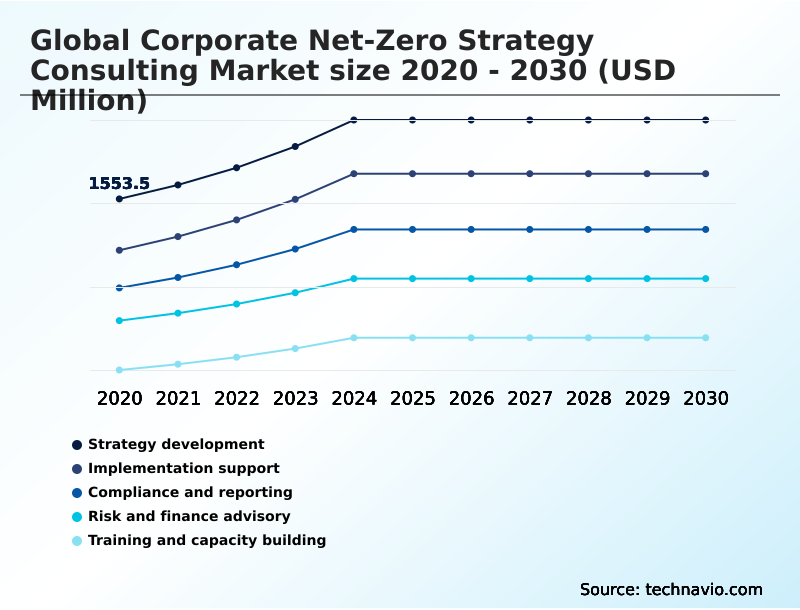
The strategy development segment remains the foundational pillar of the corporate net-zero strategy consulting market, commanding the largest share of service engagements. This phase involves creating a comprehensive climate transition plan that aligns long-term corporate objectives with international benchmarks.
Consultants provide specialized knowledge for net-zero roadmap development and decarbonization pathway modeling, assisting organizations in defining goals validated by frameworks like the science-based targets initiative (sbti). This process includes assessing the current carbon footprint and establishing interim targets.
A core component is the formulation of a corporate climate strategy that integrates environmental leadership with brand equity and market positioning, transforming regulatory requirements into a strategic shift in the global economic paradigm.
This ensures the initial strategy provides clear direction for subsequent implementation efforts.
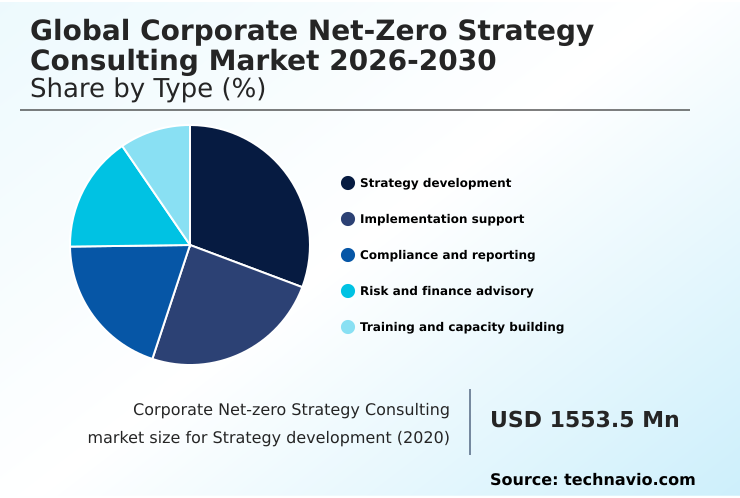
The Strategy development segment was valued at USD 2.05 billion in 2024 and showed a gradual increase during the forecast period.
Corporate Net-Zero Strategy Consulting Market by Region: North America Leads with 30.9% Growth Share
North America is estimated to contribute 30.9% to the growth of the global market during the forecast period.
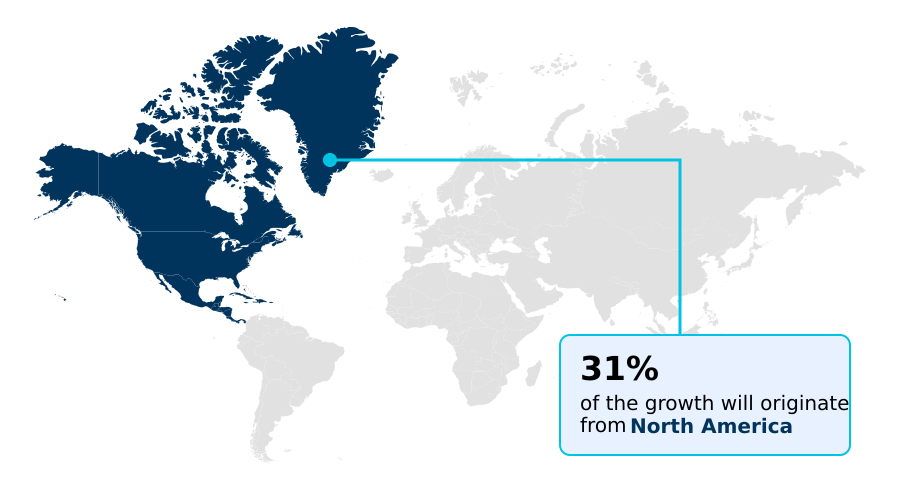
The geographic landscape of the corporate net-zero strategy consulting market is characterized by distinct regional priorities. North America, contributing nearly 31% of the opportunity, focuses on technology-driven sectoral decarbonization and physical climate risk assessment.
Europe, representing almost 28%, is defined by a robust policy environment, with demand for advisory on the carbon border adjustment mechanism (cbam) and circular economy principles.
The APAC region, the fastest-growing market at over 28% of the opportunity, is centered on the energy transition in manufacturing hubs and developing a sustainable procurement policy.
Across all regions, corporations are engaging consultants for climate resilience planning to protect assets from environmental shocks and align with increasingly stringent international standards, adapting strategies to diverse regulatory and economic contexts.
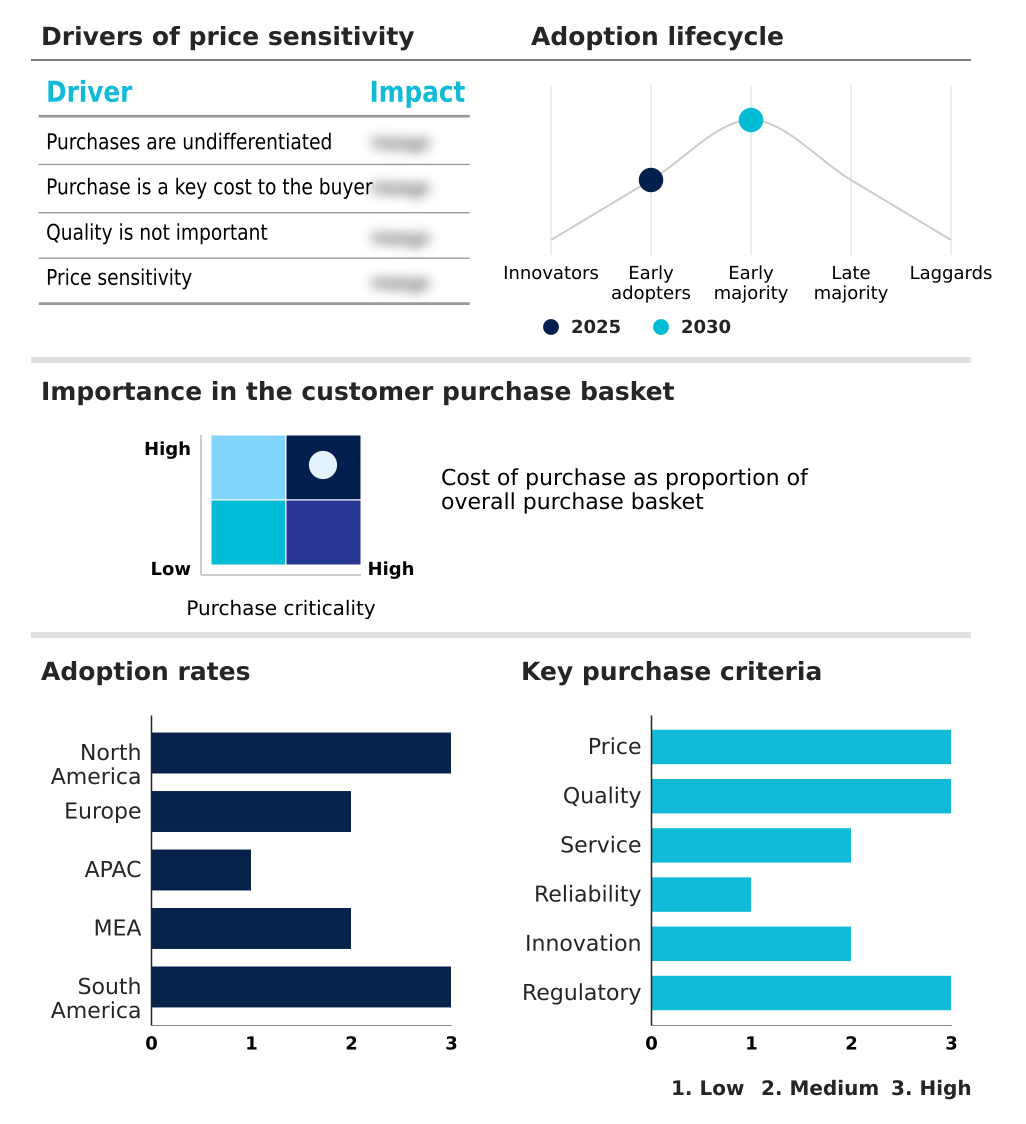
Customer Landscape Analysis for the Corporate Net-Zero Strategy Consulting Market
The corporate net-zero strategy consulting market forecasting report includes the adoption lifecycle of the market, covering from the innovator’s stage to the laggard’s stage. It focuses on adoption rates in different regions based on penetration. Furthermore, the corporate net-zero strategy consulting market report also includes key purchase criteria and drivers of price sensitivity to help companies evaluate and develop their market growth analysis strategies.
Competitive Landscape of the Corporate Net-Zero Strategy Consulting Market
Companies are implementing various strategies, such as strategic alliances, partnerships, mergers and acquisitions, geographical expansion, and product/service launches, to enhance their presence in the corporate net-zero strategy consulting market industry.
A.T. Kearney Inc. - Technology-led solutions leverage AI and cloud computing to decarbonize operations and supply chains, supporting data-driven net-zero strategies.
The industry research and growth report includes detailed analyses of the competitive landscape of the market and information about key companies, including:
- A.T. Kearney Inc.
- Accenture Plc
- AECOM
- AlixPartners LLP
- Anthesis Consulting Group
- Arcadis N.V.
- Bain and Co. Inc.
- Bharat Carbon, Inc.
- Boston Consulting Group Inc.
- Capgemini SE
- ERM Group Inc.
- Ernst and Young Global Ltd.
- KPMG International Ltd.
- McKinsey and Co.
- PricewaterhouseCoopers LLP
- Ramboll Group AS
- Roland Berger GmbH
- RPS Group Plc
- South Pole
- WSP Global Inc.
Qualitative and quantitative analysis of companies has been conducted to help clients understand the wider business environment as well as the strengths and weaknesses of key industry players. Data is qualitatively analyzed to categorize companies as pure play, category-focused, industry-focused, and diversified; it is quantitatively analyzed to categorize companies as dominant, leading, strong, tentative, and weak.
Recent Developments in the Corporate Net-Zero Strategy Consulting Market
- In May 2025, Asuene announced its acquisition of carbon management and accounting platform nZero, a strategic move to expand its presence in the North American market and strengthen its position in the U.S. greentech sector.
- In July 2025, Allianz Commercial announced the launch of Climate Adaptation and Resilience Services (CAReS), a new platform designed to help companies identify, assess, and mitigate climate-related risks impacting their operational resilience.
- In October 2025, Menzies announced the acquisition of Grain Sustainability to enhance its environmental, social, and governance (ESG) advisory capabilities, focusing on ESG reporting, compliance, and net-zero strategy development for clients.
- In December 2025, osapiens announced the acquisition of Lucent AI, a Berlin-based startup focused on AI risk management solutions, to expand its expertise in financial risk management, compliance automation, and AI-driven decision support.
Research Analyst Overview: Corporate Net-Zero Strategy Consulting Market
The operationalization of net-zero commitments is intensifying, compelling boards to move from ambition to execution. Decision-makers are increasingly focused on the financial implications of decarbonization, directly linking climate transition plan development to capital allocation and risk management frameworks like the task force on climate-related financial disclosures (tcfd).
This shift requires a granular approach to scope 3 emissions accounting and value chain decarbonization. Consultants are now critical for conducting detailed transition risk analysis and physical climate risk assessment, informing strategies that are both resilient and financially viable.
The selection of interventions, from deploying carbon capture utilization and storage (ccus) in heavy industry to procuring sustainable aviation fuel (saf) for logistics, is guided by sophisticated decarbonization pathway modeling.
Furthermore, as scrutiny over environmental claims grows, ensuring carbon credit integrity and conducting thorough biodiversity impact assessment are becoming standard components of corporate governance, moving beyond simple compliance to strategic differentiation.
Dive into Technavio’s robust research methodology, blending expert interviews, extensive data synthesis, and validated models for unparalleled Corporate Net-Zero Strategy Consulting Market insights. See full methodology.
| Market Scope | |
|---|---|
| Page number | 305 |
| Base year | 2025 |
| Historic period | 2020-2024 |
| Forecast period | 2026-2030 |
| Growth momentum & CAGR | Accelerate at a CAGR of 11.7% |
| Market growth 2026-2030 | USD 5626.8 million |
| Market structure | Fragmented |
| YoY growth 2025-2026(%) | 11.3% |
| Key countries | US, Canada, Mexico, Germany, UK, France, Italy, The Netherlands, Spain, China, India, Japan, Australia, South Korea, Indonesia, Saudi Arabia, UAE, South Africa, Israel, Turkey, Brazil, Argentina and Colombia |
| Competitive landscape | Leading Companies, Market Positioning of Companies, Competitive Strategies, and Industry Risks |
Corporate Net-Zero Strategy Consulting Market: Key Questions Answered in This Report
-
What is the expected growth of the Corporate Net-Zero Strategy Consulting Market between 2026 and 2030?
-
The Corporate Net-Zero Strategy Consulting Market is expected to grow by USD 5.63 billion during 2026-2030, registering a CAGR of 11.7%. Year-over-year growth in 2026 is estimated at 11.3%%. This acceleration is shaped by escalating regulatory pressures and mandatory disclosure frameworks, which is intensifying demand across multiple end-use verticals covered in the report.
-
-
What segmentation does the market report cover?
-
The report is segmented by Type (Strategy development, Implementation support, Compliance and reporting, Risk and finance advisory, and Training and capacity building), End-user (Energy and utilities, Manufacturing, IT and telecom, Healthcare, and Others), Application (Large enterprises, and SMEs) and Geography (North America, Europe, APAC, Middle East and Africa, South America). Among these, the Strategy development segment is estimated to witness significant growth during the forecast period, driven by rising adoption across key application areas. Each segment includes detailed qualitative and quantitative analysis, along with historical data from 2020-2024 and forecasts through 2030 with year-over-year growth rates.
-
-
Which regions are analyzed in the report?
-
The report covers North America, Europe, APAC, Middle East and Africa and South America. North America is estimated to contribute 30.9% to market growth during the forecast period. Country-level analysis includes US, Canada, Mexico, Germany, UK, France, Italy, The Netherlands, Spain, China, India, Japan, Australia, South Korea, Indonesia, Saudi Arabia, UAE, South Africa, Israel, Turkey, Brazil, Argentina and Colombia, with dedicated market size tables and year-over-year growth for each.
-
-
What are the key growth drivers and market challenges?
-
The primary driver is escalating regulatory pressures and mandatory disclosure frameworks, which is accelerating investment and industry demand. The main challenge is complexity of scope 3 emissions and value chain fragmentation, creating operational barriers for key market participants. The report quantifies the impact of each driver and challenge across 2026 and 2030 with comparative analysis.
-
-
Who are the major players in the Corporate Net-Zero Strategy Consulting Market?
-
Key vendors include A.T. Kearney Inc., Accenture Plc, AECOM, AlixPartners LLP, Anthesis Consulting Group, Arcadis N.V., Bain and Co. Inc., Bharat Carbon, Inc., Boston Consulting Group Inc., Capgemini SE, ERM Group Inc., Ernst and Young Global Ltd., KPMG International Ltd., McKinsey and Co., PricewaterhouseCoopers LLP, Ramboll Group AS, Roland Berger GmbH, RPS Group Plc, South Pole and WSP Global Inc.. The report provides qualitative and quantitative analysis categorizing companies as dominant, leading, strong, tentative, and weak based on their market positioning. Company profiles include business segment analysis, SWOT assessment, key offerings, and recent strategic developments.
-
Corporate Net-Zero Strategy Consulting Market Research Insights
Corporate sustainability governance is shifting from voluntary action to a core business imperative, driven by regulations like the corporate sustainability reporting directive (csrd). This mandate compels firms to enhance their ghg inventory management and provide auditable climate-related financial disclosure. As a result, companies are seeking expert environmental compliance consulting to navigate complex legal landscapes.
In a typical engagement, a manufacturing firm utilizes a specialized esg data management platform to automate the collection of sustainability performance metrics across its global facilities. This not only ensures compliance but also provides the data needed for credible carbon neutrality certification.
The demand for such strategic services is amplified as organizations recognize that robust climate action is integral to maintaining access to capital and securing a competitive market position.
We can help! Our analysts can customize this corporate net-zero strategy consulting market research report to meet your requirements.
 RIA -
RIA - 
