
Carbon Credit Market Size 2026-2030
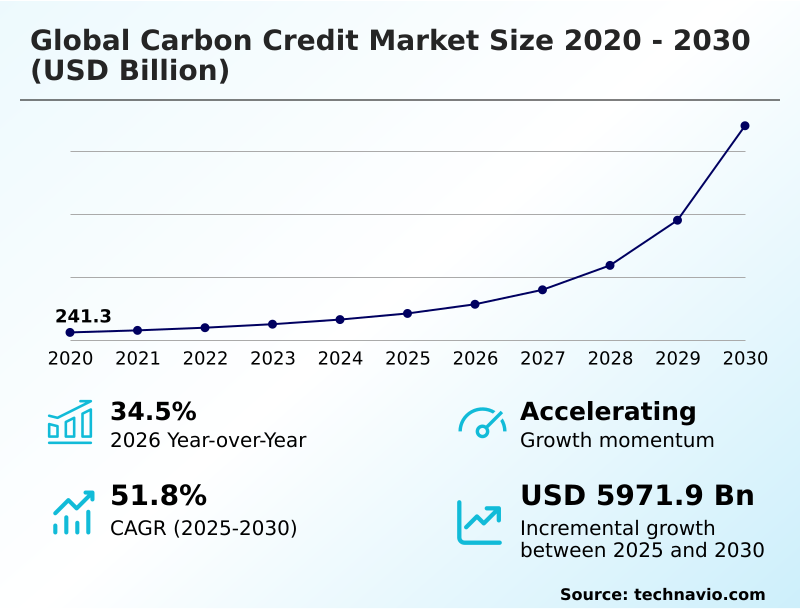
The carbon credit market size is valued to increase by USD 5971.9 billion, at a CAGR of 51.8% from 2025 to 2030. Corporate sustainability mandates and supply chain integration will drive the carbon credit market.
Major Market Trends & Insights
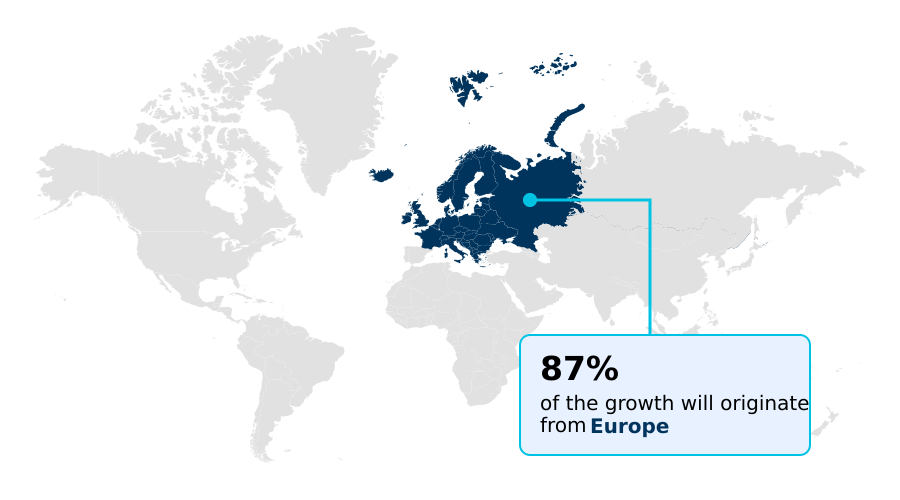
- Europe dominated the market and accounted for a 87.4% growth during the forecast period.
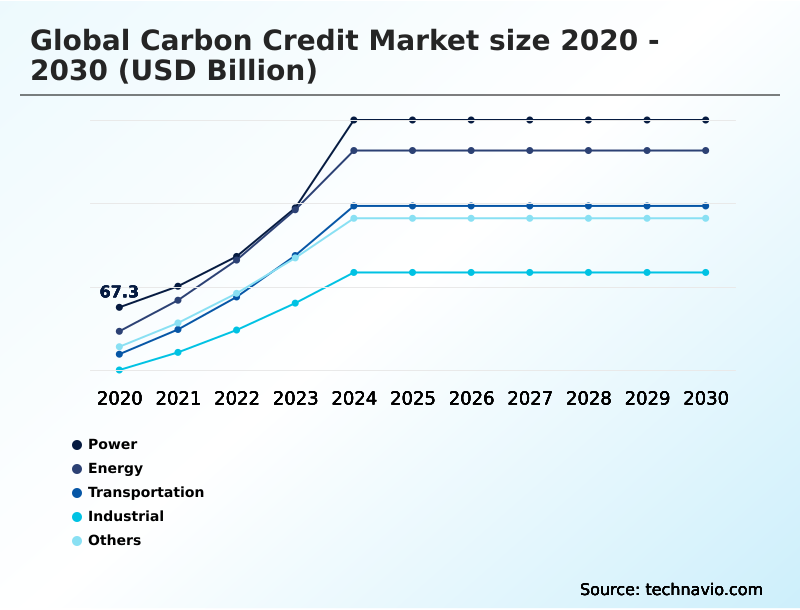
- By End-user - Power segment was valued at USD 170.4 billion in 2024
- By Type - Compliance segment accounted for the largest market revenue share in 2024
Market Size & Forecast
- Market Opportunities: USD 6575.6 billion
- Market Future Opportunities: USD 5971.9 billion
- CAGR from 2025 to 2030 : 51.8%
Market Summary
- The carbon credit market provides a structured mechanism for entities to manage and neutralize greenhouse gas emissions through carbon offsetting. It operates through two primary channels: the regulated compliance market, driven by government mandates like an emissions trading system, and the voluntary market, where corporations pursue net-zero commitments and sustainability goals.
- Key drivers include mounting pressure from stakeholders for transparent climate action and the integration of carbon pricing into corporate financial planning. Trends are shifting toward high-integrity credits, with a strong preference for carbon removal credits over avoidance credits, emphasizing permanence and clear additionality.
- For example, a heavy industrial manufacturer facing a carbon border adjustment mechanism might procure verified emission reduction credits from direct air capture projects to offset its scope one emissions, ensuring its products remain competitive.
- However, the market faces challenges like regulatory fragmentation and the need for standardized carbon credit verification protocols to mitigate greenwashing risk and build investor confidence in this vital environmental asset.
What will be the Size of the Carbon Credit Market during the forecast period?
Get Key Insights on Market Forecast (PDF) Get Free Sample
How is the Carbon Credit Market Segmented?
The carbon credit industry research report provides comprehensive data (region-wise segment analysis), with forecasts and estimates in "USD billion" for the period 2026-2030, as well as historical data from 2020-2024 for the following segments.
- End-user
- Power
- Energy
- Transportation
- Industrial
- Others
- Type
- Compliance
- Voluntary
- Method
- Reduction projects
- Sequestration projects
- Geography
- Europe
- Germany
- UK
- France
- Asia
- North America
- US
- Canada
- Mexico
- Rest of World (ROW)
- Europe
By End-user Insights
The power segment is estimated to witness significant growth during the forecast period.
The power sector is a critical component of the carbon credit market, as utilities implement a corporate sustainability strategy to meet stringent decarbonization pathway goals.
Power generation firms increasingly use high-quality offsets for climate mitigation, addressing emissions from fossil fuel assets during the transition to renewables.
This reflects a broader trend of using environmental markets platform instruments like carbon removal credits to manage financial risks from carbon pricing. This approach allows for grid stability while adhering to net-zero commitment targets.
The focus is shifting toward durable solutions like direct air capture and nature-based carbon sequestration, with companies diversifying their portfolios.
For instance, strategic acquisitions of carbon removal credits help hedge against future price volatility, with firms reporting up to a 15% reduction in compliance cost fluctuations.
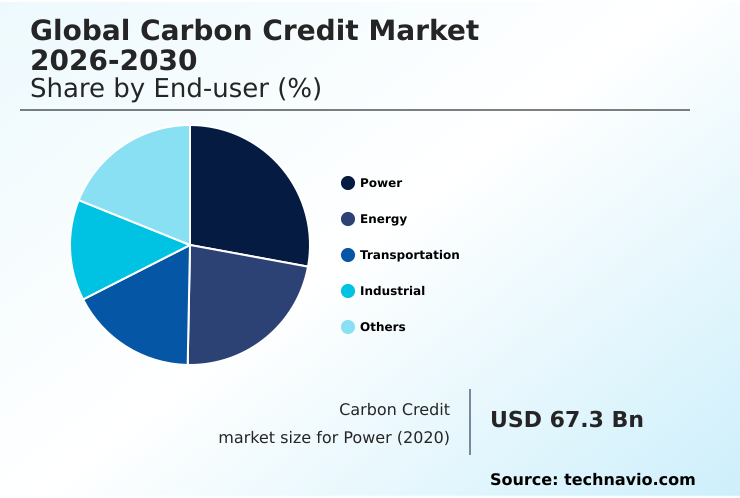
The Power segment was valued at USD 170.4 billion in 2024 and showed a gradual increase during the forecast period.
Regional Analysis
Europe is estimated to contribute 87.4% to the growth of the global market during the forecast period.Technavio’s analysts have elaborately explained the regional trends and drivers that shape the market during the forecast period.
See How Carbon Credit Market Demand is Rising in Europe Get Free Sample
The geographic landscape is dominated by Europe, which is set to capture nearly 87.4% of incremental growth, driven by its mature emissions trading system.
The region's market expansion rate is notably 4.4 percentage points higher than in Asia, reflecting stringent regulations and strong demand for emission reduction credits.
In North America, the voluntary market thrives on corporate demand for nature-based solutions and regenerative agriculture carbon credits, with a focus on high-integrity projects aligned with the verified carbon standard.
Asia is rapidly developing its compliance frameworks, creating opportunities for climate finance investment in renewable energy and reforestation carbon credits.
Supply chain decarbonization initiatives are fueling cross-regional demand, increasing the need for harmonized carbon accounting software and emissions trading scheme linkage to facilitate a global low-carbon economic transition.
Market Dynamics
Our researchers analyzed the data with 2025 as the base year, along with the key drivers, trends, and challenges. A holistic analysis of drivers will help companies refine their marketing strategies to gain a competitive advantage.
- Navigating the global carbon credit market requires a deep understanding of several critical factors. A primary concern for buyers is how to verify carbon credit quality, a process essential for avoiding greenwashing with carbon offsets.
- The market is broadly split between the compliance vs voluntary carbon markets, with the compliance segment being over five times larger in value due to regulatory mandates. The cost of direct air capture credits remains a significant consideration for buyers seeking technological removals, often weighing them against the benefits of nature based carbon solutions like forestry and soil sequestration.
- For corporate strategists, the focus is on integrating credits into esg reporting and determining the best practices for corporate offsetting. Technology plays a pivotal role, with many exploring the role of blockchain in carbon trading to enhance transparency. Businesses are also calculating return on investment for offsets to justify expenditures.
- The impact of policy on credit prices is a constant variable, alongside the challenges scaling carbon removal technology. Other key strategic considerations include measuring co-benefits of forestry projects, using credits for supply chain management, and securing long term carbon credit supply.
- Firms must also navigate carbon credit market liquidity issues and prepare for the future of carbon border adjustment mechanisms while using credits for net zero targets and leveraging digital verification for carbon projects. Finally, integrating carbon credits in circular economy models and fostering regenerative agriculture credit generation are emerging as innovative pathways.
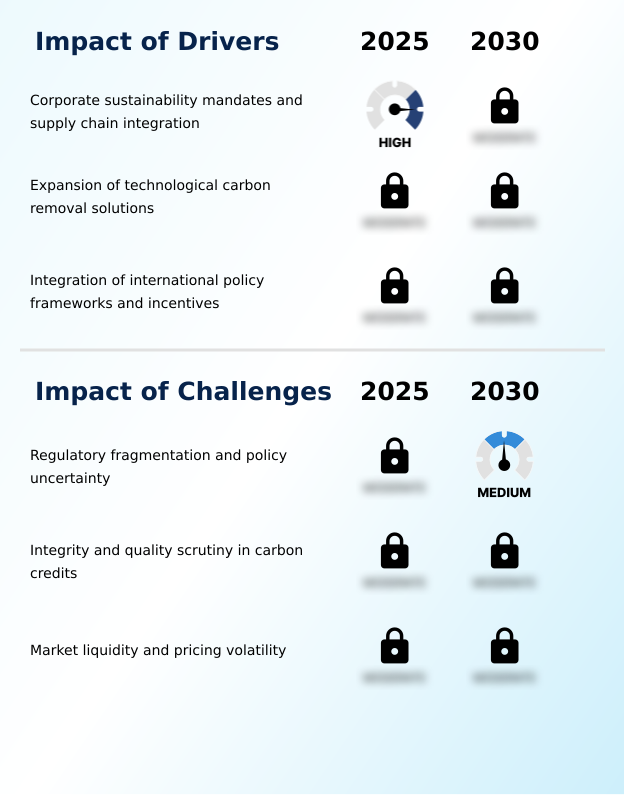
What are the key market drivers leading to the rise in the adoption of Carbon Credit Industry?
- Corporate sustainability mandates and the integration of decarbonization efforts within the supply chain are key drivers of market growth.
- The market is driven by expanding corporate sustainability strategy and the proliferation of science-based targets initiative commitments, boosting both the compliance carbon market and voluntary carbon market.
- The hard-to-abate sectors increasingly rely on credits to meet obligations within a cap and trade program, with some firms reducing overall compliance costs by over 20% through strategic carbon offset project development.
- This has fueled a debate around carbon insetting vs offsetting and the efficacy of carbon avoidance credits. As part of greenwashing risk mitigation, buyers are prioritizing credits that prove the additionality principle.
- This trend has spurred a 40% increase in investment for technological solutions like bioenergy with carbon capture and carbon mineralization, which offer greater permanence and verifiability.
What are the market trends shaping the Carbon Credit Industry?
- A key market trend is the enhancement of nature-based solutions. This is particularly evident through the growing adoption of regenerative agriculture to generate high-quality carbon credits.
- A primary trend is the enhancement of high-integrity carbon credits through advanced digital mrv systems. The use of decentralized ledger technology in carbon credit portfolio management is improving transparency in the carbon offsetting mechanism, with some platforms reducing verification costs by 25%.
- There is a growing focus on insetting practices and carbon farming initiative programs, which not only assist with carbon footprint calculation but also enhance climate resilience planning. These projects, often highlighting co-benefits of carbon projects, can deliver yield increases of up to 10% for agricultural partners.
- This shift prioritizes verifiable outcomes, moving beyond simple offsets to integrated strategies that combine methane capture technology with land stewardship, all underpinned by robust carbon pricing instruments and the greenhouse gas protocol.
What challenges does the Carbon Credit Industry face during its growth?
- Regulatory fragmentation and persistent policy uncertainty present a key challenge affecting the industry's growth trajectory.
- A key challenge is navigating regulatory fragmentation, which complicates the paris agreement article 6 implementation and hinders effective emissions trading scheme linkage. This uncertainty creates permanence risk for long-term projects and makes it difficult for companies to plan for supply chain decarbonization or the impending carbon border adjustment mechanism.
- For industries pursuing carbon neutral shipping or utilizing sustainable aviation fuel offsets, the lack of standardized carbon credit verification protocols can increase administrative costs by up to 30%.
- This complexity also impacts the scaling of regenerative agriculture and the accurate accounting of scope one emissions and scope three emissions, undermining broader climate resilience planning efforts and slowing investment in verifiable emission reduction projects.
Exclusive Technavio Analysis on Customer Landscape
The carbon credit market forecasting report includes the adoption lifecycle of the market, covering from the innovator’s stage to the laggard’s stage. It focuses on adoption rates in different regions based on penetration. Furthermore, the carbon credit market report also includes key purchase criteria and drivers of price sensitivity to help companies evaluate and develop their market growth analysis strategies.
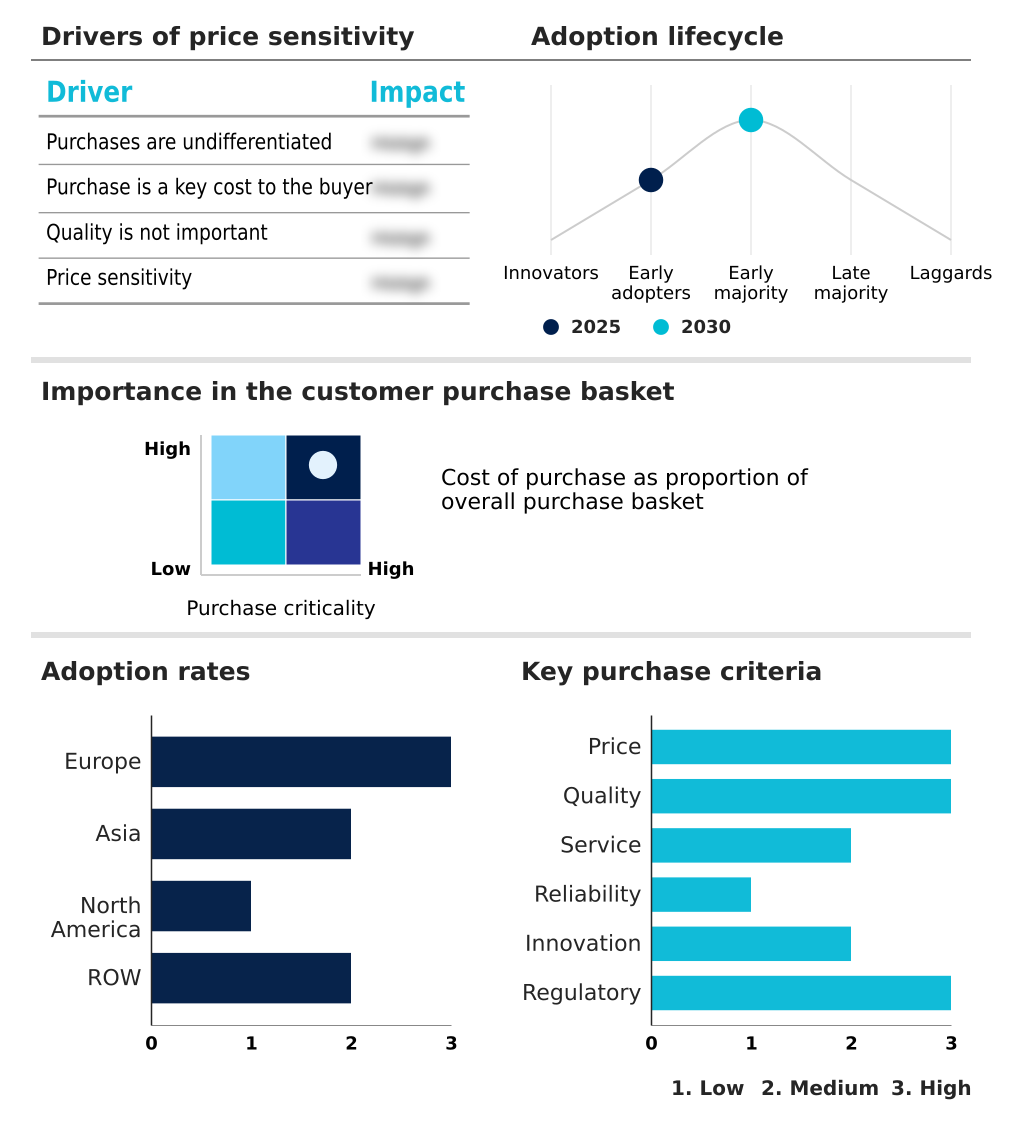
Customer Landscape of Carbon Credit Industry
Competitive Landscape
Companies are implementing various strategies, such as strategic alliances, carbon credit market forecast, partnerships, mergers and acquisitions, geographical expansion, and product/service launches, to enhance their presence in the industry.
1PointFive LLC - Offers durable carbon removal credits from direct air capture with permanent geological storage, supporting robust corporate decarbonization and net-zero strategies.
The industry research and growth report includes detailed analyses of the competitive landscape of the market and information about key companies, including:
- 1PointFive LLC
- 3Degrees Group Inc.
- Anew Climate LLC
- Carbon Credit Capital LLC
- CarbonBetter
- ClearSky Climate Solutions LLC
- Climate Bridge Ltd.
- Climate Impact Partners LLC
- ClimatePartner GmbH
- ClimeCo LLC
- EKI Energy Services Ltd.
- Finite Carbon Corp.
- Microsoft Corp.
- NativeEnergy
- NRG Energy Inc.
- South Pole
- Sterling Planet
- Tasman Environmental Markets
Qualitative and quantitative analysis of companies has been conducted to help clients understand the wider business environment as well as the strengths and weaknesses of key industry players. Data is qualitatively analyzed to categorize companies as pure play, category-focused, industry-focused, and diversified; it is quantitatively analyzed to categorize companies as dominant, leading, strong, tentative, and weak.
Recent Development and News in Carbon credit market
- In August 2024, Meta entered into a significant agreement to purchase nature-based carbon removal credits from a large-scale project in Brazil.
- In November 2024, Equatic initiated a large-scale commercial operation to remove carbon dioxide from the ocean while simultaneously producing green hydrogen.
- In March 2025, Airbus finalized a strategic agreement to secure carbon removal credits to mitigate the environmental footprint of its international aviation operations.
- In October 2024, Sony initiated a partnership to develop a blockchain-based carbon credit management system to ensure the complete traceability of its environmental investments.
Dive into Technavio’s robust research methodology, blending expert interviews, extensive data synthesis, and validated models for unparalleled Carbon Credit Market insights. See full methodology.
| Market Scope | |
|---|---|
| Page number | 291 |
| Base year | 2025 |
| Historic period | 2020-2024 |
| Forecast period | 2026-2030 |
| Growth momentum & CAGR | Accelerate at a CAGR of 51.8% |
| Market growth 2026-2030 | USD 5971.9 billion |
| Market structure | Fragmented |
| YoY growth 2025-2026(%) | 34.5% |
| Key countries | Germany, UK, France, Italy, The Netherlands, Spain, Russia, China, Japan, South Korea, India, Indonesia, Thailand, Singapore, US, Canada, Mexico, UAE, Australia, Brazil, South Africa, Saudi Arabia and Turkey |
| Competitive landscape | Leading Companies, Market Positioning of Companies, Competitive Strategies, and Industry Risks |
Research Analyst Overview
- The carbon credit market is defined by a dual focus on the compliance carbon market and the rapidly evolving voluntary carbon market. Entities are leveraging this environmental asset to advance their decarbonization pathway and fulfill net-zero commitment pledges.
- A key boardroom decision involves budgeting for carbon removal credits, weighing the high-cost, high-permanence of direct air capture and bioenergy with carbon capture against more accessible nature-based solutions like reforestation carbon credits and soil carbon sequestration.
- The integrity of any carbon offsetting mechanism hinges on the additionality principle and mitigating permanence risk, with certifications like the verified carbon standard and gold standard certified becoming baseline requirements for carbon footprint calculation. Digital verification is streamlining this process, reducing validation times by over 30%.
- Projects focusing on blue carbon projects and methane capture technology are gaining traction, while insetting practices and regenerative agriculture offer alternatives for addressing scope three emissions. From carbon neutral shipping to sustainable aviation fuel offsets, the market facilitates climate mitigation across all sectors, driven by carbon pricing instruments within the emissions trading system and cap and trade program frameworks.
What are the Key Data Covered in this Carbon Credit Market Research and Growth Report?
-
What is the expected growth of the Carbon Credit Market between 2026 and 2030?
-
USD 5971.9 billion, at a CAGR of 51.8%
-
-
What segmentation does the market report cover?
-
The report is segmented by End-user (Power, Energy, Transportation, Industrial, and Others), Type (Compliance, and Voluntary), Method (Reduction projects, and Sequestration projects) and Geography (Europe, Asia, North America, Rest of World (ROW))
-
-
Which regions are analyzed in the report?
-
Europe, Asia, North America and Rest of World (ROW)
-
-
What are the key growth drivers and market challenges?
-
Corporate sustainability mandates and supply chain integration, Regulatory fragmentation and policy uncertainty
-
-
Who are the major players in the Carbon Credit Market?
-
1PointFive LLC, 3Degrees Group Inc., Anew Climate LLC, Carbon Credit Capital LLC, CarbonBetter, ClearSky Climate Solutions LLC, Climate Bridge Ltd., Climate Impact Partners LLC, ClimatePartner GmbH, ClimeCo LLC, EKI Energy Services Ltd., Finite Carbon Corp., Microsoft Corp., NativeEnergy, NRG Energy Inc., South Pole, Sterling Planet and Tasman Environmental Markets
-
Market Research Insights
- The carbon credit market's dynamics are increasingly shaped by sophisticated corporate sustainability strategy and the pursuit of high-integrity carbon credits. The integration of digital mrv systems and decentralized ledger technology for blockchain for carbon trading is transforming carbon credit portfolio management, with some platforms reducing credit verification times by over 40%.
- This push for transparency directly addresses greenwashing risk mitigation and enhances the co-benefits of carbon projects. As companies align with the science-based targets initiative, their focus shifts to industrial decarbonization solutions and managing scope 3 emissions reduction.
- Adherence to frameworks like Paris Agreement Article 6 implementation has been shown to improve investor confidence by over 15%, solidifying the role of credits in achieving a low-carbon economic transition.
We can help! Our analysts can customize this carbon credit market research report to meet your requirements.
 RIA -
RIA - 
