
Corporate Skills Taxonomy Platforms Market Size and Growth Forecast 2026-2030
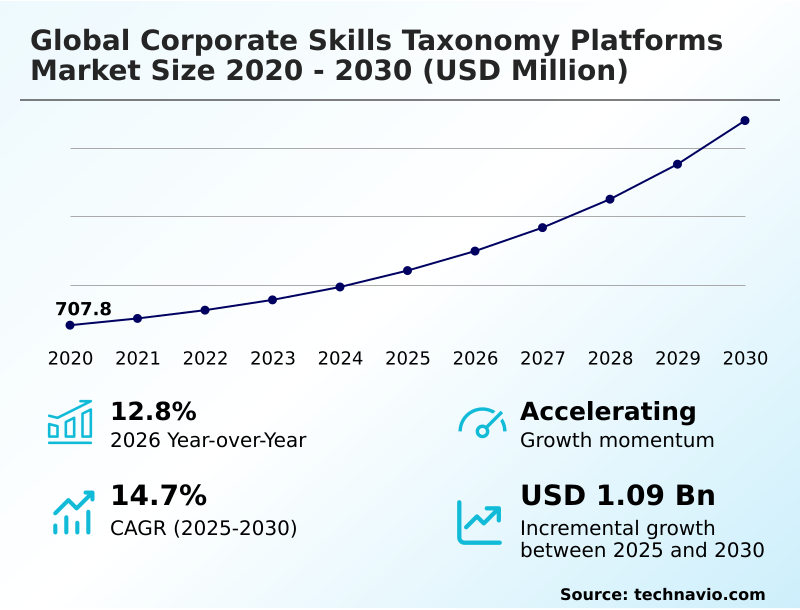
The Corporate Skills Taxonomy Platforms Market size was valued at USD 1.10 billion in 2025 growing at a CAGR of 14.7% during the forecast period 2026-2030.
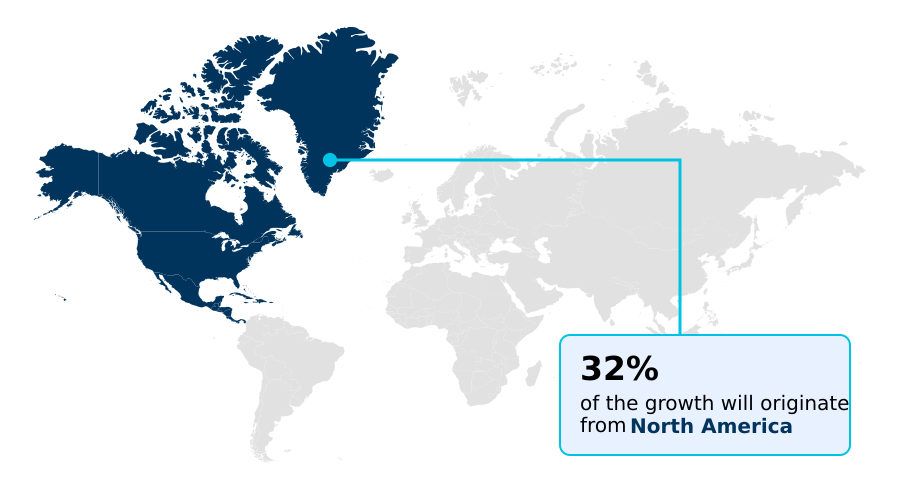
North America accounts for 32.2% of incremental growth during the forecast period. The Cloud segment by Deployment was valued at USD 578.8 million in 2024, while the Large enterprises segment holds the largest revenue share by End-user.
The market is projected to grow by USD 1.49 billion from 2020 to 2030, with USD 1.09 billion of the growth expected during the forecast period of 2025 to 2030.
Get Key Insights on Market Forecast (PDF) Request Free Sample
Corporate Skills Taxonomy Platforms Market Overview
The corporate skills taxonomy platforms market is defined by the enterprise shift from job-based to skills-based organizational structures, a transition showing a 12.8% year-over-year acceleration. This pivot is driven by the need for enhanced talent agility and more effective internal mobility programs. By leveraging AI-powered talent intelligence and a dynamic skill library, companies achieve granular skill gap analysis essential for proactive reskilling and upskilling initiatives. For instance, a multinational manufacturing firm implementing a new robotics production line uses a skills ontology to identify technicians with adjacent competencies in electronics and software, then deploys targeted training modules through its learning experience platform. This proactive approach to employee career development not only prepares the workforce for technological change but also supports talent retention. These platforms are foundational to strategic workforce planning, enabling data-driven decisions that align human capital with long-term business objectives in a rapidly evolving economic landscape.
Drivers, Trends, and Challenges in the Corporate Skills Taxonomy Platforms Market
Strategic adoption of a corporate skills taxonomy platform for enterprises is increasingly viewed as a core component of modern business strategy, moving beyond a simple HR function. Decision-making is driven by the need to integrate skills data with learning management systems to create a cohesive ecosystem for talent development and internal mobility.
The ability to use AI for internal talent mobility and retention directly impacts operational costs, with some firms reporting that filling roles internally is nearly 50% less expensive than external recruitment.
Building a dynamic skills ontology for HR is crucial for compliance with regulations like the General Data Protection Regulation (GDPR), which dictates the ethical considerations of AI in skill assessment.
For example, a global bank uses skills-based workforce planning and analytics software to ensure its project teams meet both skill requirements and diversity goals, a process that is auditable and transparent.
The ROI of implementing a talent marketplace platform becomes evident when organizations can rapidly deploy cross-functional teams to address new market opportunities, linking skills intelligence for strategic business goals directly to revenue generation.
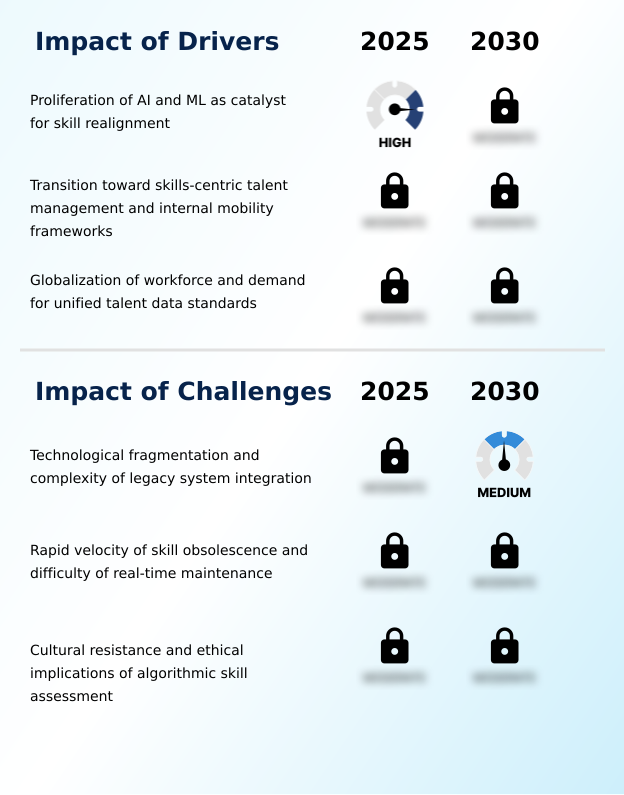
Primary Growth Driver: The proliferation of AI and ML serves as a primary catalyst for skill realignment, driving the adoption of platforms that can map and manage new workforce competencies.
The proliferation of AI and ML is the principal driver for the market, compelling organizations to adopt skills-based hiring and undertake large-scale reskilling and upskilling programs.
The integration of generative AI in HR has amplified this urgency, creating demand for platforms that can define and track new competencies related to AI interaction and management.
As companies transition to a skills-based organization model, these platforms provide the AI-powered talent intelligence needed for effective talent acquisition and management.
This shift is not merely technological but strategic, enabling firms to build more agile and resilient workforces capable of adapting to continuous disruption.
The focus has moved from traditional qualifications to verifiable skills, making these platforms essential for modern human capital strategy.
Emerging Market Trend: A key trend is the integration of dynamic labor market intelligence into taxonomy architectures. This allows organizations to maintain real-time alignment with evolving industry skill requirements.
The market is advancing toward the integration of real-time labor market data directly into corporate taxonomies. This allows organizations to dynamically align internal competency framework design with external industry demands, a critical capability in high-velocity sectors.
A significant trend involves the use of blockchain for credentials and decentralized skill verification, which establishes an immutable and trustworthy record of an employee's competencies, enhancing talent mobility. Concurrently, there is a heightened focus on regulatory compliance and algorithmic accountability in HR.
Vendors are embedding tools to ensure ethical AI for talent and adherence to HR data privacy compliance standards like GDPR, providing transparency into how AI-driven recommendations are made and ensuring robust skills data validation.
Key Industry Challenge: Technological fragmentation and the complexity of integrating modern platforms with legacy human resource systems present a significant challenge to market growth.
A primary market challenge is technological fragmentation, where the complexity of legacy system integration hinders the creation of a unified talent view. Many large enterprises struggle to connect modern, AI-driven platforms with older HR information systems, creating data silos that limit the effectiveness of workforce analytics.
Another significant hurdle is the rapid skill obsolescence, which makes maintaining an accurate and relevant taxonomy a constant and resource-intensive task. Furthermore, there is often cultural resistance to algorithmic assessment, with employees and managers wary of the ethical considerations of AI in skill assessment.
Overcoming these barriers requires not just a powerful skills inference engine but also a robust change management strategy and a commitment to transparent job role standardization.
Explore Full Market Dynamics Analysis Request Free Sample
Corporate Skills Taxonomy Platforms Market Segmentation
The corporate skills taxonomy platforms industry research report provides comprehensive data including region-wise segment analysis, with forecasts and analysis for the period 2026-2030, as well as historical data from 2020-2024 for the following segments.
Deployment Segment Analysis
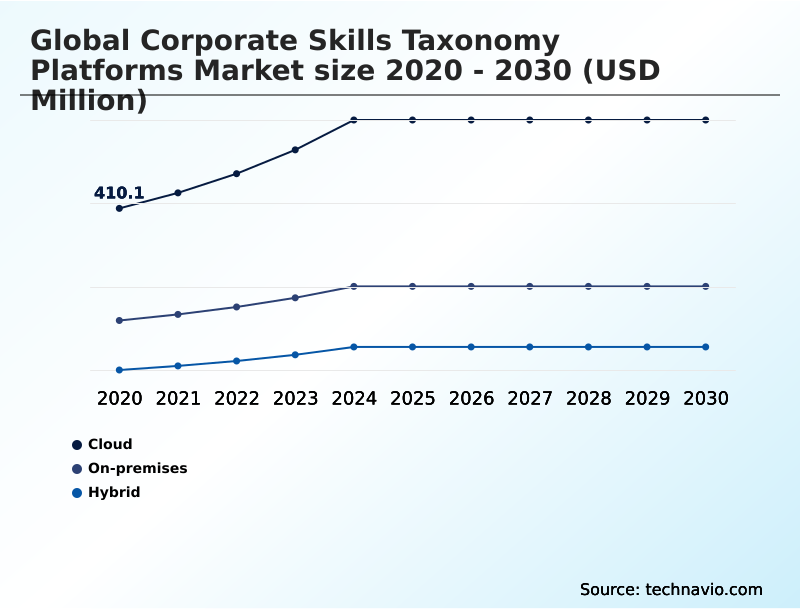
The cloud segment is estimated to witness significant growth during the forecast period.
Cloud deployment is the primary model for corporate skills taxonomy platforms, a segment projected to constitute over 58% of the market.
Organizations favor this model for its scalability in workforce planning and the agility of a dynamic skill library, which is critical for real-time talent management.
The architecture facilitates seamless human capital management integration, allowing HR leaders to focus on strategic initiatives rather than infrastructure maintenance.
Cloud-based skills cloud integration supports a distributed workforce by providing universal access to development tools, a key factor as firms adapt to new work models.
This approach, which leverages an API-first skills infrastructure, allows for predictable subscription-based expenditures, aligning with financial strategies that avoid large upfront capital outlays while enabling robust competency mapping.
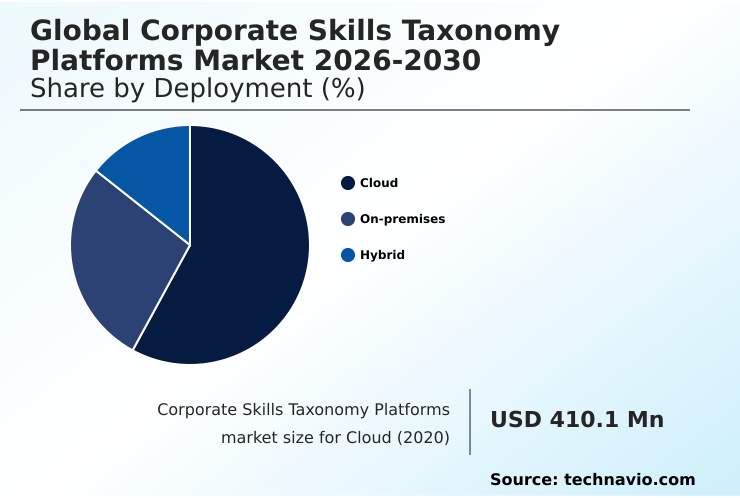
The Cloud segment was valued at USD 578.8 million in 2024 and showed a gradual increase during the forecast period.
Corporate Skills Taxonomy Platforms Market by Region: North America Leads with 32.2% Growth Share
North America is estimated to contribute 32.2% to the growth of the global market during the forecast period.
The geographic distribution of the corporate skills taxonomy platforms market reflects varying stages of digital transformation and talent strategy maturity.
North America leads, contributing 32.2% of the market's incremental growth, driven by early adoption in the US and a focus on talent agility and a skills-based organization.
Europe follows, with a strong emphasis on aligning with frameworks like the European Skills, Competences, Qualifications and Occupations (ESCO) to build a global skills taxonomy and ensure workforce readiness assessment.
The APAC region is the fastest-growing market, with countries like India and China leveraging these platforms to manage massive workforces and support national initiatives for upskilling.
Across all regions, the goal is to use these systems for better organizational network analysis and to prepare for the future of work strategy, though implementation varies based on local regulatory and economic contexts.
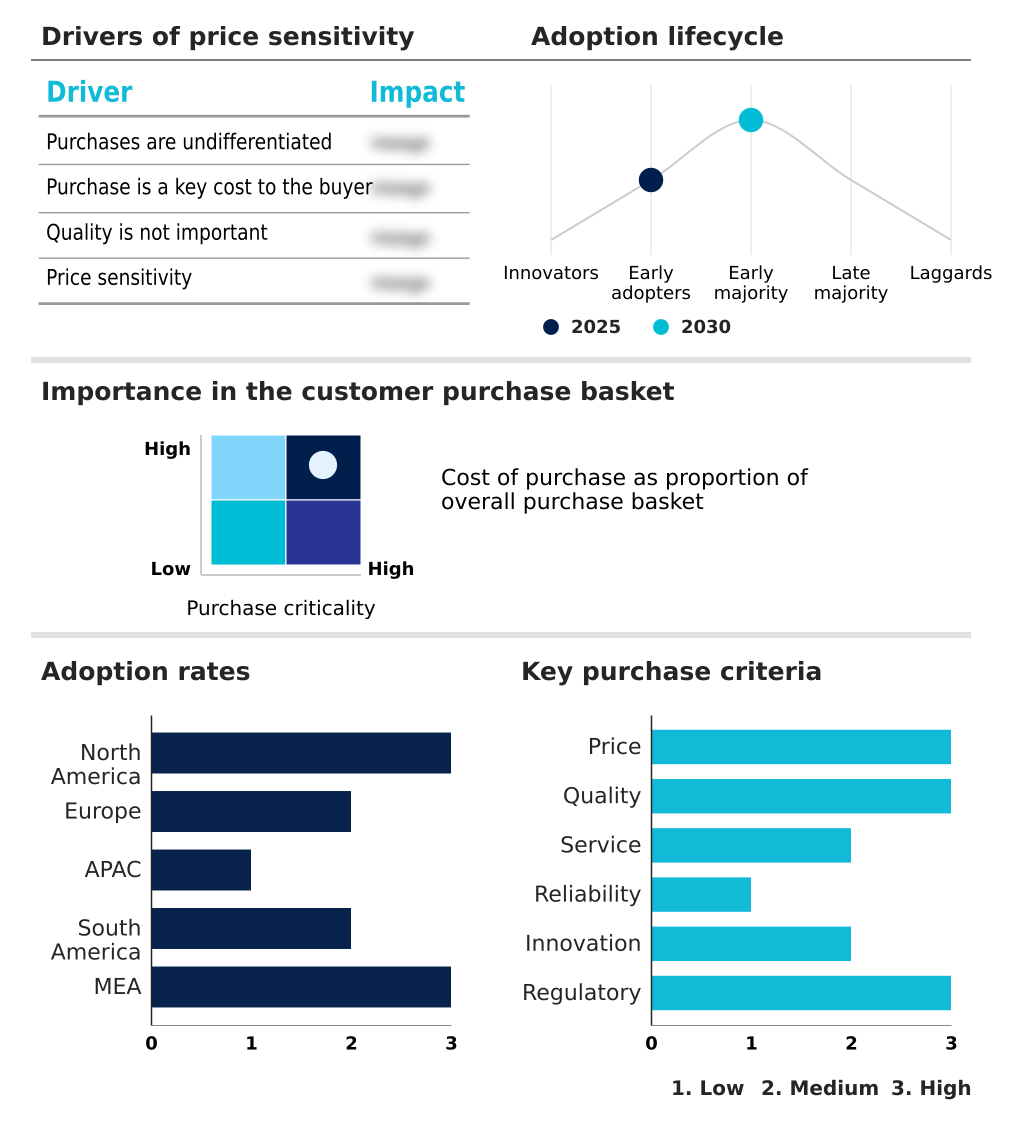
Customer Landscape Analysis for the Corporate Skills Taxonomy Platforms Market
The corporate skills taxonomy platforms market forecasting report includes the adoption lifecycle of the market, covering from the innovator’s stage to the laggard’s stage. It focuses on adoption rates in different regions based on penetration. Furthermore, the corporate skills taxonomy platforms market report also includes key purchase criteria and drivers of price sensitivity to help companies evaluate and develop their market growth analysis strategies.
Competitive Landscape of the Corporate Skills Taxonomy Platforms Market
Companies are implementing various strategies, such as strategic alliances, partnerships, mergers and acquisitions, geographical expansion, and product/service launches, to enhance their presence in the corporate skills taxonomy platforms market industry.
Beamery Inc. - Offerings center on AI-powered talent intelligence platforms that provide dynamic skills ontology and predictive analytics for strategic workforce planning and internal mobility.
The industry research and growth report includes detailed analyses of the competitive landscape of the market and information about key companies, including:
- Beamery Inc.
- Cornerstone OnDemand Inc.
- Degreed Inc.
- Docebo Inc.
- Eightfold AI
- Fuel50
- Gloat Inc.
- HackerRank
- Lightcast
- LinkedIn Corp.
- Phenom People Inc.
- Plum.io Inc.
- Pluralsight LLC
- Retrain.Ai
- SeekOut
- Skillsoft Corp.
- Techwolf
- Udemy Inc.
- Visier Inc.
- Workday Inc.
Qualitative and quantitative analysis of companies has been conducted to help clients understand the wider business environment as well as the strengths and weaknesses of key industry players. Data is qualitatively analyzed to categorize companies as pure play, category-focused, industry-focused, and diversified; it is quantitatively analyzed to categorize companies as dominant, leading, strong, tentative, and weak.
Recent Developments in the Corporate Skills Taxonomy Platforms Market
- In August 2024, Workday, Inc. entered into a definitive agreement to acquire Paradox, a candidate experience platform that leverages conversational AI to streamline the job application process.
- In January 2025, Zoom Video Communications announced the acquisition of BrightHire, integrating its AI-powered hiring lifecycle and interview intelligence solutions into Zoom's platform to enhance hiring conversation analysis.
- In March 2025, Coursera, Inc. announced the launch of Skill Tracks, a data-driven learning solution designed to guide learners from foundational knowledge to advanced proficiency through structured and verified skill pathways.
- In April 2025, Microsoft introduced People Skills within Microsoft Copilot, embedding skills intelligence directly into its AI-powered productivity ecosystem to enable organizations to identify and analyze employee skills within daily workflows.
Research Analyst Overview: Corporate Skills Taxonomy Platforms Market
Boardroom-level decisions on mergers and acquisitions are now directly influenced by insights from corporate skills taxonomy platforms, which provide a clear view of an acquisition target's talent assets and integration risks. The market is propelled by the need for predictive skill forecasting and robust competency mapping to navigate technological disruption.
Within this landscape, the cloud deployment segment dominates, while North America stands out as a key region, reflecting a mature understanding of strategic workforce planning. An essential function of these platforms is enabling compliance with data privacy regulations such as the GDPR, which mandates auditable and transparent processes in talent management.
These systems utilize a skills ontology to facilitate job architecture redesigns and power internal talent marketplaces, providing a verifiable basis for career pathing.
The ability to perform a detailed skill gap analysis and manage a dynamic skill library is no longer a competitive advantage but a baseline requirement for large-scale enterprises focused on maintaining talent agility and achieving a skills-based organization structure.
Dive into Technavio’s robust research methodology, blending expert interviews, extensive data synthesis, and validated models for unparalleled Corporate Skills Taxonomy Platforms Market insights. See full methodology.
| Market Scope | |
|---|---|
| Page number | 295 |
| Base year | 2025 |
| Historic period | 2020-2024 |
| Forecast period | 2026-2030 |
| Growth momentum & CAGR | Accelerate at a CAGR of 14.7% |
| Market growth 2026-2030 | USD 1091.1 million |
| Market structure | Fragmented |
| YoY growth 2025-2026(%) | 12.8% |
| Key countries | US, Canada, Mexico, Germany, UK, France, Italy, The Netherlands, Spain, China, India, Japan, Australia, South Korea, Indonesia, Brazil, Argentina, Colombia, Saudi Arabia, UAE, South Africa, Israel and Turkey |
| Competitive landscape | Leading Companies, Market Positioning of Companies, Competitive Strategies, and Industry Risks |
Corporate Skills Taxonomy Platforms Market: Key Questions Answered in This Report
-
What is the expected growth of the Corporate Skills Taxonomy Platforms Market between 2026 and 2030?
-
The Corporate Skills Taxonomy Platforms Market is expected to grow by USD 1.09 billion during 2026-2030, registering a CAGR of 14.7%. Year-over-year growth in 2026 is estimated at 12.8%%. This acceleration is shaped by proliferation of ai and ml as catalyst for skill realignment, which is intensifying demand across multiple end-use verticals covered in the report.
-
-
What segmentation does the market report cover?
-
The report is segmented by Deployment (Cloud, On-premises, and Hybrid), End-user (Large enterprises, and SMEs), Application (IT and telecom, BFSI, Healthcare, Manufacturing, and Others) and Geography (North America, Europe, APAC, South America, Middle East and Africa). Among these, the Cloud segment is estimated to witness significant growth during the forecast period, driven by rising adoption across key application areas. Each segment includes detailed qualitative and quantitative analysis, along with historical data from 2020-2024 and forecasts through 2030 with year-over-year growth rates.
-
-
Which regions are analyzed in the report?
-
The report covers North America, Europe, APAC, South America and Middle East and Africa. North America is estimated to contribute 32.2% to market growth during the forecast period. Country-level analysis includes US, Canada, Mexico, Germany, UK, France, Italy, The Netherlands, Spain, China, India, Japan, Australia, South Korea, Indonesia, Brazil, Argentina, Colombia, Saudi Arabia, UAE, South Africa, Israel and Turkey, with dedicated market size tables and year-over-year growth for each.
-
-
What are the key growth drivers and market challenges?
-
The primary driver is proliferation of ai and ml as catalyst for skill realignment, which is accelerating investment and industry demand. The main challenge is technological fragmentation and complexity of legacy system integration, creating operational barriers for key market participants. The report quantifies the impact of each driver and challenge across 2026 and 2030 with comparative analysis.
-
-
Who are the major players in the Corporate Skills Taxonomy Platforms Market?
-
Key vendors include Beamery Inc., Cornerstone OnDemand Inc., Degreed Inc., Docebo Inc., Eightfold AI, Fuel50, Gloat Inc., HackerRank, Lightcast, LinkedIn Corp., Phenom People Inc., Plum.io Inc., Pluralsight LLC, Retrain.Ai, SeekOut, Skillsoft Corp., Techwolf, Udemy Inc., Visier Inc. and Workday Inc.. The report provides qualitative and quantitative analysis categorizing companies as dominant, leading, strong, tentative, and weak based on their market positioning. Company profiles include business segment analysis, SWOT assessment, key offerings, and recent strategic developments.
-
Corporate Skills Taxonomy Platforms Market Research Insights
The market's momentum is influenced by the strategic push for a skills-based organization, with firms adopting career architecture platforms to improve talent lifecycle management. The large enterprises segment is growing faster than SMEs, reflecting the complex workforce planning needs of global corporations.
Platforms must adhere to strict HR data privacy compliance standards, such as the General Data Protection Regulation (GDPR), which governs how employee data is used for algorithmic accountability in HR.
In practice, a financial services firm uses a talent intelligence suite to conduct a workforce readiness assessment, identifying employees with latent analytical skills who can be retrained for new roles in fintech, thereby optimizing their employee potential mapping and reducing external hiring costs. This strategic application of technology is becoming a standard for maintaining competitive advantage.
We can help! Our analysts can customize this corporate skills taxonomy platforms market research report to meet your requirements.
 RIA -
RIA - 
