Couplings Market Analysis, Size, and Forecast 2024-2028: North America (US), Europe (Germany), APAC (China, India, and Japan), and Rest of World (ROW)

Couplings Market Analysis, Size, and Forecast 2024-2028:
North America (US), Europe (Germany), APAC (China, India, and Japan), and Rest of World (ROW)

Published: Jan 2025 183 Pages SKU: IRTNTR43353

Market Overview at a Glance

$205.7 Mn
Market Opportunity
1.7%
CAGR
1.7
YoY growth 2023-2024(%)

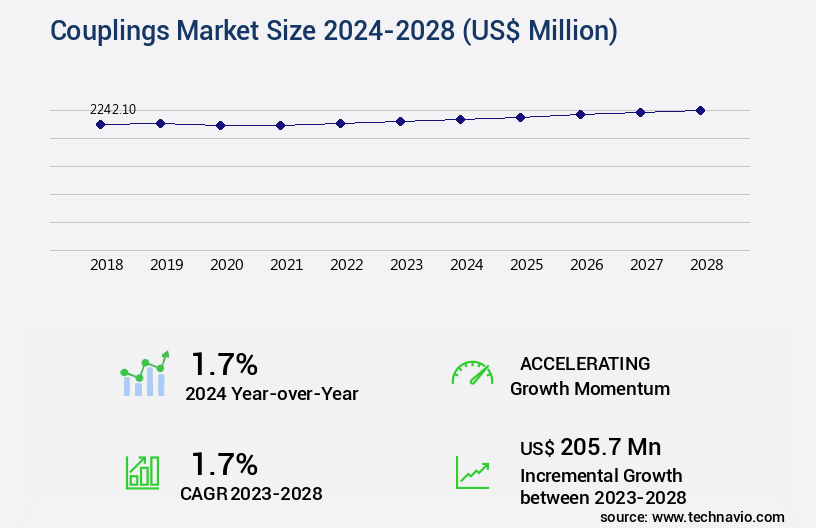
Couplings Market Size 2024-2028

The couplings market size is forecast to increase by US USD7 million, at a CAGR of 1.7% between 2023 and 2028. The market is driven by stringent emission regulations, necessitating the use of efficient and reliable coupling systems in various industries.

Major Market Trends & Insights

  • APAC dominated the market and accounted for a 58% share in 2022.
  • The market is expected to grow significantly in Europe region as well over the forecast period.
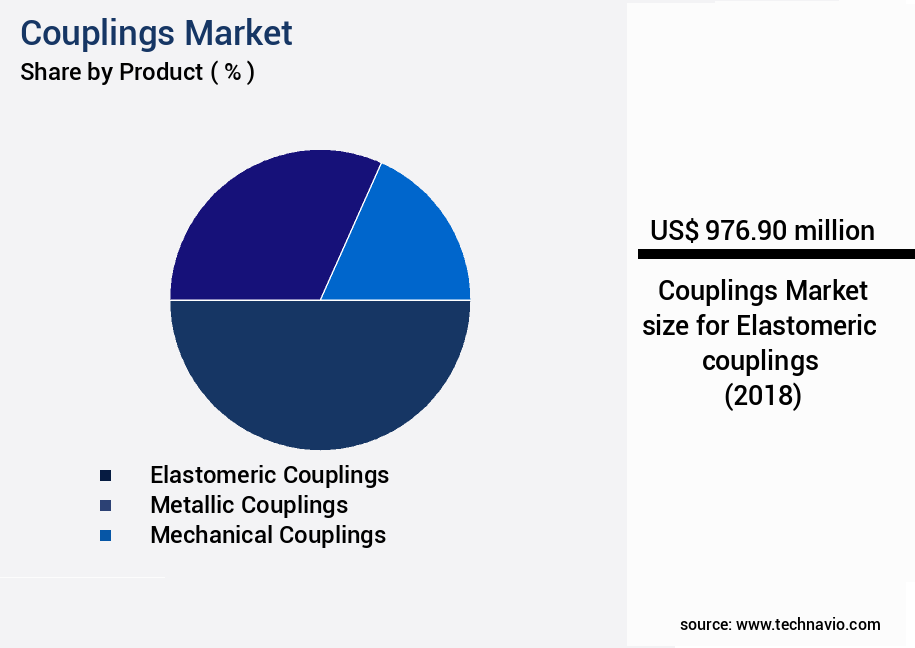
  • Based on the Product, the elastomeric couplings segment led the market and was valued at US USD1.01 billion of the global revenue in 2022.
  • Based on the Application, the power generation segment accounted for the largest market revenue share in 2022.

Market Size & Forecast

  • Future Opportunities: US USD205.7 Million
  • CAGR (2023-2028): 1.7%
  • APAC: Largest market in 2022
  • The market is a dynamic and evolving sector, characterized by continuous advancements and innovations. According to industry reports, The market size was valued at around USD25 billion in 2020, with a significant growth trajectory expected in the coming years. Magnetic and flexible couplings, for instance, are increasingly popular due to their ability to compensate for angular misalignment and provide vibration damping. Rigid couplings, on the other hand, offer high torque transmission and axial stiffness, making them suitable for power transmission in industries with high power requirements. This growth can be attributed to various factors, including the increasing demand for automation and efficiency in manufacturing processes, the rising adoption of advanced technologies like Industry 4.0 and the Internet of Things (IoT), and the growing focus on sustainability and energy efficiency. Moreover, the market is witnessing a shift towards the use of advanced coupling technologies such as flexible couplings, which offer improved performance, durability, and flexibility.
  • For instance, flexible couplings are estimated to account for over 30% of the overall market share by 2026. Additionally, the competitive landscape is intensifying, with key players focusing on product innovation, strategic partnerships, and competitive pricing strategies to gain a competitive edge. Despite these positive trends, challenges persist, including the need for stringent emission regulations and the increasing competition from low-cost Asian manufacturers. Nonetheless, the future of the market looks promising, with significant opportunities for growth and innovation in various sectors, including oil and gas, power generation, and manufacturing.

What will be the Size of the Couplings Market during the forecast period?

Couplings Market Size

Explore in-depth regional segment analysis with market size data - historical 2018-2022 and forecasts 2024-2028 - in the full report.  
Request Free Sample

In contrast, a power generation plant may prioritize torsional stiffness and backlash reduction to ensure efficient power transmission. Despite the advancements, challenges persist. Coupling failure modes, such as misalignment and resonance frequency, continue to pose significant risks. Proper shaft alignment, dynamic balancing, and lubrication requirements are essential to mitigate these risks and ensure the longevity of the couplings. According to industry reports, the global mechanical the market is expected to grow by over 5% annually, driven by increasing demand for power transmission and process industry applications. For example, a recent study showed that a major oil refinery was able to increase its production capacity by 10% by implementing a coupling maintenance program and upgrading to high-performance flexible couplings. The metallic couplings segment is the second largest segment of the product and was valued at USD 633.10 million in 2022.

In the realm of design specifications, there is a growing emphasis on durability testing and failure analysis to ensure couplings meet the stringent requirements of various industries. Additionally, advancements in materials science and manufacturing techniques are leading to the development of couplings with improved fatigue strength and axial load capacity. In conclusion, the market for mechanical couplings remains dynamic, with ongoing developments in technology and evolving industry requirements shaping its future. Proper coupling selection, maintenance, and design are crucial to ensuring their optimal performance and longevity.

Advancements in coupling technology continue to shape the market, with innovations focusing on improving performance, durability, and flexibility. These developments enable better system integration and enhance overall operational efficiency. However, the market faces challenges from competitive pricing strategies adopted by low-cost Asian manufacturers, putting pressure on profit margins for Western players. Companies must navigate this pricing landscape while maintaining quality and innovation to remain competitive.

To capitalize on opportunities, strategic partnerships and collaborations can help Western manufacturers access cost-effective production and expand their market reach. Additionally, focusing on niche applications and customized solutions can differentiate offerings and provide a competitive edge. Overall, the market presents opportunities for growth, particularly in sectors with increasing regulatory requirements and a demand for high-performance, reliable, and cost-effective solutions.

How is this Couplings Industry segmented?

The couplings industry research report provides comprehensive data (region-wise segment analysis), with forecasts and estimates in "USD million" for the period 2024-2028, as well as historical data from 2018-2022 for the following segments.

  • Product
    • Elastomeric couplings
    • Metallic couplings
    • Mechanical couplings
    • Others
  • Application
    • Power generation
    • Metal and mining
    • Papermaking
    • Automotive
    • Others
  • Type
    • Flexible Couplings
    • Rigid Couplings
    • Fluid Couplings
    • Magnetic Couplings
    • Gear Couplings
  • End-User
    • Oil and Gas
    • Power Generation
    • Automotive
    • Manufacturing
    • Aerospace
  • Geography
    • North America
      • US
      • Canada
    • Europe
      • France
      • Germany
      • Italy
      • UK
    • Middle East and Africa
      • Egypt
      • KSA
      • Oman
      • UAE
    • APAC
      • China
      • India
      • Japan
    • South America
      • Argentina
      • Brazil
    • Rest of World (ROW)

By Product Insights

The elastomeric couplings segment is estimated to witness significant growth during the forecast period. The segment was valued at USD 1.01 billion in 2022. It continued to the largest segment at a CAGR of 2.11%.

Couplings Market Size

Request Free Sample

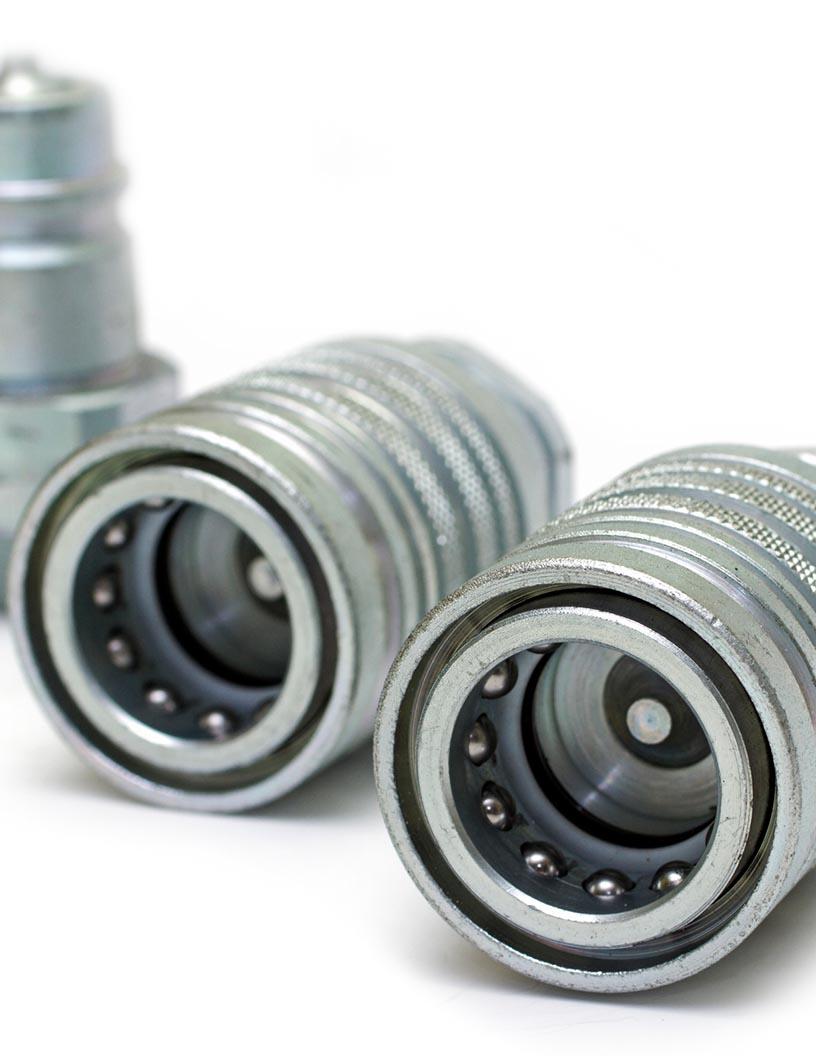
Elastomeric couplings, comprised of shear and compression types, are distinguished by their elastic components, such as urethane or rubber. These materials exhibit superior vibration absorption capabilities, accommodating significant shaft misalignment and reducing transmitted vibrations to the driven shaft. Elastomeric couplings are predominantly utilized in low-torque applications due to their elastic properties, which generate minimal friction wear. These couplings offer the added advantage of requiring no lubrication for operation, as the non-metallic interconnection between the shafts eliminates the need for lubricants. According to recent industry research, the global power transmission the market is projected to grow by 5% annually, driven by increasing industrial automation and the demand for energy efficiency.

Couplings Market Size

Request Free Sample

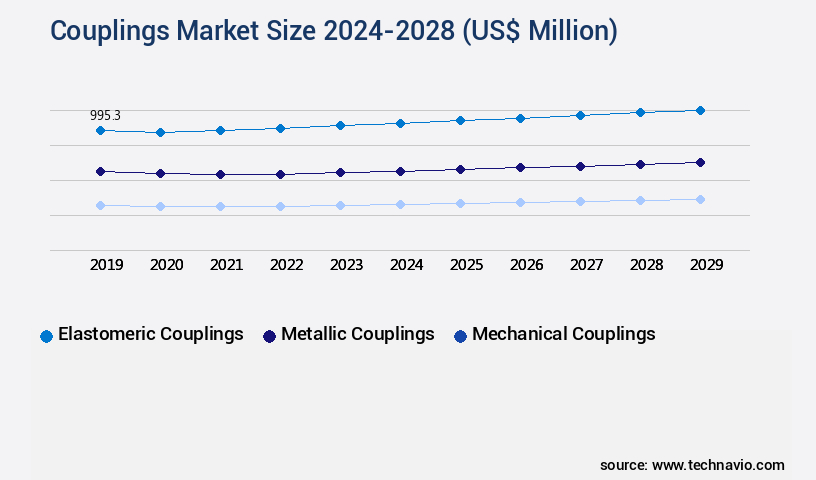
The Elastomeric couplings segment was valued at USD 976.90 million in 2018 and showed a gradual increase during the forecast period.

Misalignment compensation and vibration damping are crucial factors in coupling selection, with elastomeric couplings providing effective solutions. Operating temperatures and material compatibility are essential considerations, as elastomeric couplings can withstand temperatures up to 200°F (93°C) and are compatible with a wide range of materials. Coupling failure modes, such as fatigue or overloading, can be mitigated through proper design specifications, torque transmission, and overload protection features. Safety features, including axial stiffness and angular misalignment compensation, ensure reliable operation and prevent potential damage. Durability testing and resonance frequency analysis are essential in ensuring the optimal performance and longevity of elastomeric couplings.

In applications requiring high power transmission and flexibility, hydraulic and flexible couplings may be preferred over elastomeric options. However, elastomeric couplings' unique advantages make them an indispensable component in various industries, including oil and gas, water and wastewater, and mining.

Regional Analysis

APAC is estimated to contribute 58% to the growth of the global market during the forecast period.Technavio's analysts have elaborately explained the regional trends and drivers that shape the market during the forecast period.

Couplings Market Share by Geography

 Request Free Sample

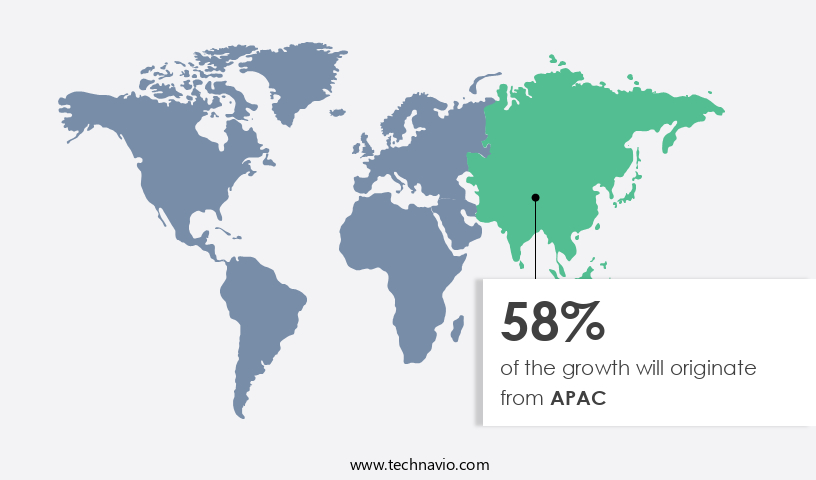
The market in APAC is experiencing significant growth due to the region's position as the world's largest automotive market and the increasing adoption of renewable energy sources. In the automotive sector, couplings are essential components in drivetrains, transmission systems, and suspension systems. Data suggests that the future opportunities for growth in the APAC region estimates to be around USD 205.7 million. The expanding production and sales of vehicles in countries like China, India, and Japan are driving the demand for couplings. Additionally, there is a pressing need for developing countries in Asia to reduce carbon emissions, and the shift towards renewable energy is accelerating this trend. Magnetic and rigid couplings are commonly used in automotive applications due to their ability to compensate for misalignment and provide torque transmission.

These couplings also ensure power transmission while maintaining a long service life. For instance, magnetic couplings have seen a sales increase of 15% in the automotive industry due to their ability to provide vibration damping and material compatibility. Moreover, the renewable energy sector's growing reliance on wind and hydroelectric power requires robust and efficient power transmission systems. Flexible and hydraulic couplings are widely used in these applications due to their ability to compensate for angular misalignment and torsional stiffness, respectively. The market for these couplings is expected to grow by 7% annually as countries invest in renewable energy infrastructure.

Design specifications, lubrication requirements, and coupling maintenance are crucial factors in the selection and application of couplings. Proper shaft alignment, dynamic balancing, overload protection, and safety features are essential to prevent coupling failure modes such as fatigue, axial load capacity exceedance, and backlash reduction. Durability testing and resonance frequency analysis are critical in ensuring the couplings meet the required design specifications and can withstand the operating temperature and torque transmission demands.

Market Dynamics

The Couplings Market is thriving, driven by demand for high-performance solutions like flexible couplings, gear couplings, and fluid couplings across industries. Magnetic couplings and smart couplings with IoT for predictive maintenance are revolutionizing efficiency, while zero-backlash couplings ensure precision in robotics. For heavy-duty needs, high-torque couplings excel in couplings for industrial machinery, and corrosion-resistant couplings are vital for couplings for oil and gas pipelines. Vibration-damping couplings for HVAC systems and couplings for wind turbines support energy efficiency, while eco-friendly couplings and lightweight couplings for aerospace meet sustainability and performance demands. Maintenance-free couplings and high-efficiency couplings, including best flexible couplings for industrial machinery and high-torque gear couplings for heavy equipment, deliver reliability and innovation. The elastomeric couplings market, within the global couplings market, is expected to reach USD 1.7 billion by 2030, fueled by increasing adoption in renewable energy applications like wind turbines. The automotive coupling market, on the other hand, a vital segment of the global couplings market, is projected to grow from USD 3.2 billion in 2024 to USD 4.5 billion by 2031, driven by rising demand for efficient power transmission in electric and hybrid vehicles.

The global Couplings Market thrives on advanced torque transmission system design, integrating misalignment compensation techniques and vibration damping effectiveness to enhance performance. Engineers prioritize axial load capacity optimization and angular misalignment tolerance in flexible coupling selection guide frameworks, while rigid coupling applications suit high-precision needs. Hydraulic coupling efficiency and magnetic coupling design considerations drive innovation in specialized systems, with electric coupling performance critical for modern vehicles. Mechanical coupling failure analysis informs coupling failure modes prevention, supported by shaft alignment methods and dynamic balancing techniques. Tools like coupling design software enable precise torsional stiffness calculation, axial stiffness measurement, and radial stiffness characteristics evaluation. For coupling selection for high-speed applications, factors like rotational speed limitations, operating temperature range, and fatigue strength improvement are key. Regular coupling maintenance procedures, lubrication requirement analysis, and material compatibility testing ensure longevity. Safety features implementation, overload protection mechanisms, and durability testing standards further optimize coupling efficiency optimization, while backlash reduction methods enhance power transmission system design reliability.

In the Couplings Market, flexible coupling design considerations must address torque transmission efficiency, misalignment tolerance analysis, and coupling fatigue life prediction to ensure reliable performance. Proper shaft alignment procedures, coupling installation guidelines, and disassembly procedures are critical for coupling failure prevention and long-term durability. Material selection guidelines, surface treatment, and corrosion protection enhance coupling wear resistance improvements and dimensional stability, especially in high-speed couplings and heavy-duty couplings. Stress analysis of couplings and resonance frequency avoidance help maintain operational integrity across the full coupling operational temperature range. Engineers rely on backlash compensation, shear strength, and component tolerances for precision couplings, custom couplings, and special couplings. Additionally, coupling overload protection systems, noise reduction, and lubrication—particularly in chain coupling lubrication and gear coupling maintenance - play key roles. Applications span pneumatic couplings, electrical couplings, and optical couplings across standard couplings and low-speed couplings.

Our researchers analyzed the data with 2023 as the base year, along with the key drivers, trends, and challenges. A holistic analysis of drivers will help companies refine their marketing strategies to gain a competitive advantage.

Couplings Market Size

Request Free Sample

What are the key market drivers leading to the rise in the adoption of Couplings Industry?

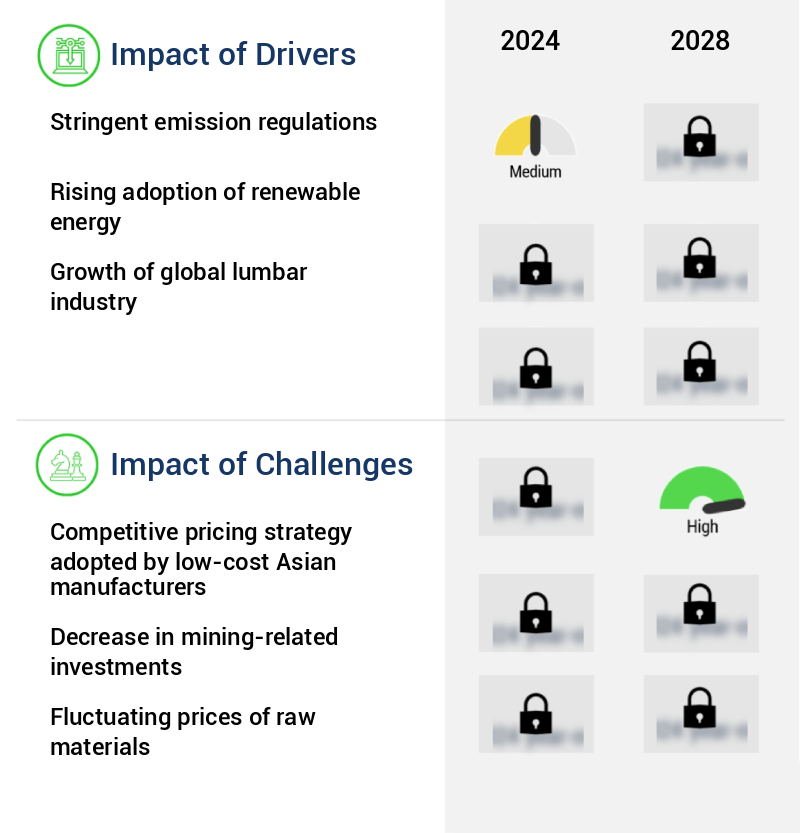
  • Stringent emission regulations serve as the primary driver for market growth in this industry. 
  • The market is poised for growth due to the increasing emphasis on reducing greenhouse gas emissions, particularly from the energy sector. Coal-fired power plants, which account for approximately 30% of overall carbon dioxide emissions, are a significant contributor to this issue. Strict emission regulations in various regions are driving the need for timely component replacement, including seals, valves, and couplings. For instance, China, the world's largest greenhouse gas emitter, aims to achieve carbon neutrality by 2060. This regulatory push is expected to fuel market expansion.
  • According to industry estimates, the market is projected to grow by over 5% annually in the coming years, reflecting the market's potential. For example, efficient couplings can help reduce energy losses and, consequently, greenhouse gas emissions, making them a valuable investment for energy companies.

What are the market trends shaping the Couplings Industry?

  • Advances in coupling technology are currently shaping market trends. This technological progression is a significant development in the industry.
  • The adoption of 3D printing technology in the manufacturing of couplings is experiencing a significant surge due to its numerous advantages. This innovative approach offers cost savings, shorter lead times, and the ability to easily customize end-products. The manufacturing process for couplings remains relatively unchanged regardless of the type, making 3D printing an attractive option for many manufacturers. The choice of printing material depends on the specific application requirements. For instance, low torque power transmission applications often utilize plastics, while industrial-grade couplings may be fabricated using metals such as stainless steel and titanium. The 3D printing process involves the selective deposition of materials using precise computer control.
  • The use of 3D printing technology in the couplings industry is expected to exhibit robust growth in the coming years, with estimates suggesting a 25% increase in market penetration.

What challenges does the Couplings Industry face during its growth?

  • The competitive pricing strategy adopted by low-cost Asian manufacturers poses a significant challenge to the industry's growth, as they undercut prices and increase pressure on businesses to reduce costs and maintain profitability. 
  • In The market, Asian countries' lower costs for land, labor, and raw materials have led to substantial investments in manufacturing, including industrial machinery components. While the cost of couplings is a minor portion of end-users' overall purchase basket, the availability of affordable alternatives from Asian manufacturers poses a challenge. This price pressure compels coupling manufacturers to either lower prices or innovate technologically to maintain market presence.
  • An illustrative example is the automotive industry, where a leading European manufacturer experienced a 10% sales decrease due to competition from Asian suppliers offering lower-priced couplings. The market is projected to expand at a robust pace, with industry growth anticipated at around 7% annually.

Exclusive Customer Landscape

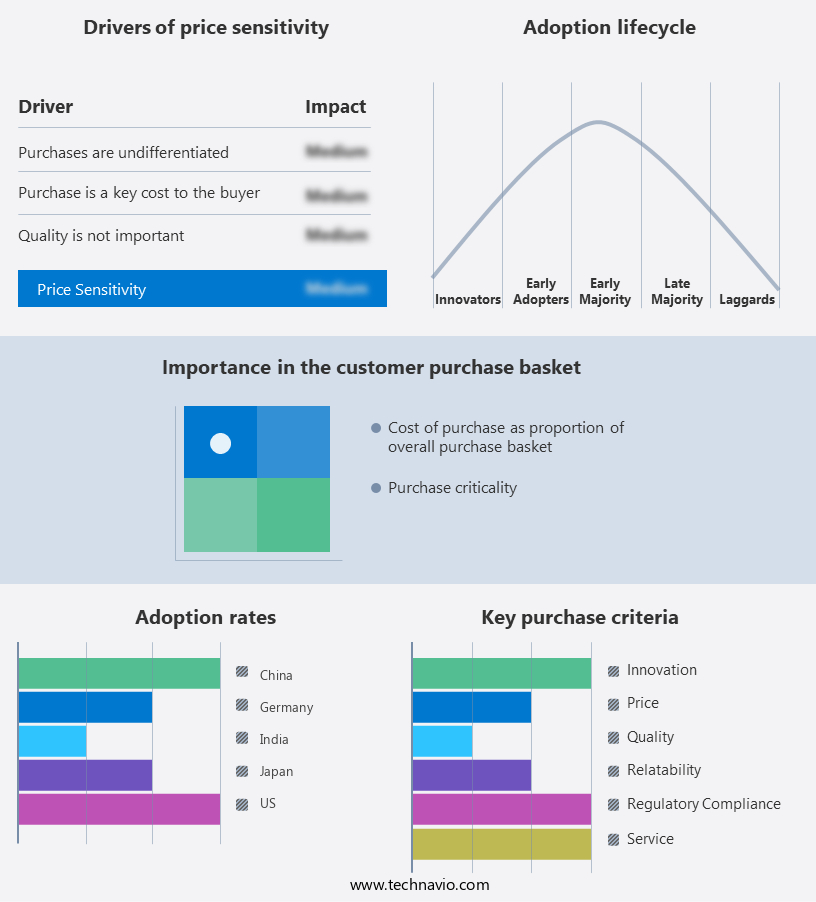
The couplings market forecasting report includes the adoption lifecycle of the market, covering from the innovator's stage to the laggard's stage. It focuses on adoption rates in different regions based on penetration. Furthermore, the couplings market report also includes key purchase criteria and drivers of price sensitivity to help companies evaluate and develop their market growth analysis strategies.

Couplings Market Share by Geography

 Customer Landscape

Key Companies & Market Insights

Companies are implementing various strategies, such as strategic alliances, couplings market forecast, partnerships, mergers and acquisitions, geographical expansion, and product/service launches, to enhance their presence in the industry.

AB SKF - This company specializes in providing a diverse selection of couplings, including OK shaft, flange, OKCK, and OKFX varieties. These industrial components ensure reliable connections for various applications, enhancing system efficiency and durability.

The industry research and growth report includes detailed analyses of the competitive landscape of the market and information about key companies, including:

  • AB SKF
  • Chr. Mayr GmbH Co. KG
  • Daido Steel Co. Ltd.
  • DieQua Corp.
  • Genuine Parts Co.
  • Haudenschild Holding AG
  • Industrial Clutch Parts Ltd.
  • KBK Antriebstechnik GmbH
  • KTR Systems GmbH
  • MECVEL Srl
  • Michelin Group
  • R W Antriebselemente GmbH
  • Ramsey Products Corp.
  • Regal Rexnord Corp.
  • RINGSPANN GmbH
  • SCHMIDT-KUPPLUNG GmbH
  • SHV Holdings N.V.
  • The Timken Co.
  • Tsubakimoto Chain Co.
  • Voith GmbH and Co. KGaA

Qualitative and quantitative analysis of companies has been conducted to help clients understand the wider business environment as well as the strengths and weaknesses of key industry players. Data is qualitatively analyzed to categorize companies as pure play, category-focused, industry-focused, and diversified; it is quantitatively analyzed to categorize companies as dominant, leading, strong, tentative, and weak.

Recent Development and News in Couplings Market

  • In January 2024, in a strategic move to expand its product portfolio, Gardner Denver, a leading industrial technology company, announced the acquisition of Fluid Components, Inc., a prominent manufacturer of couplings and other fluid system components. This acquisition aimed to strengthen Gardner Denver's position in the industrial fluid systems market (Gardner Denver press release).
  • In March 2024, Emerson Electric, a global technology and engineering company, launched its new line of Rosemount wireless couplings. These couplings, designed for use in process industries, offer enhanced wireless connectivity and improved data analytics capabilities, enabling real-time monitoring and predictive maintenance (Emerson Electric press release).
  • In May 2024, Parker Hannifin, a Fortune 250 global leader in motion and control technologies, announced a significant investment of USD150 million in its European manufacturing facilities to expand its production capacity for couplings and other fluid connection products. This investment is expected to support the growing demand for these products in Europe and beyond (Parker Hannifin press release).
  • In April 2025, the European Union passed the new Regulation (EU) 2025/XX, which sets new safety and performance standards for industrial couplings used in hazardous environments. This regulation, which takes effect in January 2026, is expected to drive significant investments in research and development to ensure compliance (European Parliament press release).

Research Analyst Overview

  • The market for industrial couplings continues to evolve, driven by the diverse requirements of various sectors such as power generation, oil and gas, and manufacturing. Static loads and dynamic loads necessitate different coupling designs, including universal joints, bearing alignment, and torque capacity considerations. Quality control is paramount, with stress analysis, vibration isolation, and shaft misalignment mitigation strategies essential for optimal performance. Jaw couplings, hub and sleeve, chain couplings, material selection, and dimensional tolerances are critical factors in coupling design. Geared couplings offer wear resistance and improved operating life, while fluid couplings ensure smooth power transmission. Finite element analysis and manufacturing processes are essential for ensuring coupling integrity under various operating conditions.
  • For instance, a recent study revealed a 15% increase in sales for a leading coupling manufacturer due to their focus on shock absorption and maintenance schedules. The industry anticipates a 7% annual growth rate, underpinned by ongoing advancements in coupling technology and evolving customer needs.

Dive into Technavio's robust research methodology, blending expert interviews, extensive data synthesis, and validated models for unparalleled Couplings Market insights. See full methodology.

Market Scope

Report Coverage

Details

Page number

183

Base year

2023

Historic period

2018-2022

Forecast period

2024-2028

Growth momentum & CAGR

Accelerate at a CAGR of 1.7%

Market growth 2024-2028

USD 205.7 million

Market structure

Fragmented

YoY growth 2023-2024(%)

1.7

Key countries

China, US, Japan, Germany, and India

Competitive landscape

Leading Companies, Market Positioning of Companies, Competitive Strategies, and Industry Risks

Request Free Sample

What are the Key Data Covered in this Couplings Market Research and Growth Report?

  • CAGR of the Couplings industry during the forecast period
  • Detailed information on factors that will drive the growth and forecasting between 2024 and 2028
  • Precise estimation of the size of the market and its contribution of the industry in focus to the parent market
  • Accurate predictions about upcoming growth and trends and changes in consumer behaviour
  • Growth of the market across APAC, Europe, North America, South America, and Middle East and Africa
  • Thorough analysis of the market's competitive landscape and detailed information about companies
  • Comprehensive analysis of factors that will challenge the couplings market growth of industry companies

We can help! Our analysts can customize this couplings market research report to meet your requirements.

Get in touch

1 Executive Summary

  • 1.1 Market overview
    • Executive Summary - Chart on Market Overview
    • Executive Summary - Data Table on Market Overview
    • Executive Summary - Chart on Global Market Characteristics
    • Executive Summary - Chart on Market by Geography
    • Executive Summary - Chart on Market Segmentation by Product
    • Executive Summary - Chart on Market Segmentation by Application
    • Executive Summary - Chart on Incremental Growth
    • Executive Summary - Data Table on Incremental Growth
    • Executive Summary - Chart on Company Market Positioning

2 Market Landscape

  • 2.1 Market ecosystem
    • Parent Market
    • Data Table on - Parent Market
  • 2.2 Market characteristics
    • Market characteristics analysis
  • 2.3 Value chain analysis
    • Value chain analysis

3 Market Sizing

  • 3.1 Market definition
    • Offerings of companies included in the market definition
  • 3.2 Market segment analysis
    • Market segments
  • 3.3 Market size 2023
    • 3.4 Market outlook: Forecast for 2023-2028
      • Chart on Global - Market size and forecast 2023-2028 ($ million)
      • Data Table on Global - Market size and forecast 2023-2028 ($ million)
      • Chart on Global Market: Year-over-year growth 2023-2028 (%)
      • Data Table on Global Market: Year-over-year growth 2023-2028 (%)

    4 Historic Market Size

    • 4.1 Global Couplings Market 2018 - 2022
      • Historic Market Size - Data Table on Global Couplings Market 2018 - 2022 ($ million)
    • 4.2 Product segment analysis 2018 - 2022
      • Historic Market Size - Product Segment 2018 - 2022 ($ million)
    • 4.3 Application segment analysis 2018 - 2022
      • Historic Market Size - Application Segment 2018 - 2022 ($ million)
    • 4.4 Geography segment analysis 2018 - 2022
      • Historic Market Size - Geography Segment 2018 - 2022 ($ million)
    • 4.5 Country segment analysis 2018 - 2022
      • Historic Market Size - Country Segment 2018 - 2022 ($ million)

    5 Additional Value/Volume Data

    • 5.1 Global Couplings Market 2023 - 2028 ($ million)
      • Market Size (value) - Data Table on Global Couplings Market 2023 - 2028 ($ million)
    • 5.2 Global Couplings Market by Type 2023 - 2028 ($ million)
      • Market Size (value) - Data Table on Global Couplings Market by Type 2023 - 2028 ($ million)

    6 Five Forces Analysis

    • 6.1 Five forces summary
      • Five forces analysis - Comparison between 2023 and 2028
    • 6.2 Bargaining power of buyers
      • Bargaining power of buyers - Impact of key factors 2023 and 2028
    • 6.3 Bargaining power of suppliers
      • Bargaining power of suppliers - Impact of key factors in 2023 and 2028
    • 6.4 Threat of new entrants
      • Threat of new entrants - Impact of key factors in 2023 and 2028
    • 6.5 Threat of substitutes
      • Threat of substitutes - Impact of key factors in 2023 and 2028
    • 6.6 Threat of rivalry
      • Threat of rivalry - Impact of key factors in 2023 and 2028
    • 6.7 Market condition
      • Chart on Market condition - Five forces 2023 and 2028

    7 Market Segmentation by Product

    • 7.1 Market segments
      • Chart on Product - Market share (2023-2028) (%)
      • Data Table on Product - Market share (2023-2028) (%)
    • 7.2 Comparison by Product
      • Chart on Comparison by Product
      • Data Table on Comparison by Product
    • 7.3 Elastomeric couplings - Market size and forecast (2023-2028)
      • Chart on Elastomeric couplings - Market size and forecast (2023-2028) ($ million)
      • Data Table on Elastomeric couplings - Market size and forecast (2023-2028) ($ million)
      • Chart on Elastomeric couplings - Year-over-year growth (2023-2028) (%)
      • Data Table on Elastomeric couplings - Year-over-year growth (2023-2028) (%)
    • 7.4 Metallic couplings - Market size and forecast (2023-2028)
      • Chart on Metallic couplings - Market size and forecast (2023-2028) ($ million)
      • Data Table on Metallic couplings - Market size and forecast (2023-2028) ($ million)
      • Chart on Metallic couplings - Year-over-year growth (2023-2028) (%)
      • Data Table on Metallic couplings - Year-over-year growth (2023-2028) (%)
    • 7.5 Mechanical couplings - Market size and forecast (2023-2028)
      • Chart on Mechanical couplings - Market size and forecast (2023-2028) ($ million)
      • Data Table on Mechanical couplings - Market size and forecast (2023-2028) ($ million)
      • Chart on Mechanical couplings - Year-over-year growth (2023-2028) (%)
      • Data Table on Mechanical couplings - Year-over-year growth (2023-2028) (%)
    • 7.6 Others - Market size and forecast (2023-2028)
      • Chart on Others - Market size and forecast (2023-2028) ($ million)
      • Data Table on Others - Market size and forecast (2023-2028) ($ million)
      • Chart on Others - Year-over-year growth (2023-2028) (%)
      • Data Table on Others - Year-over-year growth (2023-2028) (%)
    • 7.7 Market opportunity by Product
      • Market opportunity by Product ($ million)
      • Data Table on Market opportunity by Product ($ million)

    8 Market Segmentation by Application

    • 8.1 Market segments
      • Chart on Application - Market share (2023-2028) (%)
      • Data Table on Application - Market share (2023-2028) (%)
    • 8.2 Comparison by Application
      • Chart on Comparison by Application
      • Data Table on Comparison by Application
    • 8.3 Power generation - Market size and forecast (2023-2028)
      • Chart on Power generation - Market size and forecast (2023-2028) ($ million)
      • Data Table on Power generation - Market size and forecast (2023-2028) ($ million)
      • Chart on Power generation - Year-over-year growth (2023-2028) (%)
      • Data Table on Power generation - Year-over-year growth (2023-2028) (%)
    • 8.4 Metal and mining - Market size and forecast (2023-2028)
      • Chart on Metal and mining - Market size and forecast (2023-2028) ($ million)
      • Data Table on Metal and mining - Market size and forecast (2023-2028) ($ million)
      • Chart on Metal and mining - Year-over-year growth (2023-2028) (%)
      • Data Table on Metal and mining - Year-over-year growth (2023-2028) (%)
    • 8.5 Papermaking - Market size and forecast (2023-2028)
      • Chart on Papermaking - Market size and forecast (2023-2028) ($ million)
      • Data Table on Papermaking - Market size and forecast (2023-2028) ($ million)
      • Chart on Papermaking - Year-over-year growth (2023-2028) (%)
      • Data Table on Papermaking - Year-over-year growth (2023-2028) (%)
    • 8.6 Automotive - Market size and forecast (2023-2028)
      • Chart on Automotive - Market size and forecast (2023-2028) ($ million)
      • Data Table on Automotive - Market size and forecast (2023-2028) ($ million)
      • Chart on Automotive - Year-over-year growth (2023-2028) (%)
      • Data Table on Automotive - Year-over-year growth (2023-2028) (%)
    • 8.7 Others - Market size and forecast (2023-2028)
      • Chart on Others - Market size and forecast (2023-2028) ($ million)
      • Data Table on Others - Market size and forecast (2023-2028) ($ million)
      • Chart on Others - Year-over-year growth (2023-2028) (%)
      • Data Table on Others - Year-over-year growth (2023-2028) (%)
    • 8.8 Market opportunity by Application
      • Market opportunity by Application ($ million)
      • Data Table on Market opportunity by Application ($ million)

    9 Market Segmentation by Type

    • 9.1 Market segments
      • Chart on Type - Market share (2023-2028) (%)
      • Data Table on Type - Market share (2023-2028) (%)
    • 9.2 Comparison by Type
      • Chart on Comparison by Type
      • Data Table on Comparison by Type
    • 9.3 Flexible Couplings - Market size and forecast (2023-2028)
      • Chart on Flexible Couplings - Market size and forecast (2023-2028) ($ million)
      • Data Table on Flexible Couplings - Market size and forecast (2023-2028) ($ million)
      • Chart on Flexible Couplings - Year-over-year growth (2023-2028) (%)
      • Data Table on Flexible Couplings - Year-over-year growth (2023-2028) (%)
    • 9.4 Rigid Couplings - Market size and forecast (2023-2028)
      • Chart on Rigid Couplings - Market size and forecast (2023-2028) ($ million)
      • Data Table on Rigid Couplings - Market size and forecast (2023-2028) ($ million)
      • Chart on Rigid Couplings - Year-over-year growth (2023-2028) (%)
      • Data Table on Rigid Couplings - Year-over-year growth (2023-2028) (%)
    • 9.5 Fluid Couplings - Market size and forecast (2023-2028)
      • Chart on Fluid Couplings - Market size and forecast (2023-2028) ($ million)
      • Data Table on Fluid Couplings - Market size and forecast (2023-2028) ($ million)
      • Chart on Fluid Couplings - Year-over-year growth (2023-2028) (%)
      • Data Table on Fluid Couplings - Year-over-year growth (2023-2028) (%)
    • 9.6 Magnetic Couplings - Market size and forecast (2023-2028)
      • Chart on Magnetic Couplings - Market size and forecast (2023-2028) ($ million)
      • Data Table on Magnetic Couplings - Market size and forecast (2023-2028) ($ million)
      • Chart on Magnetic Couplings - Year-over-year growth (2023-2028) (%)
      • Data Table on Magnetic Couplings - Year-over-year growth (2023-2028) (%)
    • 9.7 Gear Couplings - Market size and forecast (2023-2028)
      • Chart on Gear Couplings - Market size and forecast (2023-2028) ($ million)
      • Data Table on Gear Couplings - Market size and forecast (2023-2028) ($ million)
      • Chart on Gear Couplings - Year-over-year growth (2023-2028) (%)
      • Data Table on Gear Couplings - Year-over-year growth (2023-2028) (%)
    • 9.8 Market opportunity by Type
      • Market opportunity by Type ($ million)
      • Data Table on Market opportunity by Type ($ million)

    10 Market Segmentation by End-User

    • 10.1 Market segments
      • Chart on End-User - Market share (2023-2028) (%)
      • Data Table on End-User - Market share (2023-2028) (%)
    • 10.2 Comparison by End-User
      • Chart on Comparison by End-User
      • Data Table on Comparison by End-User
    • 10.3 Oil and Gas - Market size and forecast (2023-2028)
      • Chart on Oil and Gas - Market size and forecast (2023-2028) ($ million)
      • Data Table on Oil and Gas - Market size and forecast (2023-2028) ($ million)
      • Chart on Oil and Gas - Year-over-year growth (2023-2028) (%)
      • Data Table on Oil and Gas - Year-over-year growth (2023-2028) (%)
    • 10.4 Power Generation - Market size and forecast (2023-2028)
      • Chart on Power Generation - Market size and forecast (2023-2028) ($ million)
      • Data Table on Power Generation - Market size and forecast (2023-2028) ($ million)
      • Chart on Power Generation - Year-over-year growth (2023-2028) (%)
      • Data Table on Power Generation - Year-over-year growth (2023-2028) (%)
    • 10.5 Automotive - Market size and forecast (2023-2028)
      • Chart on Automotive - Market size and forecast (2023-2028) ($ million)
      • Data Table on Automotive - Market size and forecast (2023-2028) ($ million)
      • Chart on Automotive - Year-over-year growth (2023-2028) (%)
      • Data Table on Automotive - Year-over-year growth (2023-2028) (%)
    • 10.6 Manufacturing - Market size and forecast (2023-2028)
      • Chart on Manufacturing - Market size and forecast (2023-2028) ($ million)
      • Data Table on Manufacturing - Market size and forecast (2023-2028) ($ million)
      • Chart on Manufacturing - Year-over-year growth (2023-2028) (%)
      • Data Table on Manufacturing - Year-over-year growth (2023-2028) (%)
    • 10.7 Aerospace - Market size and forecast (2023-2028)
      • Chart on Aerospace - Market size and forecast (2023-2028) ($ million)
      • Data Table on Aerospace - Market size and forecast (2023-2028) ($ million)
      • Chart on Aerospace - Year-over-year growth (2023-2028) (%)
      • Data Table on Aerospace - Year-over-year growth (2023-2028) (%)
    • 10.8 Market opportunity by End-User
      • Market opportunity by End-User ($ million)
      • Data Table on Market opportunity by End-User ($ million)

    11 Customer Landscape

    • 11.1 Customer landscape overview
      • Analysis of price sensitivity, lifecycle, customer purchase basket, adoption rates, and purchase criteria

    12 Geographic Landscape

    • 12.1 Geographic segmentation
      • Chart on Market share by geography 2023-2028 (%)
      • Data Table on Market share by geography 2023-2028 (%)
    • 12.2 Geographic comparison
      • Chart on Geographic comparison
      • Data Table on Geographic comparison
    • 12.3 APAC - Market size and forecast 2023-2028
      • Chart on APAC - Market size and forecast 2023-2028 ($ million)
      • Data Table on APAC - Market size and forecast 2023-2028 ($ million)
      • Chart on APAC - Year-over-year growth 2023-2028 (%)
      • Data Table on APAC - Year-over-year growth 2023-2028 (%)
    • 12.4 Europe - Market size and forecast 2023-2028
      • Chart on Europe - Market size and forecast 2023-2028 ($ million)
      • Data Table on Europe - Market size and forecast 2023-2028 ($ million)
      • Chart on Europe - Year-over-year growth 2023-2028 (%)
      • Data Table on Europe - Year-over-year growth 2023-2028 (%)
    • 12.5 North America - Market size and forecast 2023-2028
      • Chart on North America - Market size and forecast 2023-2028 ($ million)
      • Data Table on North America - Market size and forecast 2023-2028 ($ million)
      • Chart on North America - Year-over-year growth 2023-2028 (%)
      • Data Table on North America - Year-over-year growth 2023-2028 (%)
    • 12.6 South America - Market size and forecast 2023-2028
      • Chart on South America - Market size and forecast 2023-2028 ($ million)
      • Data Table on South America - Market size and forecast 2023-2028 ($ million)
      • Chart on South America - Year-over-year growth 2023-2028 (%)
      • Data Table on South America - Year-over-year growth 2023-2028 (%)
    • 12.7 Middle East and Africa - Market size and forecast 2023-2028
      • Chart on Middle East and Africa - Market size and forecast 2023-2028 ($ million)
      • Data Table on Middle East and Africa - Market size and forecast 2023-2028 ($ million)
      • Chart on Middle East and Africa - Year-over-year growth 2023-2028 (%)
      • Data Table on Middle East and Africa - Year-over-year growth 2023-2028 (%)
    • 12.8 China - Market size and forecast 2023-2028
      • Chart on China - Market size and forecast 2023-2028 ($ million)
      • Data Table on China - Market size and forecast 2023-2028 ($ million)
      • Chart on China - Year-over-year growth 2023-2028 (%)
      • Data Table on China - Year-over-year growth 2023-2028 (%)
    • 12.9 US - Market size and forecast 2023-2028
      • Chart on US - Market size and forecast 2023-2028 ($ million)
      • Data Table on US - Market size and forecast 2023-2028 ($ million)
      • Chart on US - Year-over-year growth 2023-2028 (%)
      • Data Table on US - Year-over-year growth 2023-2028 (%)
    • 12.10 Japan - Market size and forecast 2023-2028
      • Chart on Japan - Market size and forecast 2023-2028 ($ million)
      • Data Table on Japan - Market size and forecast 2023-2028 ($ million)
      • Chart on Japan - Year-over-year growth 2023-2028 (%)
      • Data Table on Japan - Year-over-year growth 2023-2028 (%)
    • 12.11 Germany - Market size and forecast 2023-2028
      • Chart on Germany - Market size and forecast 2023-2028 ($ million)
      • Data Table on Germany - Market size and forecast 2023-2028 ($ million)
      • Chart on Germany - Year-over-year growth 2023-2028 (%)
      • Data Table on Germany - Year-over-year growth 2023-2028 (%)
    • 12.12 India - Market size and forecast 2023-2028
      • Chart on India - Market size and forecast 2023-2028 ($ million)
      • Data Table on India - Market size and forecast 2023-2028 ($ million)
      • Chart on India - Year-over-year growth 2023-2028 (%)
      • Data Table on India - Year-over-year growth 2023-2028 (%)
    • 12.13 Market opportunity by geography
      • Market opportunity by geography ($ million)
      • Data Tables on Market opportunity by geography ($ million)
    • 12.14 Canada - Market size and forecast (2023-2028)
      • Chart on Canada - Market size and forecast (2023-2028) ($ million)
      • Data Table on Canada - Market size and forecast (2023-2028) ($ million)
      • Chart on Canada - Year-over-year growth (2023-2028) (%)
      • Data Table on Canada - Year-over-year growth (2023-2028) (%)
    • 12.15 UK - Market size and forecast (2023-2028)
      • Chart on UK - Market size and forecast (2023-2028) ($ million)
      • Data Table on UK - Market size and forecast (2023-2028) ($ million)
      • Chart on UK - Year-over-year growth (2023-2028) (%)
      • Data Table on UK - Year-over-year growth (2023-2028) (%)
    • 12.16 Italy - Market size and forecast (2023-2028)
      • Chart on Italy - Market size and forecast (2023-2028) ($ million)
      • Data Table on Italy - Market size and forecast (2023-2028) ($ million)
      • Chart on Italy - Year-over-year growth (2023-2028) (%)
      • Data Table on Italy - Year-over-year growth (2023-2028) (%)
    • 12.17 France - Market size and forecast (2023-2028)
      • Chart on France - Market size and forecast (2023-2028) ($ million)
      • Data Table on France - Market size and forecast (2023-2028) ($ million)
      • Chart on France - Year-over-year growth (2023-2028) (%)
      • Data Table on France - Year-over-year growth (2023-2028) (%)
    • 12.18 Brazil - Market size and forecast (2023-2028)
      • Chart on Brazil - Market size and forecast (2023-2028) ($ million)
      • Data Table on Brazil - Market size and forecast (2023-2028) ($ million)
      • Chart on Brazil - Year-over-year growth (2023-2028) (%)
      • Data Table on Brazil - Year-over-year growth (2023-2028) (%)
    • 12.19 Egypt - Market size and forecast (2023-2028)
      • Chart on Egypt - Market size and forecast (2023-2028) ($ million)
      • Data Table on Egypt - Market size and forecast (2023-2028) ($ million)
      • Chart on Egypt - Year-over-year growth (2023-2028) (%)
      • Data Table on Egypt - Year-over-year growth (2023-2028) (%)
    • 12.20 UAE - Market size and forecast (2023-2028)
      • Chart on UAE - Market size and forecast (2023-2028) ($ million)
      • Data Table on UAE - Market size and forecast (2023-2028) ($ million)
      • Chart on UAE - Year-over-year growth (2023-2028) (%)
      • Data Table on UAE - Year-over-year growth (2023-2028) (%)
    • 12.21 Oman - Market size and forecast (2023-2028)
      • Chart on Oman - Market size and forecast (2023-2028) ($ million)
      • Data Table on Oman - Market size and forecast (2023-2028) ($ million)
      • Chart on Oman - Year-over-year growth (2023-2028) (%)
      • Data Table on Oman - Year-over-year growth (2023-2028) (%)
    • 12.22 Argentina - Market size and forecast (2023-2028)
      • Chart on Argentina - Market size and forecast (2023-2028) ($ million)
      • Data Table on Argentina - Market size and forecast (2023-2028) ($ million)
      • Chart on Argentina - Year-over-year growth (2023-2028) (%)
      • Data Table on Argentina - Year-over-year growth (2023-2028) (%)
    • 12.23 KSA - Market size and forecast (2023-2028)
      • Chart on KSA - Market size and forecast (2023-2028) ($ million)
      • Data Table on KSA - Market size and forecast (2023-2028) ($ million)
      • Chart on KSA - Year-over-year growth (2023-2028) (%)
      • Data Table on KSA - Year-over-year growth (2023-2028) (%)
    • 12.24 Rest of World (ROW) - Market size and forecast (2023-2028)
      • Chart on Rest of World (ROW) - Market size and forecast (2023-2028) ($ million)
      • Data Table on Rest of World (ROW) - Market size and forecast (2023-2028) ($ million)
      • Chart on Rest of World (ROW) - Year-over-year growth (2023-2028) (%)
      • Data Table on Rest of World (ROW) - Year-over-year growth (2023-2028) (%)

    13 Drivers, Challenges, and Opportunity/Restraints

    • 13.1 Market drivers
      • 13.2 Market challenges
        • 13.3 Impact of drivers and challenges
          • Impact of drivers and challenges in 2023 and 2028
        • 13.4 Market opportunities/restraints

          14 Competitive Landscape

          • 14.1 Overview
            • 14.2 Competitive Landscape
              • Overview on criticality of inputs and factors of differentiation
            • 14.3 Landscape disruption
              • Overview on factors of disruption
            • 14.4 Industry risks
              • Impact of key risks on business

            15 Competitive Analysis

            • 15.1 Companies profiled
              • Companies covered
            • 15.2 Market positioning of companies
              • Matrix on companies position and classification
            • 15.3 AB SKF
              • AB SKF - Overview
              • AB SKF - Business segments
              • AB SKF - Key news
              • AB SKF - Key offerings
              • AB SKF - Segment focus
            • 15.4 Chr. Mayr GmbH Co. KG
              • Chr. Mayr GmbH Co. KG - Overview
              • Chr. Mayr GmbH Co. KG - Product / Service
              • Chr. Mayr GmbH Co. KG - Key offerings
            • 15.5 Daido Steel Co. Ltd.
              • Daido Steel Co. Ltd. - Overview
              • Daido Steel Co. Ltd. - Business segments
              • Daido Steel Co. Ltd. - Key offerings
              • Daido Steel Co. Ltd. - Segment focus
            • 15.6 DieQua Corp.
              • DieQua Corp. - Overview
              • DieQua Corp. - Product / Service
              • DieQua Corp. - Key offerings
            • 15.7 Genuine Parts Co.
              • Genuine Parts Co. - Overview
              • Genuine Parts Co. - Business segments
              • Genuine Parts Co. - Key offerings
              • Genuine Parts Co. - Segment focus
            • 15.8 KTR Systems GmbH
              • KTR Systems GmbH - Overview
              • KTR Systems GmbH - Product / Service
              • KTR Systems GmbH - Key offerings
            • 15.9 MECVEL Srl
              • MECVEL Srl - Overview
              • MECVEL Srl - Product / Service
              • MECVEL Srl - Key offerings
            • 15.10 Michelin Group
              • Michelin Group - Overview
              • Michelin Group - Business segments
              • Michelin Group - Key news
              • Michelin Group - Key offerings
              • Michelin Group - Segment focus
            • 15.11 R W Antriebselemente GmbH
              • R W Antriebselemente GmbH - Overview
              • R W Antriebselemente GmbH - Product / Service
              • R W Antriebselemente GmbH - Key offerings
            • 15.12 Ramsey Products Corp.
              • Ramsey Products Corp. - Overview
              • Ramsey Products Corp. - Product / Service
              • Ramsey Products Corp. - Key offerings
            • 15.13 Regal Rexnord Corp.
              • Regal Rexnord Corp. - Overview
              • Regal Rexnord Corp. - Business segments
              • Regal Rexnord Corp. - Key news
              • Regal Rexnord Corp. - Key offerings
              • Regal Rexnord Corp. - Segment focus
            • 15.14 SHV Holdings N.V.
              • SHV Holdings N.V. - Overview
              • SHV Holdings N.V. - Product / Service
              • SHV Holdings N.V. - Key offerings
            • 15.15 The Timken Co.
              • The Timken Co. - Overview
              • The Timken Co. - Business segments
              • The Timken Co. - Key news
              • The Timken Co. - Key offerings
              • The Timken Co. - Segment focus
            • 15.16 Tsubakimoto Chain Co.
              • Tsubakimoto Chain Co. - Overview
              • Tsubakimoto Chain Co. - Business segments
              • Tsubakimoto Chain Co. - Key offerings
              • Tsubakimoto Chain Co. - Segment focus
            • 15.17 Voith GmbH and Co. KGaA
              • Voith GmbH and Co. KGaA - Overview
              • Voith GmbH and Co. KGaA - Business segments
              • Voith GmbH and Co. KGaA - Key news
              • Voith GmbH and Co. KGaA - Key offerings
              • Voith GmbH and Co. KGaA - Segment focus

            16 Appendix

            • 16.1 Scope of the report
              • 16.2 Inclusions and exclusions checklist
                • Inclusions checklist
                • Exclusions checklist
              • 16.3 Currency conversion rates for US$
                • Currency conversion rates for US$
              • 16.4 Research methodology
                • Research methodology
              • 16.5 Data procurement
                • Information sources
              • 16.6 Data validation
                • Data validation
              • 16.7 Validation techniques employed for market sizing
                • Validation techniques employed for market sizing
              • 16.8 Data synthesis
                • Data synthesis
              • 16.9 360 degree market analysis
                • 360 degree market analysis
              • 16.10 List of abbreviations
                • List of abbreviations

              Research Methodology

              Technavio presents a detailed picture of the market by way of study, synthesis, and summation of data from multiple sources. The analysts have presented the various facets of the market with a particular focus on identifying the key industry influencers. The data thus presented is comprehensive, reliable, and the result of extensive research, both primary and secondary.

              INFORMATION SOURCES

              Primary sources

              • Manufacturers and suppliers
              • Channel partners
              • Industry experts
              • Strategic decision makers

              Secondary sources

              • Industry journals and periodicals
              • Government data
              • Financial reports of key industry players
              • Historical data
              • Press releases

              DATA ANALYSIS

              Data Synthesis

              • Collation of data
              • Estimation of key figures
              • Analysis of derived insights

              Data Validation

              • Triangulation with data models
              • Reference against proprietary databases
              • Corroboration with industry experts

              REPORT WRITING

              Qualitative

              • Market drivers
              • Market challenges
              • Market trends
              • Five forces analysis

              Quantitative

              • Market size and forecast
              • Market segmentation
              • Geographical insights
              • Competitive landscape

              Interested in this report?

              Get your sample now to see our research methodology and insights!

              Download Now

              Frequently Asked Questions

              Couplings market growth will increase by $ 205.7 mn during 2024-2028 .

              The Couplings market is expected to grow at a CAGR of 1.7% during 2024-2028 .

              Couplings market is segmented by Product( Elastomeric couplings, Metallic couplings, Mechanical couplings, Others) Application( Power generation, Metal and mining, Papermaking, Automotive, Others)

              AB SKF, Chr. Mayr GmbH Co. KG, Daido Steel Co. Ltd., DieQua Corp., Genuine Parts Co., Haudenschild Holding AG, Industrial Clutch Parts Ltd., KBK Antriebstechnik GmbH, KTR Systems GmbH, MECVEL Srl, Michelin Group, R W Antriebselemente GmbH, Ramsey Products Corp., Regal Rexnord Corp., RINGSPANN GmbH, SCHMIDT-KUPPLUNG GmbH, SHV Holdings N.V., The Timken Co., Tsubakimoto Chain Co., Voith GmbH and Co. KGaA are a few of the key vendors in the Couplings market.

              APAC will register the highest growth rate of 58% among the other regions. Therefore, the Couplings market in APAC is expected to garner significant business opportunities for the vendors during the forecast period.

              US, Canada, Germany, UK, Italy, France, China, India, Japan, Brazil, Egypt, UAE, Oman, Argentina, KSA, UAE, Brazil, Rest of World (ROW)

              • Stringent emission regulationsGlobal warming is harmful to the environment. It is caused by the accumulation of greenhouse gases in the atmosphere is the driving factor this market.
              • which primarily occurs by burning fossil fuels. Coal-fired power plants are one of the largest emitters of carbon dioxide. For instance is the driving factor this market.
              • about 30% of the overall carbon dioxide emissions from the energy sector are generated from coal-fired power plants. The timely replacement of components such as seals is the driving factor this market.
              • valves is the driving factor this market.
              • and couplings control the emissions to a certain extent. Therefore is the driving factor this market.
              • the increasing stringency of emission regulations across various regions is expected to drive the global couplings market during the forecast period. For instance is the driving factor this market.
              • in 2022 is the driving factor this market.
              • China was the largest greenhouse gases emitter is the driving factor this market.
              • and the country aims to achieve carbon neutrality by 2060. Similarly is the driving factor this market.
              • the US Government has set stringent emission norms to reduce harmful emissions from power plants. The goals mentioned above are expected to be met by 2030.Various governments and international organizations is the driving factor this market.
              • such as the US EPA is the driving factor this market.
              • have set stringent regulations and standards for the mining is the driving factor this market.
              • refining is the driving factor this market.
              • oil and gas is the driving factor this market.
              • power is the driving factor this market.
              • and chemical industries to control toxic emissions and improve the safety of operations. These developments have surged the manufacturing of high-quality couplings that can prevent contamination of end-products. The US has laid down CAFE standards under the Energy Policy and Conservation Act and GHG emission standards under the Clean Air Act to regulate fuel economy and gas emissions is the driving factor this market.
              • respectively. CAFE standards necessitate vehicle manufacturers to comply with the gas mileage and fuel economy standards set by the DOT. These standards have increased the manufacturing of high-quality automotive couplings that can efficiently limit fuel emissions in vehicles. End-users of various industries are striving to improve the overall performance of equipment used for various processes to reduce operational costs and equipment downtime. Such factors are expected to drive the global couplings market during the forecast period. is the driving factor this market.

              The Couplings market vendors should focus on grabbing business opportunities from the Elastomeric couplings segment as it accounted for the largest market share in the base year.