Wireless Power Transmission Market Analysis APAC, Europe, North America, South America, Middle East and Africa - US, China, Germany, Japan, UK - Size and Forecast 2024-2028

Wireless Power Transmission Market Analysis APAC, Europe, North America, South America, Middle East and Africa - US, China, Germany, Japan, UK - Size and Forecast 2024-2028

Published: Aug 2024 180 Pages SKU: IRTNTR70967

Market Overview at a Glance

$29.61 B
Market Opportunity
30.96%
CAGR
22.69
YoY growth 2023-2024(%)

Wireless Power Transmission Market Size 2024-2028 

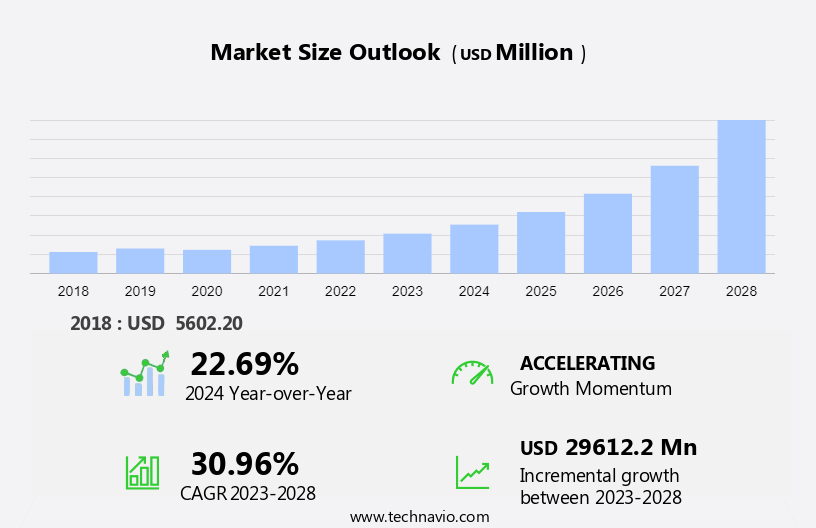
The wireless power transmission market size is forecast to increase by USD 29.61 billion at a CAGR of 30.96% between 2023 and 2028. The market is experiencing significant growth due to the increasing adoption of Inductive charging technology in various industries. Inductive pads are becoming increasingly popular in powering Industrial IoT devices and industrial sensors, streamlining the process of charging these devices without the need for physical connections. The trend towards automation and the Internet of Things (IoT) is driving investment in wireless power transmission solutions. Near-field technologies, on the other hand, are ideal for charging smaller devices like mobile phones and medical sensors. However, there are limitations to this technology, including the need for precise alignment between the transmitter and receiver, and the potential for interference from other wireless signals. Infrared and magnetic resonance are alternative wireless power transmission technologies that offer greater flexibility in terms of alignment and distance, but face their own challenges in terms of efficiency and cost. Overall, the market for wireless power transmission is poised for continued growth, as industries seek to reduce the complexity and cost of charging their IoT devices and sensors.

Wireless Power Transmission Market Size

 Request Free Sample

The wireless power transmission (WPT) market is experiencing significant growth due to the increasing adoption of near-field and far-field technologies. These technologies enable the transfer of electrical energy between two objects through the air, eliminating the need for physical connections. Near-field technologies, such as magnetic resonance and magnetic induction, have gained popularity in the market due to their ability to transfer power over short distances. Applications of near-field technologies include industrial IoT (Internet of Things) and connected devices, such as smartphones, computers, and wireless chargers. Far-field technology, also known as power at a distance, is gaining traction due to its ability to transmit power over long distances.

Furthermore, this technology is expected to revolutionize power distribution systems, particularly in the context of WPT-based smart grids. The integration of WPT systems in smart grids will enable efficient power distribution and reduce energy losses. Investment in the WPT market is on the rise, as companies recognize the potential of this technology to transform various industries. A well-diversified portfolio in this market can yield significant returns. Strategies for investment include focusing on research and development of new technologies, partnerships with key players, and expanding the application areas of WPT. The integration of WPT technology in industrial IoT and connected devices is expected to drive market growth.

Also, the increasing number of smart meters and appliances in homes and offices is also contributing to the market's growth. The adoption of WPT technology in mobile phones and computers is expected to increase, as manufacturers seek to eliminate the need for wired charging. In conclusion, the market is poised for growth due to the technological advancements in near-field and far-field technologies. Investment in this market can yield significant returns, particularly in the areas of industrial IoT, connected devices, and power distribution systems. Companies that focus on research and development, partnerships, and expanding application areas are expected to succeed in this market.

Market Segmentation

The market research report provides comprehensive data (region-wise segment analysis), with forecasts and estimates in "USD billion" for the period 2024-2028, as well as historical data from 2018-2022 for the following segments.
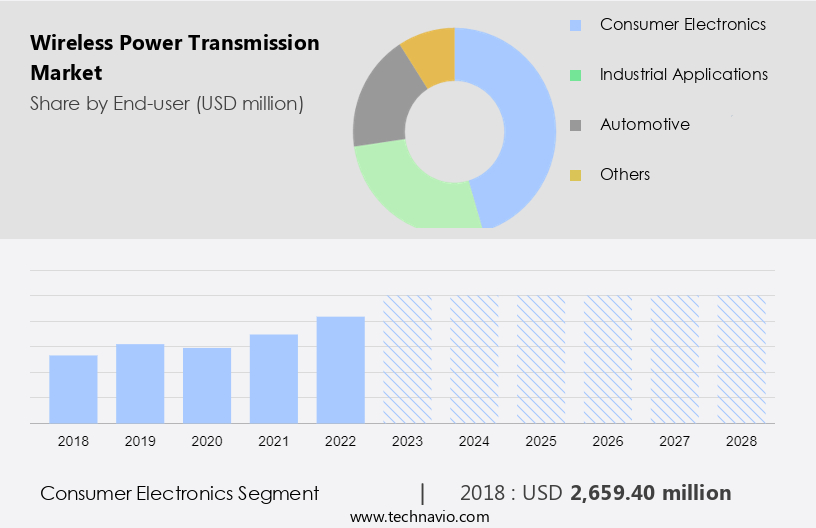
  • End-user
    • Consumer electronics
    • Industrial applications
    • Automotive
    • Others
  • Technology
    • Near field technology
    • Far field technology
  • Geography
    • APAC
      • China
      • Japan
    • Europe
      • Germany
      • UK
    • North America
      • US
    • South America
    • Middle East and Africa

By End-user Insights

The consumer electronics segment is estimated to witness significant growth during the forecast period. The market for wireless power transmission is gaining traction in the US, particularly in the realm of lifestyle devices such as mobile phones and medical devices. Two primary technologies are driving this trend: magnetic resonance and near-field technologies. Magnetic resonance enables the transmission of power over longer distances, making it suitable for charging electric vehicles and powering home appliances. In the consumer electronics sector, devices such as smartphones, laptops, and wearables are increasingly relying on wireless power transmission for data exchange and charging.

Furthermore, the adoption of these technologies is fueled by the growing number of commercial and industrial applications. For instance, the industrial Internet of Things (IIoT) is creating new opportunities for wireless power transmission in industrial settings. Moreover, the increasing automation of industries is driving the demand for industrial PCs, which require wireless power transmission for optimal performance. 

In conclusion, wireless power transmission is becoming an essential technology for various industries and consumer electronics. Its ability to enable seamless and efficient power transfer without the need for cords or wires is making it increasingly popular. As the market for wireless power transmission continues to grow, we can expect to see new applications and innovations in this space.

Wireless Power Transmission Market Size

Get a glance at the market share of various segments Request Free Sample

The consumer electronics segment was valued at USD 2.66 billion in 2018 and showed a gradual increase during the forecast period.

Regional Insights

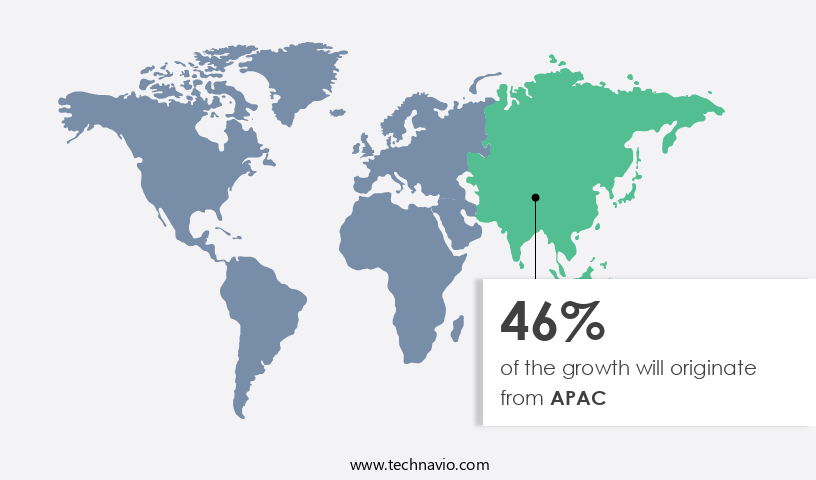
APAC is estimated to contribute 46% to the growth of the global market during the forecast period. Technavio's analysts have elaborately explained the regional trends and drivers that shape the market during the forecast period.

Wireless Power Transmission Market Share by Geography

For more insights on the market share of various regions Request Free Sample

Wireless power transmission, also known as wireless charging, is a technology that enables the transfer of power between devices without the need for physical connections. WPT systems have gained significant traction in various industries, including wireless charging for consumer electronics and electric vehicles. In the North American region, China and Japan are leading consumers of WPT systems, driven by the strong demand from the automotive and consumer electronics sectors. The Chinese electric vehicle market is experiencing rapid growth, making it a significant contributor to the market's expansion in the region. Additionally, the Asia Pacific (APAC) region is expected to remain a major consumer of consumer electronics during the forecast period. With major electronic device manufacturers based in APAC, this region is a hub for the production of flat-panel displays, smartphones, tablets, and wearable devices, all of which are major consumers of wireless power transmission technology. 

Our researchers analyzed the data with 2023 as the base year, along with the key drivers, trends, and challenges. A holistic analysis of drivers will help companies refine their marketing strategies to gain a competitive advantage.

Market Driver

The rapid growth in wireless transmission is the key driver of the market. The market has gained traction in recent years due to the increasing demand for efficient and cost-effective power solutions for appliances and battery-powered equipment. Unlike conventional power transmission methods that rely on wires and physical contact, wireless power transmission offers a reliable and contactless alternative. Although utility-scale wireless power transmission is still in its infancy, the growing importance of reducing infrastructure costs and the need for seamless charging solutions for connected devices and consumer electronics are expected to fuel its growth. Utilities, which provide essential services such as water, electricity, and natural gas, are continually seeking innovative ways to reduce costs and improve efficiency.

However, wireless power transmission eliminates the need for expensive equipment and additional devices, such as electrical and mechanical auxiliaries, pole control, and valve control, associated with traditional power transmission. As the market for wireless power transmission continues to evolve, it is poised to revolutionize the way we power our appliances and devices, offering a more convenient and cost-effective solution. 

Market Trends

The evolution of smart grids is the upcoming trend in the market. In the utility sector, the adoption of smart grids is gaining momentum as a means to deliver sustainable, secure, and economical electricity to consumers. Inductive technologies, such as inductive pads, play a crucial role in this context by facilitating wireless power transmission. The Industrial Internet of Things (IIoT) is driving the demand for such technologies, as industrial sensors require a constant power source for optimal performance. Infrared and other wireless technologies are also being explored for their potential in powering IoT devices. The investment in smart grid infrastructure is expected to increase significantly in the coming years, with North America and China leading the way.

Furthermore, transmission lines in smart grids are being integrated with wireless networks to deliver real-time price information to consumers. This enables consumers to adjust their electricity consumption based on price fluctuations, promoting energy efficiency and cost savings. Technavio provides valuable insights into market trends, growth drivers, and competitive landscape. In conclusion, the integration of wireless power transmission technologies in smart grids is revolutionizing the utility sector by enabling efficient, real-time energy management and cost savings for consumers. The market for wireless power transmission is expected to grow significantly in the coming years, driven by the increasing adoption of IoT devices and the need for sustainable and secure energy solutions.

Market Challenge

The limitations of wireless transmission is a key challenge affecting the market growth. Wireless power transmission is a significant solution for addressing energy consumption concerns in consumer goods, including electric vehicles (EVs) and electronic devices. However, the limited battery capacity and operational time of wireless transmission systems pose a challenge. Obstacles between transmitters and receivers can also hinder wireless transmission operations. Consequently, powering sensor nodes in wireless power transmission remains a significant hurdle, despite advancements in battery technology and energy-efficient methods.

However, inductive coupling is effective only over short distances, but extending its range involves additional infrastructure costs through the use of far-field technology, such as coupled magnetic resonances. Fitness trackers and feature phones are among the consumer goods that could benefit from wireless power transmission, contributing to improved fuel economy and convenience.

Exclusive Customer Landscape

The market forecasting report includes the adoption lifecycle of the market, covering from the innovator's stage to the laggard's stage. It focuses on adoption rates in different regions based on penetration. Furthermore, the report also includes key purchase criteria and drivers of price sensitivity to help companies evaluate and develop their market growth analysis strategies.

Wireless Power Transmission Market Share by Geography

 Customer Landscape

Key Companies & Market Insights

Companies are implementing various strategies, such as strategic alliances, partnerships, mergers and acquisitions, geographical expansion, and product/service launches, to enhance their presence in the market.

Analog Devices Inc: The company offers wireless power transmission systems, which helps charge sealed enclosures that are exposed to dirt and hazardous environment.

The market research and growth report includes detailed analyses of the competitive landscape of the market and information about key companies, including:

  • ConvenientPower Semiconductor
  • Energous Corp.
  • Energysquare SAS
  • Humavox Ltd.
  • Koninklijke Philips N.V.
  • Leggett and Platt Inc.
  • Murata Manufacturing Co. Ltd.
  • Nucurrent Inc.
  • NXP Semiconductors NV
  • Ossia Inc.
  • PLUGLESS POWER INC.
  • Powermat Technologies Ltd.
  • Renesas Electronics Corp.
  • Salcomp PLC
  • Samsung Electronics Co. Ltd.
  • Semtech Corp.
  • TDK Corp.
  • Wi Charge
  • WiTricity Corp.

Qualitative and quantitative analysis of companies has been conducted to help clients understand the wider business environment as well as the strengths and weaknesses of key market players. Data is qualitatively analyzed to categorize companies as pure play, category-focused, industry-focused, and diversified; it is quantitatively analyzed to categorize companies as dominant, leading, strong, tentative, and weak.

Research Analyst Overview

Wireless power transmission is revolutionizing the way we charge various appliances and battery-powered equipment. This technology is increasingly being adopted for a wide range of applications, from consumer electronics such as smartphones, tablets, and laptops to industrial IoT devices and electric vehicles (EVs). Wireless charging stations are becoming commonplace, with inductive and resonant technologies like magnetic resonance and far-field technology enabling seamless charging of connected devices. The market for wireless power transmission is expanding rapidly, driven by the growing demand for convenient and efficient charging solutions. Consumer goods, including appliances, consumer electronics, and lifestyle devices, are major contributors to this growth.

In addition, the integration of wireless charging technology in industrial sensors and medical devices is expected to boost the market's growth. Wireless power transmission systems are also being used in smart home devices, smart meters, and smartphone charging pads. The technology's performance levels are continually improving, with investment in research and development leading to advancements in user experience, standardization, and fuel economy. Wireless charging strategies are becoming essential for companies looking to stay competitive in the market. The adoption of WPT-based smart grids is expected to further drive the market's growth, as the technology becomes an integral part of the power distribution systems of the future.

In conclusion, wireless power transmission is transforming the way we charge our devices, from consumer electronics to industrial equipment. The market's growth is driven by the convenience, efficiency, and performance benefits of wireless charging, making it a key area of investment for companies and consumers alike.

Market Scope

Report Coverage

Details

Page number

180

Base year

2023

Historic period

2018-2022

Forecast period

2024-2028

Growth momentum & CAGR

Accelerate at a CAGR of 30.96%

Market growth 2024-2028

USD 29.61 billion

Market structure

Fragmented

YoY growth 2023-2024(%)

22.69

Regional analysis

APAC, Europe, North America, South America, and Middle East and Africa

Performing market contribution

APAC at 46%

Key countries

US, China, Germany, Japan, and UK

Competitive landscape

Leading Companies, Market Positioning of Companies, Competitive Strategies, and Industry Risks

Key companies profiled

Analog Devices Inc., ConvenientPower Semiconductor, Energous Corp., Energysquare SAS, Humavox Ltd., Koninklijke Philips N.V., Leggett and Platt Inc., Murata Manufacturing Co. Ltd., Nucurrent Inc., NXP Semiconductors NV, Ossia Inc., PLUGLESS POWER INC., Powermat Technologies Ltd., Renesas Electronics Corp., Salcomp PLC, Samsung Electronics Co. Ltd., Semtech Corp., TDK Corp., Wi Charge, and WiTricity Corp.

Market dynamics

Parent market analysis, market growth inducers and obstacles, market forecast, fast-growing and slow-growing segment analysis, COVID-19 impact and recovery analysis and future consumer dynamics, market condition analysis for the forecast period

Customization purview

If our market report has not included the data that you are looking for, you can reach out to our analysts and get segments customized.

Request Free Sample

What are the Key Data Covered in this Market Research and Growth Report?

  • CAGR of the market during the forecast period
  • Detailed information on factors that will drive the market growth and forecasting between 2024 and 2028
  • Precise estimation of the size of the market  and its contribution of the market in focus to the parent market
  • Accurate predictions about upcoming market growth and trends and changes in consumer behaviour
  • Growth of the market across APAC, Europe, North America, South America, and Middle East and Africa
  • Thorough analysis of the market's competitive landscape and detailed information about companies
  • Comprehensive analysis of factors that will challenge the growth of market companies

We can help! Our analysts can customize this market research report to meet your requirements. Get in touch

1 Executive Summary

  • 1.1 Market overview
    • Executive Summary - Chart on Market Overview
    • Executive Summary - Data Table on Market Overview
    • Executive Summary - Chart on Global Market Characteristics
    • Executive Summary - Chart on Market by Geography
    • Executive Summary - Chart on Market Segmentation by End-user
    • Executive Summary - Chart on Market Segmentation by Technology
    • Executive Summary - Chart on Incremental Growth
    • Executive Summary - Data Table on Incremental Growth
    • Executive Summary - Chart on Company Market Positioning

2 Market Landscape

  • 2.1 Market ecosystem
    • Parent Market
    • Data Table on - Parent Market
  • 2.2 Market characteristics
    • Market characteristics analysis
  • 2.3 Value chain analysis
    • Value Chain Analysis

3 Market Sizing

  • 3.1 Market definition
    • Offerings of companies included in the market definition
  • 3.2 Market segment analysis
    • Market segments
  • 3.3 Market size 2023
    • 3.4 Market outlook: Forecast for 2023-2028
      • Chart on Global - Market size and forecast 2023-2028 ($ million)
      • Data Table on Global - Market size and forecast 2023-2028 ($ million)
      • Chart on Global Market: Year-over-year growth 2023-2028 (%)
      • Data Table on Global Market: Year-over-year growth 2023-2028 (%)

    4 Historic Market Size

    • 4.1 Global Wireless Power Transmission Market 2018 - 2022
      • Historic Market Size - Data Table on Global Wireless Power Transmission Market 2018 - 2022 ($ million)
    • 4.2 End-user segment analysis 2018 - 2022
      • Historic Market Size - End-user Segment 2018 - 2022 ($ million)
    • 4.3 Technology segment analysis 2018 - 2022
      • Historic Market Size - Technology Segment 2018 - 2022 ($ million)
    • 4.4 Geography segment analysis 2018 - 2022
      • Historic Market Size - Geography Segment 2018 - 2022 ($ million)
    • 4.5 Country segment analysis 2018 - 2022
      • Historic Market Size - Country Segment 2018 - 2022 ($ million)

    5 Five Forces Analysis

    • 5.1 Five forces summary
      • Five forces analysis - Comparison between 2023 and 2028
    • 5.2 Bargaining power of buyers
      • Bargaining power of buyers - Impact of key factors 2023 and 2028
    • 5.3 Bargaining power of suppliers
      • Bargaining power of suppliers - Impact of key factors in 2023 and 2028
    • 5.4 Threat of new entrants
      • Threat of new entrants - Impact of key factors in 2023 and 2028
    • 5.5 Threat of substitutes
      • Threat of substitutes - Impact of key factors in 2023 and 2028
    • 5.6 Threat of rivalry
      • Threat of rivalry - Impact of key factors in 2023 and 2028
    • 5.7 Market condition
      • Chart on Market condition - Five forces 2023 and 2028

    6 Market Segmentation by End-user

    • 6.1 Market segments
      • Chart on End-user - Market share 2023-2028 (%)
      • Data Table on End-user - Market share 2023-2028 (%)
    • 6.2 Comparison by End-user
      • Chart on Comparison by End-user
      • Data Table on Comparison by End-user
    • 6.3 Consumer electronics - Market size and forecast 2023-2028
      • Chart on Consumer electronics - Market size and forecast 2023-2028 ($ million)
      • Data Table on Consumer electronics - Market size and forecast 2023-2028 ($ million)
      • Chart on Consumer electronics - Year-over-year growth 2023-2028 (%)
      • Data Table on Consumer electronics - Year-over-year growth 2023-2028 (%)
    • 6.4 Industrial applications - Market size and forecast 2023-2028
      • Chart on Industrial applications - Market size and forecast 2023-2028 ($ million)
      • Data Table on Industrial applications - Market size and forecast 2023-2028 ($ million)
      • Chart on Industrial applications - Year-over-year growth 2023-2028 (%)
      • Data Table on Industrial applications - Year-over-year growth 2023-2028 (%)
    • 6.5 Automotive - Market size and forecast 2023-2028
      • Chart on Automotive - Market size and forecast 2023-2028 ($ million)
      • Data Table on Automotive - Market size and forecast 2023-2028 ($ million)
      • Chart on Automotive - Year-over-year growth 2023-2028 (%)
      • Data Table on Automotive - Year-over-year growth 2023-2028 (%)
    • 6.6 Others - Market size and forecast 2023-2028
      • Chart on Others - Market size and forecast 2023-2028 ($ million)
      • Data Table on Others - Market size and forecast 2023-2028 ($ million)
      • Chart on Others - Year-over-year growth 2023-2028 (%)
      • Data Table on Others - Year-over-year growth 2023-2028 (%)
    • 6.7 Market opportunity by End-user
      • Market opportunity by End-user ($ million)
      • Data Table on Market opportunity by End-user ($ million)

    7 Market Segmentation by Technology

    • 7.1 Market segments
      • Chart on Technology - Market share 2023-2028 (%)
      • Data Table on Technology - Market share 2023-2028 (%)
    • 7.2 Comparison by Technology
      • Chart on Comparison by Technology
      • Data Table on Comparison by Technology
    • 7.3 Near field technology - Market size and forecast 2023-2028
      • Chart on Near field technology - Market size and forecast 2023-2028 ($ million)
      • Data Table on Near field technology - Market size and forecast 2023-2028 ($ million)
      • Chart on Near field technology - Year-over-year growth 2023-2028 (%)
      • Data Table on Near field technology - Year-over-year growth 2023-2028 (%)
    • 7.4 Far field technology - Market size and forecast 2023-2028
      • Chart on Far field technology - Market size and forecast 2023-2028 ($ million)
      • Data Table on Far field technology - Market size and forecast 2023-2028 ($ million)
      • Chart on Far field technology - Year-over-year growth 2023-2028 (%)
      • Data Table on Far field technology - Year-over-year growth 2023-2028 (%)
    • 7.5 Market opportunity by Technology
      • Market opportunity by Technology ($ million)
      • Data Table on Market opportunity by Technology ($ million)

    8 Customer Landscape

    • 8.1 Customer landscape overview
      • Analysis of price sensitivity, lifecycle, customer purchase basket, adoption rates, and purchase criteria

    9 Geographic Landscape

    • 9.1 Geographic segmentation
      • Chart on Market share by geography 2023-2028 (%)
      • Data Table on Market share by geography 2023-2028 (%)
    • 9.2 Geographic comparison
      • Chart on Geographic comparison
      • Data Table on Geographic comparison
    • 9.3 APAC - Market size and forecast 2023-2028
      • Chart on APAC - Market size and forecast 2023-2028 ($ million)
      • Data Table on APAC - Market size and forecast 2023-2028 ($ million)
      • Chart on APAC - Year-over-year growth 2023-2028 (%)
      • Data Table on APAC - Year-over-year growth 2023-2028 (%)
    • 9.4 Europe - Market size and forecast 2023-2028
      • Chart on Europe - Market size and forecast 2023-2028 ($ million)
      • Data Table on Europe - Market size and forecast 2023-2028 ($ million)
      • Chart on Europe - Year-over-year growth 2023-2028 (%)
      • Data Table on Europe - Year-over-year growth 2023-2028 (%)
    • 9.5 North America - Market size and forecast 2023-2028
      • Chart on North America - Market size and forecast 2023-2028 ($ million)
      • Data Table on North America - Market size and forecast 2023-2028 ($ million)
      • Chart on North America - Year-over-year growth 2023-2028 (%)
      • Data Table on North America - Year-over-year growth 2023-2028 (%)
    • 9.6 South America - Market size and forecast 2023-2028
      • Chart on South America - Market size and forecast 2023-2028 ($ million)
      • Data Table on South America - Market size and forecast 2023-2028 ($ million)
      • Chart on South America - Year-over-year growth 2023-2028 (%)
      • Data Table on South America - Year-over-year growth 2023-2028 (%)
    • 9.7 Middle East and Africa - Market size and forecast 2023-2028
      • Chart on Middle East and Africa - Market size and forecast 2023-2028 ($ million)
      • Data Table on Middle East and Africa - Market size and forecast 2023-2028 ($ million)
      • Chart on Middle East and Africa - Year-over-year growth 2023-2028 (%)
      • Data Table on Middle East and Africa - Year-over-year growth 2023-2028 (%)
    • 9.8 US - Market size and forecast 2023-2028
      • Chart on US - Market size and forecast 2023-2028 ($ million)
      • Data Table on US - Market size and forecast 2023-2028 ($ million)
      • Chart on US - Year-over-year growth 2023-2028 (%)
      • Data Table on US - Year-over-year growth 2023-2028 (%)
    • 9.9 China - Market size and forecast 2023-2028
      • Chart on China - Market size and forecast 2023-2028 ($ million)
      • Data Table on China - Market size and forecast 2023-2028 ($ million)
      • Chart on China - Year-over-year growth 2023-2028 (%)
      • Data Table on China - Year-over-year growth 2023-2028 (%)
    • 9.10 Germany - Market size and forecast 2023-2028
      • Chart on Germany - Market size and forecast 2023-2028 ($ million)
      • Data Table on Germany - Market size and forecast 2023-2028 ($ million)
      • Chart on Germany - Year-over-year growth 2023-2028 (%)
      • Data Table on Germany - Year-over-year growth 2023-2028 (%)
    • 9.11 Japan - Market size and forecast 2023-2028
      • Chart on Japan - Market size and forecast 2023-2028 ($ million)
      • Data Table on Japan - Market size and forecast 2023-2028 ($ million)
      • Chart on Japan - Year-over-year growth 2023-2028 (%)
      • Data Table on Japan - Year-over-year growth 2023-2028 (%)
    • 9.12 UK - Market size and forecast 2023-2028
      • Chart on UK - Market size and forecast 2023-2028 ($ million)
      • Data Table on UK - Market size and forecast 2023-2028 ($ million)
      • Chart on UK - Year-over-year growth 2023-2028 (%)
      • Data Table on UK - Year-over-year growth 2023-2028 (%)
    • 9.13 Market opportunity by geography
      • Market opportunity by geography ($ million)
      • Data Tables on Market opportunity by geography ($ million)

    10 Drivers, Challenges, and Opportunity/Restraints

    • 10.1 Market drivers
      • 10.2 Market challenges
        • 10.3 Impact of drivers and challenges
          • Impact of drivers and challenges in 2023 and 2028
        • 10.4 Market opportunities/restraints

          11 Competitive Landscape

          • 11.1 Overview
            • 11.2 Competitive Landscape
              • Overview on criticality of inputs and factors of differentiation
            • 11.3 Landscape disruption
              • Overview on factors of disruption
            • 11.4 Industry risks
              • Impact of key risks on business

            12 Competitive Analysis

            • 12.1 Companies profiled
              • Companies covered
            • 12.2 Market positioning of companies
              • Matrix on companies position and classification
            • 12.3 Analog Devices Inc.
              • Analog Devices Inc. - Overview
              • Analog Devices Inc. - Business segments
              • Analog Devices Inc. - Key news
              • Analog Devices Inc. - Key offerings
              • Analog Devices Inc. - Segment focus
            • 12.4 ConvenientPower Semiconductor
              • ConvenientPower Semiconductor - Overview
              • ConvenientPower Semiconductor - Product / Service
              • ConvenientPower Semiconductor - Key offerings
            • 12.5 Energous Corp.
              • Energous Corp. - Overview
              • Energous Corp. - Product / Service
              • Energous Corp. - Key offerings
            • 12.6 Koninklijke Philips N.V.
              • Koninklijke Philips N.V. - Overview
              • Koninklijke Philips N.V. - Business segments
              • Koninklijke Philips N.V. - Key news
              • Koninklijke Philips N.V. - Key offerings
              • Koninklijke Philips N.V. - Segment focus
            • 12.7 Leggett and Platt Inc.
              • Leggett and Platt Inc. - Overview
              • Leggett and Platt Inc. - Business segments
              • Leggett and Platt Inc. - Key news
              • Leggett and Platt Inc. - Key offerings
              • Leggett and Platt Inc. - Segment focus
            • 12.8 Murata Manufacturing Co. Ltd.
              • Murata Manufacturing Co. Ltd. - Overview
              • Murata Manufacturing Co. Ltd. - Business segments
              • Murata Manufacturing Co. Ltd. - Key news
              • Murata Manufacturing Co. Ltd. - Key offerings
              • Murata Manufacturing Co. Ltd. - Segment focus
            • 12.9 Nucurrent Inc.
              • Nucurrent Inc. - Overview
              • Nucurrent Inc. - Product / Service
              • Nucurrent Inc. - Key offerings
            • 12.10 NXP Semiconductors NV
              • NXP Semiconductors NV - Overview
              • NXP Semiconductors NV - Product / Service
              • NXP Semiconductors NV - Key news
              • NXP Semiconductors NV - Key offerings
            • 12.11 PLUGLESS POWER INC.
              • PLUGLESS POWER INC. - Overview
              • PLUGLESS POWER INC. - Product / Service
              • PLUGLESS POWER INC. - Key offerings
            • 12.12 Powermat Technologies Ltd.
              • Powermat Technologies Ltd. - Overview
              • Powermat Technologies Ltd. - Product / Service
              • Powermat Technologies Ltd. - Key news
              • Powermat Technologies Ltd. - Key offerings
            • 12.13 Renesas Electronics Corp.
              • Renesas Electronics Corp. - Overview
              • Renesas Electronics Corp. - Business segments
              • Renesas Electronics Corp. - Key news
              • Renesas Electronics Corp. - Key offerings
              • Renesas Electronics Corp. - Segment focus
            • 12.14 Samsung Electronics Co. Ltd.
              • Samsung Electronics Co. Ltd. - Overview
              • Samsung Electronics Co. Ltd. - Business segments
              • Samsung Electronics Co. Ltd. - Key news
              • Samsung Electronics Co. Ltd. - Key offerings
              • Samsung Electronics Co. Ltd. - Segment focus
            • 12.15 Semtech Corp.
              • Semtech Corp. - Overview
              • Semtech Corp. - Business segments
              • Semtech Corp. - Key news
              • Semtech Corp. - Key offerings
              • Semtech Corp. - Segment focus
            • 12.16 TDK Corp.
              • TDK Corp. - Overview
              • TDK Corp. - Business segments
              • TDK Corp. - Key news
              • TDK Corp. - Key offerings
              • TDK Corp. - Segment focus
            • 12.17 WiTricity Corp.
              • WiTricity Corp. - Overview
              • WiTricity Corp. - Product / Service
              • WiTricity Corp. - Key offerings

            13 Appendix

            • 13.1 Scope of the report
              • 13.2 Inclusions and exclusions checklist
                • Inclusions checklist
                • Exclusions checklist
              • 13.3 Currency conversion rates for US$
                • Currency conversion rates for US$
              • 13.4 Research methodology
                • Research methodology
              • 13.5 Data procurement
                • Information sources
              • 13.6 Data validation
                • Data validation
              • 13.7 Validation techniques employed for market sizing
                • Validation techniques employed for market sizing
              • 13.8 Data synthesis
                • Data synthesis
              • 13.9 360 degree market analysis
                • 360 degree market analysis
              • 13.10 List of abbreviations
                • List of abbreviations

              Research Methodology

              Technavio presents a detailed picture of the market by way of study, synthesis, and summation of data from multiple sources. The analysts have presented the various facets of the market with a particular focus on identifying the key industry influencers. The data thus presented is comprehensive, reliable, and the result of extensive research, both primary and secondary.

              INFORMATION SOURCES

              Primary sources

              • Manufacturers and suppliers
              • Channel partners
              • Industry experts
              • Strategic decision makers

              Secondary sources

              • Industry journals and periodicals
              • Government data
              • Financial reports of key industry players
              • Historical data
              • Press releases

              DATA ANALYSIS

              Data Synthesis

              • Collation of data
              • Estimation of key figures
              • Analysis of derived insights

              Data Validation

              • Triangulation with data models
              • Reference against proprietary databases
              • Corroboration with industry experts

              REPORT WRITING

              Qualitative

              • Market drivers
              • Market challenges
              • Market trends
              • Five forces analysis

              Quantitative

              • Market size and forecast
              • Market segmentation
              • Geographical insights
              • Competitive landscape

              Interested in this report?

              Get your sample now to see our research methodology and insights!

              Download Now

              Frequently Asked Questions

              Wireless Power Transmission market growth will increase by $ 29612.2 mn during 2024-2028.

              The Wireless Power Transmission market is expected to grow at a CAGR of 30.96% during 2024-2028.

              Wireless Power Transmission market is segmented by End-user( Consumer electronics, Industrial applications, Automotive, Others) Technology( Near field technology, Far field technology, North America, South America, MEA)

              Analog Devices Inc., ConvenientPower Semiconductor, Energous Corp., Energysquare SAS, Humavox Ltd., Koninklijke Philips N.V., Leggett and Platt Inc., Murata Manufacturing Co. Ltd., Nucurrent Inc., NXP Semiconductors NV, Ossia Inc., PLUGLESS POWER INC., Powermat Technologies Ltd., Renesas Electronics Corp., Salcomp PLC, Samsung Electronics Co. Ltd., Semtech Corp., TDK Corp., Wi Charge, WiTricity Corp. are a few of the key vendors in the Wireless Power Transmission market.

              APAC will register the highest growth rate of 46% among the other regions. Therefore, the Wireless Power Transmission market in APAC is expected to garner significant business opportunities for the vendors during the forecast period.

              US, China, Germany, Japan, UK

              • Rapid growth in wireless transmissionIn the last few years is the driving factor this market.
              • the demand for high-voltage (HV) transmission in the utility sector has been rising rapidly. Wireless transmission is a reliable means to carry electricity without any kind of wires or physical contact. As of now is the driving factor this market.
              • utility-scale wireless power transmission is at a nascent stage is the driving factor this market.
              • but the growing prominence of cost-effective transmission will positively impact the growth of the global wireless power transmission market. For conventional power transmission is the driving factor this market.
              • the high equipment cost leads to high infrastructure costs. It also requires various additional devices is the driving factor this market.
              • such as electrical and mechanical auxiliaries is the driving factor this market.
              • pole control is the driving factor this market.
              • and valve control.Utilities consist of companies that provide basic amenities is the driving factor this market.
              • such as water is the driving factor this market.
              • electricity is the driving factor this market.
              • and natural gas. Power is recognized as one of the most substantial components of infrastructure is the driving factor this market.
              • which is critical for the growth and development of any economy. The growth of the power sector in emerging economies is the driving factor this market.
              • such as India and China is the driving factor this market.
              • is witnessing a major change is the driving factor this market.
              • owing to the growing construction of manufacturing units is the driving factor this market.
              • retail brands is the driving factor this market.
              • residential townships is the driving factor this market.
              • and commercial establishments. Factors such as the low cost of labor and the availability of low-cost raw materials have attracted major foreign companies to establish their production base in developing countries is the driving factor this market.
              • such as India and China. This has increased the demand for power is the driving factor this market.
              • thereby increasing the demand for transmission lines. For instance is the driving factor this market.
              • according to the Indian Government is the driving factor this market.
              • the total power generation across the country has shown a steady growth of over 5.5% in the last five years. This is estimated to drive the growth of the market in focus during the forecast period. is the driving factor this market.

              The Wireless Power Transmission market vendors should focus on grabbing business opportunities from the Consumer electronics segment as it accounted for the largest market share in the base year.
              RIA - Research AI Assistant
              Ask RIA