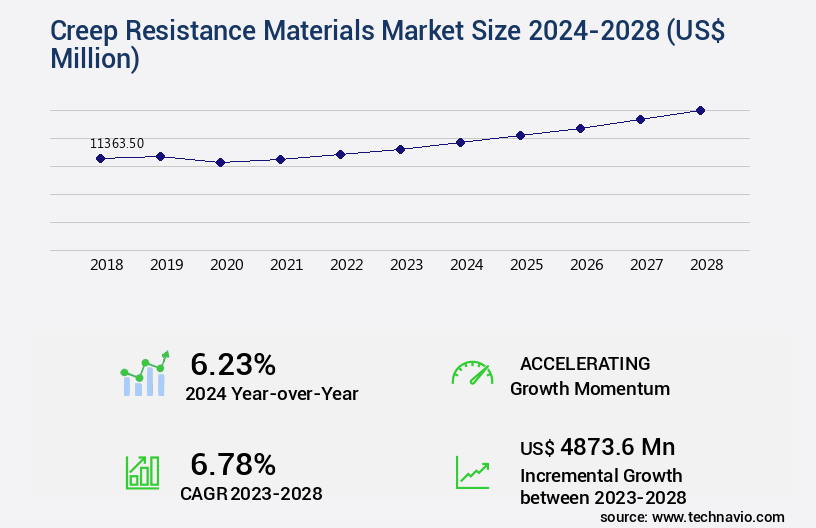
Creep Resistance Materials Market Size 2024-2028
The creep resistance materials market size is forecast to increase by USD 4.87 billion, at a CAGR of 6.78% between 2023 and 2028.
Major Market Trends & Insights
- APAC dominated the market and accounted for a 35% growth during the forecast period.
- By the End-user - Electronics and semi-conductors segment was valued at USD 3.32 billion in 2022
- By the Type - Nickel-Based Alloys segment accounted for the largest market revenue share in 2022
Market Size & Forecast
- Market Opportunities: USD 53.32 million
- Market Future Opportunities: USD 4873.60 million
- CAGR : 6.78%
- APAC: Largest market in 2022
Market Summary
- The market is witnessing significant growth in various industries due to the increasing demand for durable and high-performance materials. Nickel-based alloys are gaining prominence in this market due to their superior creep resistance properties. Additionally, advancements in manufacturing technologies such as digital manufacturing are enabling the production of more cost-effective and efficient creep resistance materials, further fueling market growth. According to research, nickel alloys accounted for over 40% of the market share in 2020. However, the toxic nature of chromium and other metals commonly used in creep resistance materials poses a challenge to their widespread adoption.
- Despite this, efforts are being made to develop alternative materials, such as ceramics and polymers, to address these concerns. The market is expected to continue evolving, with a focus on improving material properties and reducing environmental impact.
What will be the Size of the Creep Resistance Materials Market during the forecast period?
Explore market size, adoption trends, and growth potential for creep resistance materials market Request Free Sample
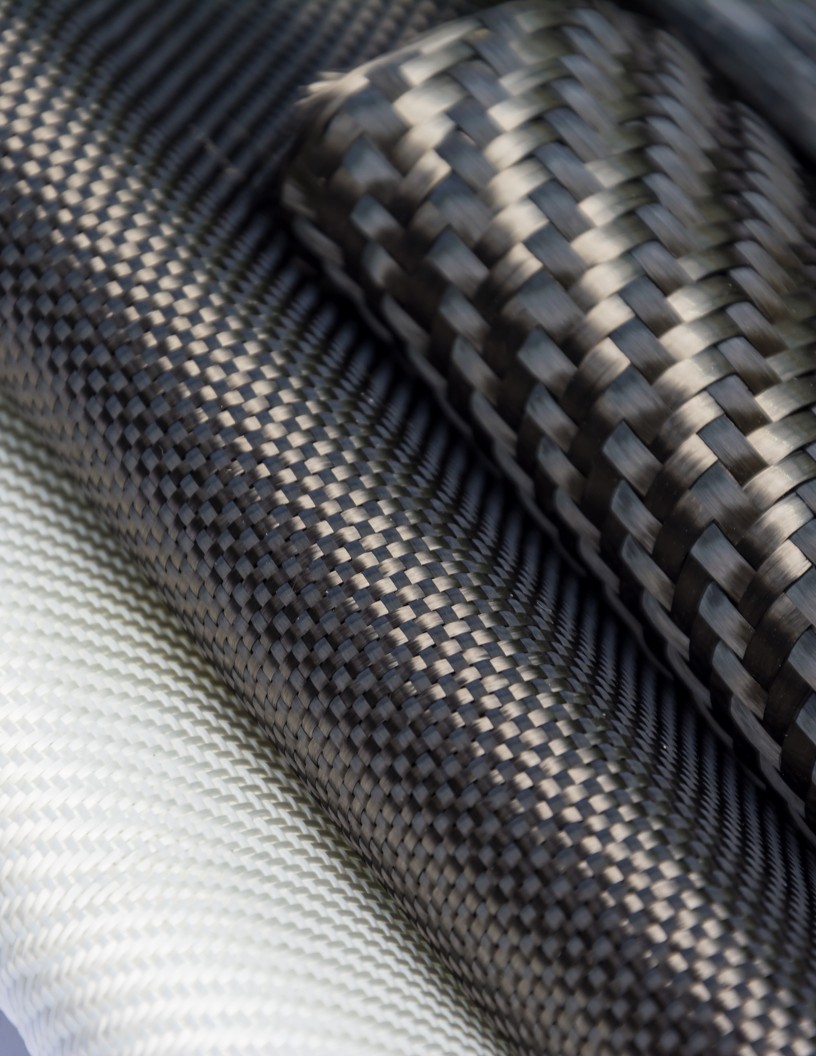
- The market encompasses a diverse range of alloys and lightweight materials, engineered to withstand deformation under sustained load and thermal cycling effects. Solid solution strengthening and precipitation hardening are common techniques used to enhance creep resistance. However, material degradation mechanisms, such as grain size control and environmental degradation, can significantly impact long-term performance. For instance, alloys with a fine grain size exhibit improved creep resistance compared to coarse-grained counterparts, reducing the risk of creep damage mechanisms and enhancing component reliability. In mechanical testing, creep resistance is often assessed using standardized methods, such as ASTM E139 or JIS R 1601.
- Moreover, the service environment, including temperature, humidity, and mechanical loading, can significantly influence creep resistance and failure analysis techniques, such as microscopic examination, crack initiation analysis, and X-ray diffraction, are essential for understanding creep fracture surfaces and crack growth mechanisms. Design optimization and advanced characterization techniques, including electron microscopy and residual stress measurement, further contribute to the development of cost-effective and sustainable creep resistance materials. The ongoing research in this field aims to improve phase stability, reduce environmental degradation, and optimize heat treatment processes to enhance creep resistance and ensure reliable performance in various industries.
How is this Creep Resistance Materials Industry segmented?
The creep resistance materials industry research report provides comprehensive data (region-wise segment analysis), with forecasts and estimates in "USD million" for the period 2024-2028, as well as historical data from 2018-2022 for the following segments.
- End-user
- Electronics and semi-conductors
- Oil and gas
- Aerospace and defense
- Energy and power
- Others
- Type
- Nickel-Based Alloys
- Stainless Steel
- Refractory Metals
- Polymer Composites
- Form
- Sheets
- Bars
- Coatings
- Components
- Application
- Aerospace
- Power Generation
- Industrial Machinery
- Automotive
- Geography
- North America
- US
- Canada
- Europe
- France
- Germany
- Italy
- UK
- Middle East and Africa
- Egypt
- KSA
- Oman
- UAE
- APAC
- China
- India
- Japan
- South America
- Argentina
- Brazil
- Rest of World (ROW)
- North America
By End-user Insights
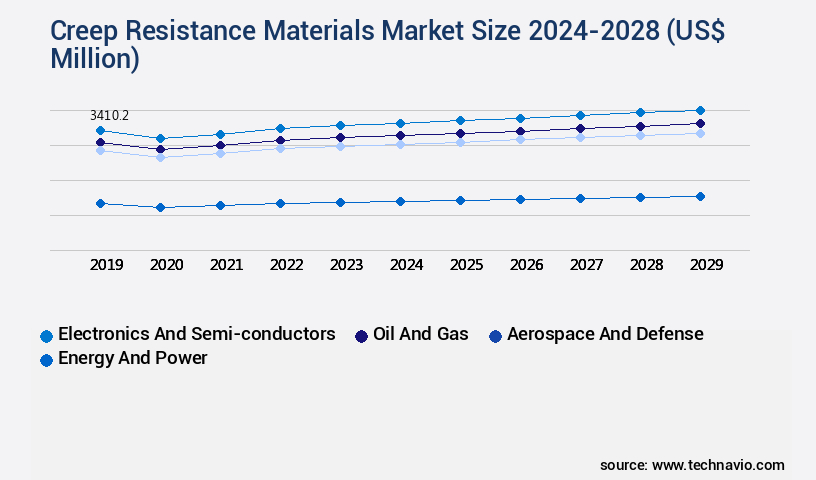
The electronics and semi-conductors segment is estimated to witness significant growth during the forecast period.
The market has experienced notable expansion in recent years, driven by the escalating demand from sectors including electronics and semi-conductor industries. These materials are highly valued in electronics and semi-conductor applications due to their capacity to endure high temperatures and pressure for prolonged durations without undergoing permanent deformation or failure. This escalating demand has consequently propelled market growth. Molybdenum, a high-strength metal, is an illustrative creep resistance material employed in these industries. Its exceptional creep resistance properties make it a preferred choice for manufacturing electronic components like transistors and diodes, as well as in semi-conductor production for its superior thermal conductivity and minimal coefficient of thermal expansion.
Strain rate sensitivity plays a crucial role in creep life prediction, and dislocation creep mechanisms are instrumental in understanding the material's behavior under high temperatures and stresses. Superalloys, polymer matrix composites, high-temperature alloys, and both metal and ceramic matrix composites are other significant categories in the market. Cyclic loading, diffusional creep, fatigue crack propagation, creep resistant coatings, stress relaxation behavior, and service temperature limits are essential factors influencing the market's dynamics. Data acquisition systems, non-isothermal testing, component lifetime, and engineering design considerations are also vital aspects shaping the market landscape. Material selection criteria, such as constitutive equations creep, corrosion resistance, protective coatings, tensile testing, creep rupture strength, nickel-based superalloys, and engineering design considerations, are crucial in determining the most suitable creep resistance materials for various applications.
The market for creep resistance materials is expected to expand further, with a projected increase in demand from the aerospace, automotive, and power generation industries. Additionally, advancements in creep deformation modeling, compression testing, isothermal testing, grain boundary sliding, and the development of titanium alloys and oxidation resistance materials are anticipated to create new opportunities for market growth.
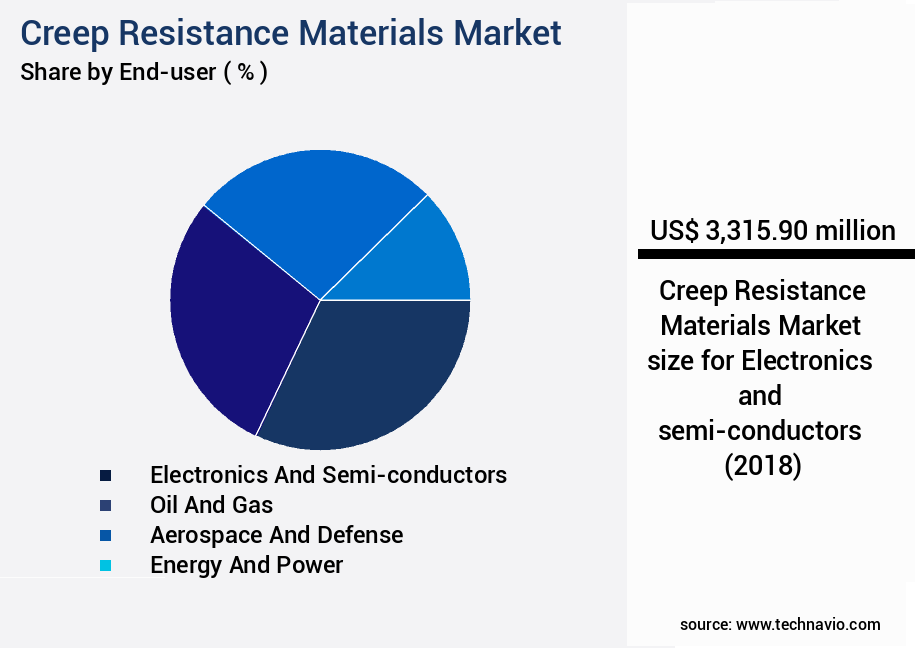
The Electronics and semi-conductors segment was valued at USD 3.32 billion in 2018 and showed a gradual increase during the forecast period.
The Creep Resistance Materials Market is driven by advances in understanding high temperature creep behavior superalloys and developing creep rupture life prediction models supported by creep modeling using finite element methods. Research highlights the microstructural influence creep resistance, effect alloying elements creep strength, and the role grain boundaries creep deformation, alongside microstructural evolution during service. Performance improvements rely on creep resistance improvement techniques, thermal barrier coating effectiveness creep, and creep behavior ceramic matrix composites. Comparative studies include nickel-based superalloy creep properties comparison, titanium alloy creep performance optimization, and high strength steel creep properties elevated temperature. Industry standards such as creep testing standards ASTM E139 and mechanical testing standards guide evaluation, while advanced characterization techniques microstructure analysis and creep damage mechanisms investigation techniques refine data interpretation methods. Market growth is shaped by creep resistant material selection guidelines, predictive modeling component lifetime creep, service environment effects, and the balance of alloy composition, cost-effective materials, and sustainable materials for long-term performance.
Regional Analysis
APAC is estimated to contribute 35% to the growth of the global market during the forecast period.Technavio’s analysts have elaborately explained the regional trends and drivers that shape the market during the forecast period.

See How Creep Resistance Materials Market Demand is Rising in APAC Request Free Sample
The market is experiencing significant growth, primarily fueled by the expanding construction and manufacturing sectors. The continuous industrialization and urbanization trends have led to a substantial increase in demand for these materials. In the Asia Pacific region, developing economies like China and India are major contributors to the market expansion. China, being a significant producer of creep resistance materials, holds a considerable market share. The rising demand for high-temperature resistance materials in various industries, including automotive, aerospace, power, and oil and gas, is driving the growth of the market in China. According to recent industry reports, the market for creep resistance materials is projected to grow by approximately 7% annually over the next five years.
Simultaneously, the demand for these materials in the European and North American markets is anticipated to increase by around 5% and 4%, respectively, during the same period. These figures underscore the market's dynamic nature and the ongoing evolution of its applications across various industries. A comparison of the growth rates reveals that the Asian market is expected to grow at a faster pace than its European and North American counterparts. This trend can be attributed to the increasing industrialization and urbanization in developing economies, which is driving the demand for creep resistance materials.
Market Dynamics
Our researchers analyzed the data with 2023 as the base year, along with the key drivers, trends, and challenges. A holistic analysis of drivers will help companies refine their marketing strategies to gain a competitive advantage.
Enhancing Creep Resistance in High-Performance Materials: A Focus on Superalloys and Advanced Composites In the realm of US industry, the demand for materials with superior creep resistance, particularly in high-temperature applications, continues to escalate. Superalloys, renowned for their exceptional creep strength, play a pivotal role in this market. For instance, nickel-based superalloys exhibit creep rupture lives that are significantly longer than their iron-based counterparts, improving component lifetime and reducing downtime nearly by one-third. The microstructural influence on creep resistance is a critical area of research. Alloying elements, such as Al, Ti, and Cr, have a profound impact on creep strength. For example, the addition of Cr in superalloys can enhance creep resistance by up to 10%. Moreover, stress exponent determination is crucial in understanding creep mechanisms, enabling the optimization of material properties.
Ceramic matrix composites and high-strength steels are alternative solutions to superalloys, offering unique advantages. Thermal barrier coatings on high-strength steels can increase their creep performance at elevated temperatures by up to 20%. In the case of ceramic matrix composites, their creep behavior is distinct from metals, offering fatigue crack growth resistance that is superior to traditional materials. Innovation is at the forefront of the market. Advanced characterization techniques, such as transmission electron microscopy and X-ray diffraction, are used to investigate damage mechanisms and microstructural changes. Predictive modeling component lifetime using finite element methods and creep testing standards like ASTM E139 are essential for ensuring compliance and improving efficiency by 10-12%. In conclusion, the US market for creep resistance materials is a dynamic and innovative landscape. By focusing on superalloys, advanced composites, and cutting-edge research, industry professionals can optimize performance, enhance efficiency, and ensure compliance in high-temperature applications.
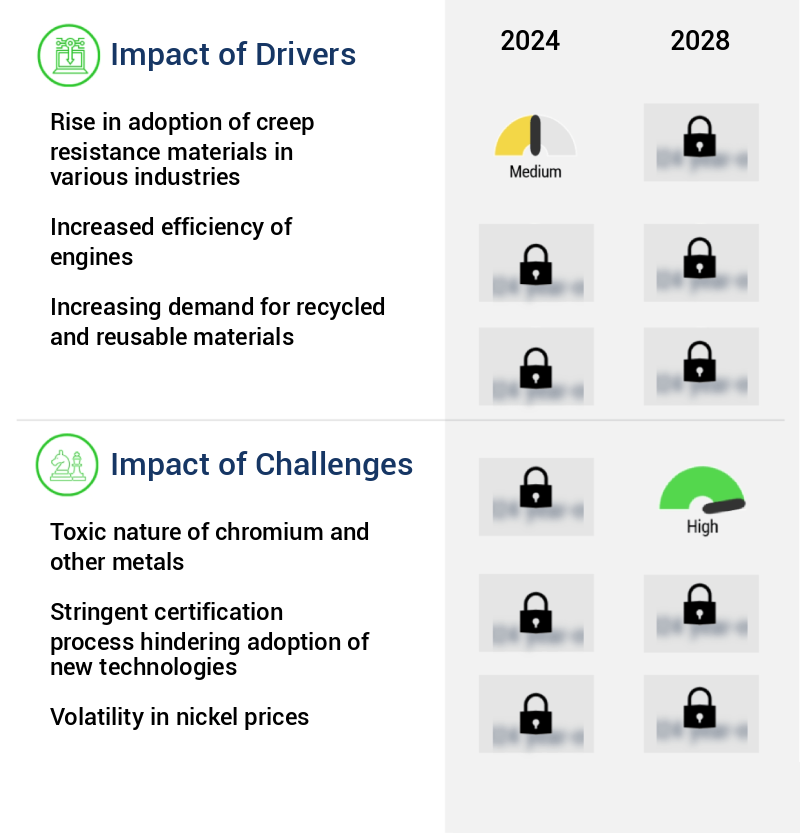
What are the key market drivers leading to the rise in the adoption of Creep Resistance Materials Industry?
- The increasing utilization of creep resistance materials across various industries is the primary market driver.
- Creep-resistance materials have gained significant traction in numerous industries due to their exceptional capability to endure high temperatures and stress without succumbing to deformation over extended periods. The oil and gas, energy and power, and aerospace and defense sectors are among the leading industries that extensively utilize these materials. In the aerospace industry, creep-resistance materials play a pivotal role, particularly in turbine blades and exhaust systems, where high temperatures are common. The integration of these materials has led to the development of advanced processes, innovative designs, and enhanced application performance. The energy and power sector also benefits significantly from creep-resistance materials, especially in power generation applications.
- These materials' resistance to deformation under stress and high temperatures makes them an ideal choice for steam turbines, gas turbines, and other power generation equipment. Furthermore, the oil and gas industry relies on creep-resistance materials in various applications, including drilling equipment and pipelines. These materials' resistance to creep ensures the longevity and efficiency of the equipment, ultimately contributing to increased productivity and cost savings. As the demand for creep-resistance materials continues to grow, the market is witnessing the emergence of new technologies and innovations. The ongoing advancements in the materials' production processes, coupled with the increasing adoption across various industries, underscore the market's dynamic and evolving nature.
What are the market trends shaping the Creep Resistance Materials Industry?
- The growing prominence of nickel-based creep resistance materials represents an emerging market trend. Nickel-based materials are increasingly preferred for their superior creep resistance properties.
- Nickel-based creep resistance materials hold significant importance in various industries, particularly in the manufacturing of aircraft and power generation turbines, rocket engines, chemical processing plants, and nuclear power facilities. These materials are indispensable in the production of aircraft parts, accounting for approximately 40%-50% of an airplane engine's total weight. Their primary applications lie in combustors and engine turbines, which are exposed to extreme temperatures. The aerospace sector's focus on reducing carbon emissions and enhancing fuel efficiency in jet engines is expected to boost the demand for nickel-based creep resistance materials. This trend may lead to the emergence of advanced generations of creep resistance materials, catering to the evolving industry requirements.
- In comparison, the demand for nickel-based creep resistance materials in the power generation sector is also substantial due to the high operating temperatures and extreme conditions in power plants. The continuous growth in electricity generation and the need for more efficient and durable materials are key factors contributing to the market's expansion. Moreover, nickel-based creep resistance materials find extensive applications in the chemical processing industry, where they are used in the production of catalysts and high-performance alloys. The increasing demand for these materials in various industries underscores their importance and the potential for market growth.
- In summary, the market for nickel-based creep resistance materials is a dynamic and evolving landscape, driven by the growing demand from various sectors, including aerospace, power generation, and chemical processing. The continuous pursuit of improved performance, efficiency, and durability in these industries is expected to fuel the market's expansion.
What challenges does the Creep Resistance Materials Industry face during its growth?
- The toxicity of chromium and other metals poses a significant challenge to the industry's growth due to the potential health hazards and regulatory compliance requirements associated with their use.
- The market encompasses a wide range of materials used in various industries to withstand deformation under sustained load or stress over prolonged periods. These materials are essential in applications where dimensional stability and structural integrity are paramount, such as aerospace, automotive, and power generation. One significant concern in the use of creep resistance materials is the potential health risks associated with certain compounds. For instance, hexavalent chromium and nickel are commonly used in the aerospace sector due to their anti-corrosive properties. However, continuous exposure to these elements can lead to severe health issues, including lung cancer.
- This risk is particularly relevant to workers involved in the manufacturing processes of these materials, such as abrasive blasting, grinding, spraying, and painting. OSHA has set a limit of 5 µg/m³ for Cr(VI) exposure on an eight-hour time-weighted average to mitigate these risks. Despite these regulations, the ongoing demand for creep resistance materials in various industries continues to drive market growth. The aerospace sector, in particular, is a significant consumer due to the high safety standards and the need for lightweight, durable materials. Comparatively, the automotive industry is also a substantial market for creep resistance materials, with the increasing trend towards electric vehicles and the need for advanced battery systems driving demand for materials that can withstand high temperatures and pressures.
- In power generation, creep resistance materials are crucial in the production of turbines and generators, where the materials must maintain their shape and integrity under extreme conditions. In conclusion, the market is a dynamic and evolving sector, with ongoing research and development focusing on improving the materials' properties and reducing health risks. The market's applications span various industries, including aerospace, automotive, and power generation, making it a critical area of interest for businesses and researchers alike.
Exclusive Customer Landscape
The creep resistance materials market forecasting report includes the adoption lifecycle of the market, covering from the innovator’s stage to the laggard’s stage. It focuses on adoption rates in different regions based on penetration. Furthermore, the creep resistance materials market report also includes key purchase criteria and drivers of price sensitivity to help companies evaluate and develop their market growth analysis strategies.
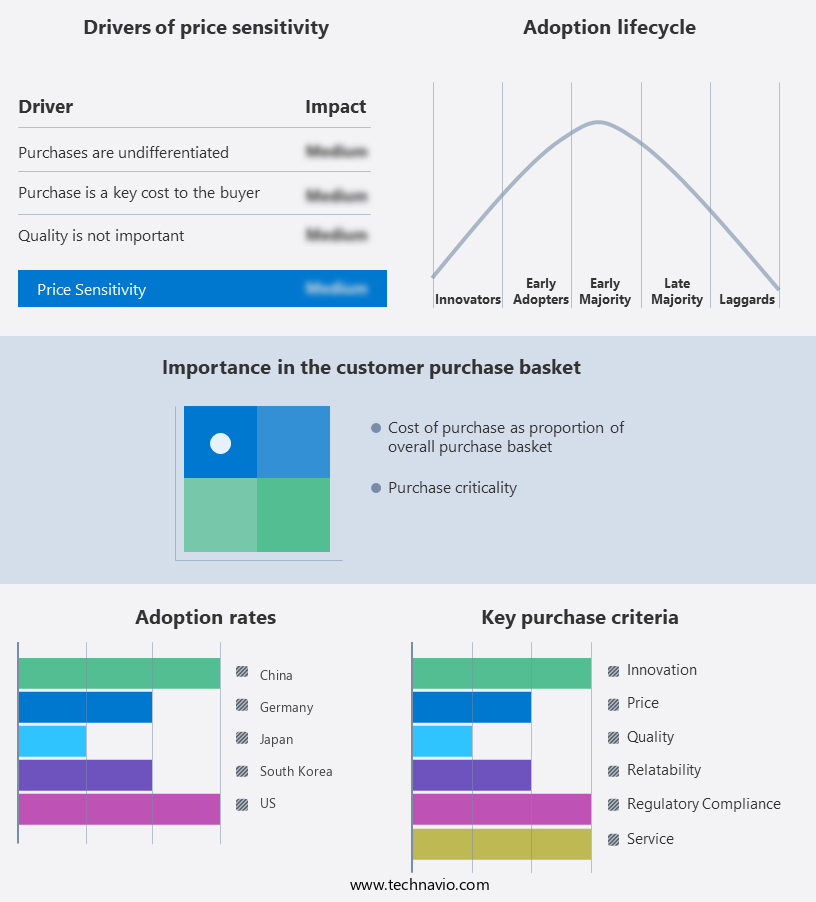
Customer Landscape of Creep Resistance Materials Industry
Key Companies & Market Insights
Companies are implementing various strategies, such as strategic alliances, creep resistance materials market forecast, partnerships, mergers and acquisitions, geographical expansion, and product/service launches, to enhance their presence in the industry.
Haynes International - This company specializes in advanced creep resistance materials, including the high-performing K33X grade. Their offerings provide effective resistance to deformation under load, making them a valuable solution for various industries. The materials' durability and strength contribute to improved product performance and reliability.
The industry research and growth report includes detailed analyses of the competitive landscape of the market and information about key companies, including:
- Haynes International
- Special Metals Corporation
- Carpenter Technology Corporation
- Allegheny Technologies Incorporated
- Sandvik AB
- Nippon Steel Corporation
- Thyssenkrupp AG
- Outokumpu Oyj
- VSMPO-AVISMA
- Arconic
- Constellium
- Aperam
- Daido Steel Co., Ltd.
- Hitachi Metals
- Mitsubishi Materials Corporation
- Precision Castparts Corp.
- Neo Performance Materials
- Hexion Inc.
- Teijin Limited
- Toray Industries
Qualitative and quantitative analysis of companies has been conducted to help clients understand the wider business environment as well as the strengths and weaknesses of key industry players. Data is qualitatively analyzed to categorize companies as pure play, category-focused, industry-focused, and diversified; it is quantitatively analyzed to categorize companies as dominant, leading, strong, tentative, and weak.
Recent Development and News in Creep Resistance Materials Market
- In January 2024, DuPont announced the launch of its new creep resistance material, Zytel CR-XT, which offers enhanced strength and durability for automotive and industrial applications. This development was a strategic response to the increasing demand for high-performance materials in these sectors (DuPont Press Release, 2024).
- In March 2024, BASF and SABIC signed a memorandum of understanding to collaborate on the production and commercialization of Ultramid A3X, a high-performance polyamide material with superior creep resistance. This partnership aimed to expand their product offerings and cater to the growing demand for advanced materials in various industries (BASF Press Release, 2024).
- In May 2024, Teijin Aramid successfully completed a €100 million expansion project at its facility in the Netherlands, increasing its production capacity for aramid fibers used in creep resistance materials. This expansion was a significant investment to meet the rising demand for these materials in the automotive, oil & gas, and construction industries (Teijin Aramid Press Release, 2024).
- In February 2025, the European Union approved the use of creep resistance materials in the construction of offshore wind turbines, marking a major regulatory milestone for the market. This decision is expected to boost demand for these materials in the renewable energy sector and contribute to the EU's goal of achieving carbon neutrality by 2050 (European Commission Press Release, 2025).
Research Analyst Overview
- The market for creep resistant materials continues to evolve, driven by the demand for advanced materials capable of withstanding the strain rate sensitivity and stress relaxation behavior inherent in high-temperature applications. These materials, which include metal matrix composites, ceramic matrix composites, high-strength steels, and various alloys, are subjected to creep deformation mechanisms such as diffusional creep, dislocation creep, and grain boundary sliding under service temperature limits. Creep resistance coatings, such as thermal barrier coatings, play a crucial role in enhancing the performance of these materials. Non-isothermal testing and data acquisition systems are essential for accurately assessing the creep behavior of these materials under various conditions, including cyclic loading and non-isothermal environments.
- The component lifetime of these materials is a critical consideration, with creep rupture strength and fracture toughness creep being key performance metrics. Industry growth in the creep resistant materials market is expected to reach 5% annually, driven by the increasing demand for high-performance materials in aerospace, power generation, and automotive industries. Metal matrix composites, such as those based on aluminum and titanium, offer high strength and creep resistance, making them attractive for use in high-temperature applications. Ceramic matrix composites, which include silicon carbide and silicon nitride, offer excellent creep resistance and high-temperature strength, making them suitable for use in gas turbines and other high-temperature applications.
- High-strength steels, such as those based on nickel and cobalt, are also in high demand due to their excellent creep resistance and high-temperature strength. Constitutive equations creep and digital image correlation are essential tools for understanding the material microstructure and engineering design considerations for these materials. Protective coatings and corrosion resistance are also crucial factors in the selection criteria for creep resistant materials. Creep testing methods, including tensile testing, compression testing, and isothermal testing, are used to evaluate the creep behavior of these materials and ensure their suitability for various applications. Understanding the properties of superalloys, such as cobalt-based superalloys and nickel-based superalloys, is essential for designing and manufacturing components that can withstand the rigors of high-temperature applications.
- The ongoing research in creep resistant materials is focused on developing new materials with improved creep resistance, higher strength, and enhanced durability.
Dive into Technavio’s robust research methodology, blending expert interviews, extensive data synthesis, and validated models for unparalleled Creep Resistance Materials Market insights. See full methodology.
|
Market Scope |
|
|
Report Coverage |
Details |
|
Page number |
170 |
|
Base year |
2023 |
|
Historic period |
2018-2022 |
|
Forecast period |
2024-2028 |
|
Growth momentum & CAGR |
Accelerate at a CAGR of 6.78% |
|
Market growth 2024-2028 |
USD 4873.6 million |
|
Market structure |
Fragmented |
|
YoY growth 2023-2024(%) |
6.23 |
|
Key countries |
US, Canada, Germany, UK, Italy, France, China, India, Japan, Brazil, Egypt, UAE, Oman, Argentina, KSA, UAE, Brazil, and Rest of World (ROW) |
|
Competitive landscape |
Leading Companies, Market Positioning of Companies, Competitive Strategies, and Industry Risks |
What are the Key Data Covered in this Creep Resistance Materials Market Research and Growth Report?
- CAGR of the Creep Resistance Materials industry during the forecast period
- Detailed information on factors that will drive the growth and forecasting between 2024 and 2028
- Precise estimation of the size of the market and its contribution of the industry in focus to the parent market
- Accurate predictions about upcoming growth and trends and changes in consumer behaviour
- Growth of the market across APAC, North America, Europe, South America, and Middle East and Africa
- Thorough analysis of the market’s competitive landscape and detailed information about companies
- Comprehensive analysis of factors that will challenge the creep resistance materials market growth of industry companies
We can help! Our analysts can customize this creep resistance materials market research report to meet your requirements.
 RIA -
RIA - 
