Thermal Barrier Coatings (TBC) Market Analysis North America, APAC, Europe, Middle East and Africa, South America - US, China, India, Germany, UK - Size and Forecast 2024-2028

Thermal Barrier Coatings (TBC) Market Analysis North America, APAC, Europe, Middle East and Africa, South America - US, China, India, Germany, UK - Size and Forecast 2024-2028

Published: Nov 2023 158 Pages SKU: IRTNTR76726

Market Overview at a Glance

$4.83 B
Market Opportunity
5.36%
CAGR
5.22
YoY growth 2023-2024(%)

Thermal Barrier Coatings Market Size 2024-2028 

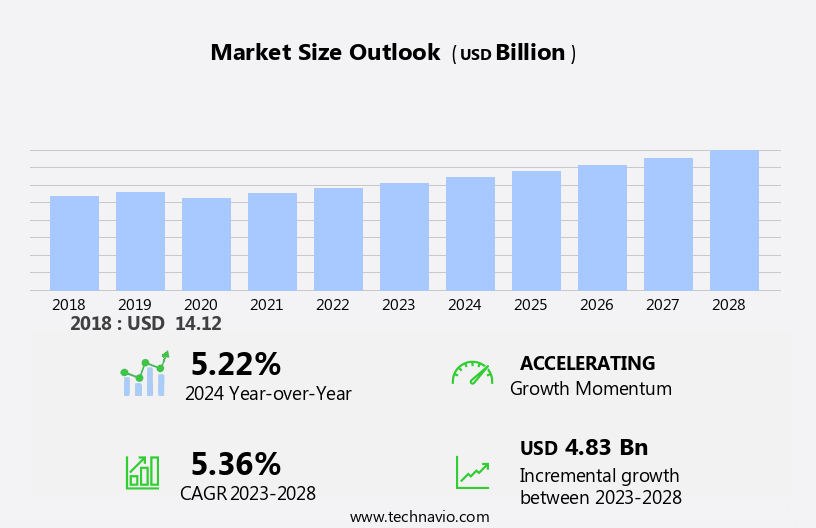
The thermal barrier coatings market size is forecast to increase by USD 4.83 billion at a CAGR of 5.36% between 2023 and 2028. The market is witnessing significant growth due to the increasing demand for fuel-efficient gas turbine engines in various industries, including aviation and power production. These coatings, which incorporate metal particles, are essential for protecting gas turbine blades from high temperatures and thermal shock. In the aviation sector, the use of advanced thermal barrier coating materials is increasing in aviation engines to enhance their durability and improve engine performance. Similarly, in the power production and marine propulsion sectors, thermal barrier coatings are being extensively used to increase the efficiency and longevity of gas turbines. However, the high production and application costs of these coatings remain a challenge for market growth. In summary, the market is experiencing steady expansion due to the increasing demand for fuel-efficient engines and the use of advanced materials, despite the high costs associated with their production and application.

What will be the Size of the Market During the Forecast Period?

Thermal Barrier Coatings Market Size

 Request Free Sample

Thermal barrier coatings (TBCs) have emerged as a crucial technology in various industries, particularly those that require high-performance components capable of withstanding extreme temperatures. These coatings offer significant benefits in terms of thermal insulation, corrosion protection, and surface durability. In the aerospace sector, TBCs play a pivotal role in enhancing the efficiency and longevity of engines used in aviation. The application of these coatings on gas turbine blades helps prevent thermal degradation, thereby reducing the need for frequent maintenance and increasing the overall operational efficiency of the engines.

Similarly, in the automobile production industry, TBCs are used to improve the performance and fuel efficiency of engines by reducing heat transfer and insulating critical engine components. Coating technologies employed in the production of TBCs include HVOF spraying, flame spraying technique, and plasma transfer arc. Epoxy resins, polymers, aluminates, zirconia, and ceramics are among the commonly used materials in the formulation of these coatings. The choice of material depends on the specific application requirements and the operating conditions. The energy sector is another major consumer of TBCs, particularly in the context of gas turbines. These coatings help improve the efficiency and longevity of gas turbines by reducing thermal stress and preventing corrosion.

The use of TBCs in this sector has become increasingly important due to the growing demand for cleaner and more efficient energy sources. The demand for TBCs is driven by several factors, including the increasing focus on energy efficiency and the need for high-performance components in various industries. The growing use of advanced technologies such as HVOF spraying and plasma transfer arc in the production of TBCs is also expected to drive market growth. The application of TBCs in engines, OEMs, and the energy sector is a significant trend in the market. The use of these coatings in aviation engines is expected to continue to grow due to the increasing demand for fuel-efficient and environmentally friendly aircraft.

Similarly, the use of TBCs in gas turbines is expected to increase due to the growing demand for cleaner and more efficient energy sources. Despite the numerous benefits of TBCs, there are challenges associated with their production and application. These include the high cost of raw materials and the complex production process. Additionally, the use of metal particles in the formulation of some TBCs can lead to issues with surface degradation processes. In conclusion, thermal barrier coatings have become an essential technology in various industries, particularly those that require high-performance components capable of withstanding extreme temperatures. The use of advanced coating technologies and materials is expected to drive market growth, while challenges related to production and application remain key areas of focus for industry stakeholders.

Market Segmentation

The market research report provides comprehensive data (region-wise segment analysis), with forecasts and estimates in "USD billion" for the period 2024-2028, as well as historical data from 2018-2022 for the following segments.

  • Type
    • Ceramic
    • Metal
    • Intermetallic
  • End-user
    • Aerospace
    • Automotive
    • Power plants
    • Others
  • Geography
    • North America
      • US
    • APAC
      • China
      • India
    • Europe
      • Germany
      • UK
    • Middle East and Africa
    • South America

By Type Insights

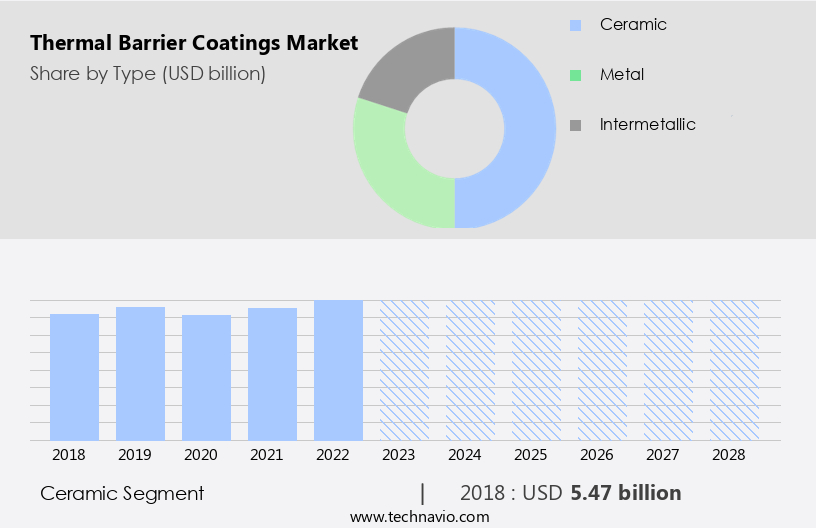
The ceramic segment is estimated to witness significant growth during the forecast period. Thermal barrier coatings, specifically those made of ceramics, have gained significant traction in the global market due to their distinctive properties. The increasing demand for elevated operating temperatures in various industries, such as aerospace and energy, is driving the adoption of ceramic coatings. These coatings offer superior corrosion resistance, durability, and thermal insulation, making them indispensable for gas turbines, turbine engines, and industrial equipment. Two prominent examples of these coatings are yttria-stabilized zirconia and plasma-sprayed alumina. In today's manufacturing landscape, ceramics play a pivotal role in improving fuel efficiency and reducing emissions. The growth of The market is anticipated to be substantial during the forecast period, as regulations and environmental concerns become increasingly stringent.

Thermal Barrier Coatings Market Size

Get a glance at the market share of various segments Request Free Sample

The Ceramic segment accounted for USD 5.47 billion in 2018 and showed a gradual increase during the forecast period.

Regional Insights

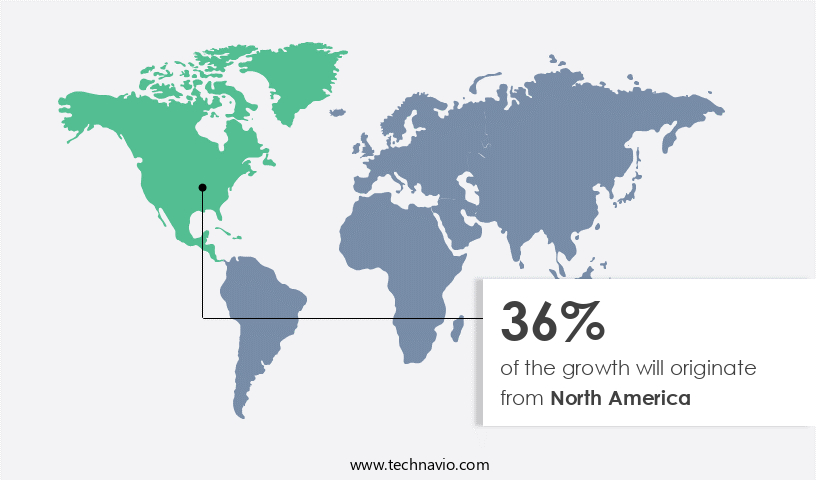
North America is estimated to contribute 36% to the growth of the global market during the forecast period. Technavio's analysts have elaborately explained the regional trends and drivers that shape the market during the forecast period.

Thermal Barrier Coatings Market Share by Geography

For more insights on the market share of various regions Request Free Sample

In North America, the market for thermal barrier coatings is poised for significant expansion over the forecast period. This growth is attributed to the increasing demand from various industries, including automotive, power generation, and aerospace sectors. In the aerospace industry, companies like General Electric and Pratt & Whitney have invested in advanced thermal barrier coatings, highlighting their importance in enhancing engine durability and efficiency. Similarly, thermal barrier coatings play a crucial role in enhancing the lifespan and efficiency of gas turbines, which are integral to the energy generation process in the power sector. Notable thermal barrier coatings producers, such as Chromalloy, are expanding their operations to cater to this growing demand.

Mullite-based thermal barrier coatings are gaining popularity due to their excellent thermal insulation properties and resistance to corrosion and surface degradation processes. Two common techniques for applying these coatings are HVOF (High Velocity Oxygen Fuel) spraying and flame spraying technique. Another advanced method is Plasma Transfer Arc (PTA), which offers superior bonding strength and uniformity. Thermal barrier coatings are vital for industries that rely heavily on thermal processes, as they help minimize heat loss and protect surfaces from high temperatures. By enhancing the efficiency and durability of equipment, these coatings contribute to cost savings and reduced maintenance requirements for businesses.

As industries continue to seek innovative solutions for improving operational efficiency and reducing environmental impact, the demand for thermal barrier coatings is expected to remain strong.

Market Dynamics

Our researchers analyzed the data with 2023 as the base year, along with the key drivers, trends, and challenges. A holistic analysis of drivers will help companies refine their marketing strategies to gain a competitive advantage.

Market Driver

Increasing demand for fuel-efficient aircraft and gas turbine engines is the key driver of the market. The market is experiencing significant growth due to the increasing demand for fuel-efficient engines and reduced emissions in various industries, including aerospace and automobile production. Thermal barrier coatings, such as epoxy resins, polymers, aluminates, zirconia, and yttria-stabilized zirconia, play a crucial role in enhancing the longevity and performance of engine components exposed to high temperatures. For instance, in the aerospace sector, thermal barrier coatings are used in Pratt & Whitney PurePower Geared Turbofan engines and Boeing 787 Dreamliner to improve fuel efficiency and lower emissions. Similarly, in the automobile industry, these coatings are applied to exhaust systems and aero engine technologies to increase thermal conductivity and reduce thermal expansion coefficient, thereby improving engine performance and durability.

Moreover, thermal barrier coatings offer excellent erosion resistance and can withstand high operating temperatures, making them suitable for use in stationary power plants, gas turbines, and energy sector applications. Technologies such as physical vapor deposition, air plasma spray, high velocity oxyfuel, flame barrier technology, and vapor deposition technology are used to apply these coatings. The need to meet emission regulations and increasing electricity demand further boosts the market growth. Thermal barrier coatings are also used in marine propulsion and aviation engines, as well as in power generation projects. The market is expected to continue its growth trajectory due to the continuous development of advanced coating technologies and the increasing demand for efficient and durable engine components.

Market Trends

The growing use of advanced thermal barrier coating materials is the upcoming trend in the market. The market is witnessing significant growth due to the increasing demand for advanced materials in various industries. In particular, the use of yttria-stabilized zirconia and rare earth oxides, such as lanthanum and cerium, is gaining popularity in sectors like aerospace and automotive. These materials offer exceptional thermal and chemical stability, making them ideal for safeguarding turbine components used in power production and aviation. Their high resistance to high temperatures enables these coatings to endure harsh conditions, reducing maintenance costs and increasing energy efficiency. Thermal barrier coatings are essential for aerospace applications, including aero engine technologies and exhaust systems, where high operating temperatures and thermal expansion coefficients are common.

In the automotive sector, thermal barrier coatings are used in automobile production to improve engine performance and reduce fuel consumption. Similarly, in the energy sector, thermal barrier coatings are used in stationary power plants to enhance the efficiency of gas turbines and reduce pollution. Coating technologies such as physical vapor deposition, air plasma spray, high velocity oxyfuel, flame barrier technology, and vapor deposition technology are used to apply these coatings. HVOF technology and flame spraying technique are commonly used due to their ability to apply thick coatings with high bond strength. These coatings provide excellent erosion resistance and protection against surface degradation processes.

Mullite, ceramics, polymers, epoxy resins, aluminates, and zirconia are some of the commonly used materials for thermal barrier coatings. The choice of material depends on the specific application and operating temperature requirements. For instance, zirconia is widely used in high-temperature applications due to its excellent thermal conductivity and thermal expansion coefficient. In conclusion, The market is expected to grow significantly due to the increasing demand for advanced materials in various industries. The use of yttria-stabilized zirconia and rare earth oxides is gaining popularity due to their exceptional thermal and chemical stability. These coatings provide excellent protection against high temperatures and harsh conditions, reducing maintenance costs and increasing energy efficiency.

The use of advanced coating technologies such as HVOF and plasma transfer arc ensures the application of thick coatings with high bond strength. The market for thermal barrier coatings is expected to grow in the energy, aerospace, automotive, and marine propulsion industries.

Market Challenge

High production and application costs of thermal barrier coatings is a key challenge affecting the market growth. Thermal barrier coatings play a crucial role in various industries, including aerospace and automobile production, by enhancing the thermal performance of components exposed to high temperatures. These coatings, which utilize advanced technologies such as epoxy resins, polymers, aluminates, zirconia, and yttriastabilized zirconia, offer benefits like reduced thermal conductivity, lower thermal expansion coefficient, and improved erosion resistance. However, the high cost of production and application is a significant challenge in the market, particularly for industries where cost-effectiveness is a priority. For instance, in the aerospace sector, the application of these coatings on engine components is essential due to the extreme heat conditions.

Similarly, gas turbines in the power generation sector benefit from thermal barrier coatings, but their widespread use may be hindered by the high cost of implementation. Technologies like physical vapor deposition, air plasma spray, high velocity oxyfuel, flame barrier technology, and vapor deposition technology are used to apply these coatings, with each technique offering unique advantages. Applications of thermal barrier coatings extend to exhaust systems, aero engine technologies, stationary power plants, pollution control, electricity demand, marine propulsion, and more. Despite the challenges, the demand for thermal barrier coatings continues to grow due to their ability to enhance the efficiency and durability of components operating in high-temperature environments.

Exclusive Customer Landscape

The market forecasting report includes the adoption lifecycle of the market, covering from the innovator's stage to the laggard's stage. It focuses on adoption rates in different regions based on penetration. Furthermore, the report also includes key purchase criteria and drivers of price sensitivity to help companies evaluate and develop their market growth analysis strategies.

Thermal Barrier Coatings Market Share by Geography

 Customer Landscape

Key Companies & Market Insights

Companies are implementing various strategies, such as strategic alliances, partnerships, mergers and acquisitions, geographical expansion, and product/service launches, to enhance their presence in the market.

A&A Thermal Spray Coatings: The company offers thermal barrier coatings used in the aircraft industry in the combustion section of turbine engines of aircrafts.

The market research and growth report includes detailed analyses of the competitive landscape of the market and information about key companies, including:

  • Chromalloy Gas Turbine LLC
  • Compagnie de Saint Gobain
  • CTS Inc.
  • Fisher Barton
  • Flame Spray Inc.
  • Hannecard Group
  • Hayden Corp.
  • Honeywell International Inc.
  • KECO Engineered Coatings Inc.
  • Linde Plc
  • Metallic Bonds Ltd.
  • Metallisation Ltd.
  • Northwest Mettech Corp.
  • OC Oerlikon Corp. AG
  • Precision Coatings Inc.
  • Tech Line Coatings LLC
  • Thermion Inc.
  • TWI Ltd.
  • Zircotec Ltd.

Qualitative and quantitative analysis of companies has been conducted to help clients understand the wider business environment as well as the strengths and weaknesses of key market players. Data is qualitatively analyzed to categorize companies as pure play, category-focused, industry-focused, and diversified; it is quantitatively analyzed to categorize companies as dominant, leading, strong, tentative, and weak.

Research Analyst Overview

Thermal barrier coatings (TBCs) are advanced protective solutions used in various industries, including aerospace and automobile production. These coatings, made from epoxy resins, polymers, aluminates, zirconia, and yttriastabilized zirconia, enhance the performance of components by reducing thermal conductivity and thermal expansion coefficient. TBCs provide erosion resistance and can withstand high operating temperatures in applications such as exhaust systems and aero engine technologies. Coating technologies like physical vapor deposition, air plasma spray, and high velocity oxyfuel (HVOF) are commonly used to apply TBCs. HVOF technology, for instance, utilizes a high-velocity gas stream to spray metal particles onto a substrate, creating a dense, uniform coating.

TBCs play a crucial role in industries dealing with pollution and electricity demand, such as stationary power plants and the energy sector. They protect gas turbine blades and engines from surface degradation processes like corrosion, ensuring optimal performance and longevity. TBCs are not limited to aerospace and power generation; they are also used in automobile production, marine propulsion, and gasoline engines. The versatility of TBCs makes them an essential component in various industries, contributing to efficiency, durability, and reduced emissions.

Market Scope

Report Coverage

Details

Page number

158

Base year

2023

Historic period

2018-2022

Forecast period

2024-2028

Growth momentum & CAGR

Accelerate at a CAGR of 5.36%

Market growth 2024-2028

USD 4.83 billion

Market structure

Fragmented

YoY growth 2023-2024(%)

5.22

Regional analysis

North America, APAC, Europe, Middle East and Africa, and South America

Performing market contribution

North America at 36%

Key countries

US, China, India, Germany, and UK

Competitive landscape

Leading Companies, Market Positioning of Companies, Competitive Strategies, and Industry Risks

Key companies profiled

A and A Thermal Spray Coatings, Chromalloy Gas Turbine LLC, Compagnie de Saint Gobain, CTS Inc., Fisher Barton, Flame Spray Inc., Hannecard Group, Hayden Corp., Honeywell International Inc., KECO Engineered Coatings Inc., Linde Plc, Metallic Bonds Ltd., Metallisation Ltd., Northwest Mettech Corp., OC Oerlikon Corp. AG, Precision Coatings Inc., Tech Line Coatings LLC, Thermion Inc., TWI Ltd., and Zircotec Ltd.

Market dynamics

Parent market analysis, market growth inducers and obstacles, market forecast, fast-growing and slow-growing segment analysis, COVID-19 impact and recovery analysis and future consumer dynamics, market condition analysis for the forecast period

Customization purview

If our market report has not included the data that you are looking for, you can reach out to our analysts and get segments customized.

Request Free Sample

What are the Key Data Covered in this Market Research and Growth Report?

  • CAGR of the market during the forecast period
  • Detailed information on factors that will drive the market growth and forecasting between 2024 and 2028
  • Precise estimation of the size of the market  and its contribution of the market in focus to the parent market
  • Accurate predictions about upcoming market growth and trends and changes in consumer behaviour
  • Growth of the market across North America, APAC, Europe, Middle East and Africa, and South America
  • Thorough analysis of the market's competitive landscape and detailed information about companies
  • Comprehensive analysis of factors that will challenge the growth of market companies

We can help! Our analysts can customize this market research report to meet your requirements. Get in touch

1 Executive Summary

  • 1.1 Market overview
    • Exhibit 01: Executive Summary – Chart on Market Overview
    • Exhibit 02: Executive Summary – Data Table on Market Overview
    • Exhibit 03: Executive Summary – Chart on Global Market Characteristics
    • Exhibit 04: Executive Summary – Chart on Market by Geography
    • Exhibit 05: Executive Summary – Chart on Market Segmentation by Type
    • Exhibit 06: Executive Summary – Chart on Market Segmentation by End-user
    • Exhibit 07: Executive Summary – Chart on Incremental Growth
    • Exhibit 08: Executive Summary – Data Table on Incremental Growth
    • Exhibit 09: Executive Summary – Chart on Vendor Market Positioning

2 Market Landscape

  • 2.1 Market ecosystem
    • Exhibit 10: Parent market
    • Exhibit 11: Market Characteristics

3 Market Sizing

  • 3.1 Market definition
    • Exhibit 12: Offerings of vendors included in the market definition
  • 3.2 Market segment analysis
    • Exhibit 13: Market segments
  • 3.3 Market size 2023
    • 3.4 Market outlook: Forecast for 2023-2028
      • Exhibit 14: Chart on Global - Market size and forecast 2023-2028 ($ billion)
      • Exhibit 15: Data Table on Global - Market size and forecast 2023-2028 ($ billion)
      • Exhibit 16: Chart on Global Market: Year-over-year growth 2023-2028 (%)
      • Exhibit 17: Data Table on Global Market: Year-over-year growth 2023-2028 (%)

    4 Historic Market Size

    • 4.1 Global thermal barrier coatings market 2018 - 2022
      • Exhibit 18: Historic Market Size – Data Table on global thermal barrier coatings market 2018 - 2022 ($ billion)
    • 4.2 Type Segment Analysis 2018 - 2022
      • Exhibit 19: Historic Market Size – Type Segment 2018 - 2022 ($ billion)
    • 4.3 End-user Segment Analysis 2018 - 2022
      • Exhibit 20: Historic Market Size – End-user Segment 2018 - 2022 ($ billion)
    • 4.4 Geography Segment Analysis 2018 - 2022
      • Exhibit 21: Historic Market Size – Geography Segment 2018 - 2022 ($ billion)
    • 4.5 Country Segment Analysis 2018 - 2022
      • Exhibit 22: Historic Market Size – Country Segment 2018 - 2022 ($ billion)

    5 Five Forces Analysis

    • 5.1 Five forces summary
      • Exhibit 23: Five forces analysis - Comparison between 2023 and 2028
    • 5.2 Bargaining power of buyers
      • Exhibit 24: Chart on Bargaining power of buyers – Impact of key factors 2023 and 2028
    • 5.3 Bargaining power of suppliers
      • Exhibit 25: Bargaining power of suppliers – Impact of key factors in 2023 and 2028
    • 5.4 Threat of new entrants
      • Exhibit 26: Threat of new entrants – Impact of key factors in 2023 and 2028
    • 5.5 Threat of substitutes
      • Exhibit 27: Threat of substitutes – Impact of key factors in 2023 and 2028
    • 5.6 Threat of rivalry
      • Exhibit 28: Threat of rivalry – Impact of key factors in 2023 and 2028
    • 5.7 Market condition
      • Exhibit 29: Chart on Market condition - Five forces 2023 and 2028

    6 Market Segmentation by Type

    • 6.1 Market segments
      • Exhibit 30: Chart on Type - Market share 2023-2028 (%)
      • Exhibit 31: Data Table on Type - Market share 2023-2028 (%)
    • 6.2 Comparison by Type
      • Exhibit 32: Chart on Comparison by Type
      • Exhibit 33: Data Table on Comparison by Type
    • 6.3 Ceramic - Market size and forecast 2023-2028
      • Exhibit 34: Chart on Ceramic - Market size and forecast 2023-2028 ($ billion)
      • Exhibit 35: Data Table on Ceramic - Market size and forecast 2023-2028 ($ billion)
      • Exhibit 36: Chart on Ceramic - Year-over-year growth 2023-2028 (%)
      • Exhibit 37: Data Table on Ceramic - Year-over-year growth 2023-2028 (%)
    • 6.4 Metal - Market size and forecast 2023-2028
      • Exhibit 38: Chart on Metal - Market size and forecast 2023-2028 ($ billion)
      • Exhibit 39: Data Table on Metal - Market size and forecast 2023-2028 ($ billion)
      • Exhibit 40: Chart on Metal - Year-over-year growth 2023-2028 (%)
      • Exhibit 41: Data Table on Metal - Year-over-year growth 2023-2028 (%)
    • 6.5 Intermetallic - Market size and forecast 2023-2028
      • Exhibit 42: Chart on Intermetallic - Market size and forecast 2023-2028 ($ billion)
      • Exhibit 43: Data Table on Intermetallic - Market size and forecast 2023-2028 ($ billion)
      • Exhibit 44: Chart on Intermetallic - Year-over-year growth 2023-2028 (%)
      • Exhibit 45: Data Table on Intermetallic - Year-over-year growth 2023-2028 (%)
    • 6.6 Market opportunity by Type
      • Exhibit 46: Market opportunity by Type ($ billion)
      • Exhibit 47: Data Table on Market opportunity by Type ($ billion)

    7 Market Segmentation by End-user

    • 7.1 Market segments
      • Exhibit 48: Chart on End-user - Market share 2023-2028 (%)
      • Exhibit 49: Data Table on End-user - Market share 2023-2028 (%)
    • 7.2 Comparison by End-user
      • Exhibit 50: Chart on Comparison by End-user
      • Exhibit 51: Data Table on Comparison by End-user
    • 7.3 Aerospace - Market size and forecast 2023-2028
      • Exhibit 52: Chart on Aerospace - Market size and forecast 2023-2028 ($ billion)
      • Exhibit 53: Data Table on Aerospace - Market size and forecast 2023-2028 ($ billion)
      • Exhibit 54: Chart on Aerospace - Year-over-year growth 2023-2028 (%)
      • Exhibit 55: Data Table on Aerospace - Year-over-year growth 2023-2028 (%)
    • 7.4 Automotive - Market size and forecast 2023-2028
      • Exhibit 56: Chart on Automotive - Market size and forecast 2023-2028 ($ billion)
      • Exhibit 57: Data Table on Automotive - Market size and forecast 2023-2028 ($ billion)
      • Exhibit 58: Chart on Automotive - Year-over-year growth 2023-2028 (%)
      • Exhibit 59: Data Table on Automotive - Year-over-year growth 2023-2028 (%)
    • 7.5 Power plants - Market size and forecast 2023-2028
      • Exhibit 60: Chart on Power plants - Market size and forecast 2023-2028 ($ billion)
      • Exhibit 61: Data Table on Power plants - Market size and forecast 2023-2028 ($ billion)
      • Exhibit 62: Chart on Power plants - Year-over-year growth 2023-2028 (%)
      • Exhibit 63: Data Table on Power plants - Year-over-year growth 2023-2028 (%)
    • 7.6 Others - Market size and forecast 2023-2028
      • Exhibit 64: Chart on Others - Market size and forecast 2023-2028 ($ billion)
      • Exhibit 65: Data Table on Others - Market size and forecast 2023-2028 ($ billion)
      • Exhibit 66: Chart on Others - Year-over-year growth 2023-2028 (%)
      • Exhibit 67: Data Table on Others - Year-over-year growth 2023-2028 (%)
    • 7.7 Market opportunity by End-user
      • Exhibit 68: Market opportunity by End-user ($ billion)
      • Exhibit 69: Data Table on Market opportunity by End-user ($ billion)

    8 Customer Landscape

    • 8.1 Customer landscape overview
      • Exhibit 70: Analysis of price sensitivity, lifecycle, customer purchase basket, adoption rates, and purchase criteria

    9 Geographic Landscape

    • 9.1 Geographic segmentation
      • Exhibit 71: Chart on Market share by geography 2023-2028 (%)
      • Exhibit 72: Data Table on Market share by geography 2023-2028 (%)
    • 9.2 Geographic comparison
      • Exhibit 73: Chart on Geographic comparison
      • Exhibit 74: Data Table on Geographic comparison
    • 9.3 North America - Market size and forecast 2023-2028
      • Exhibit 75: Chart on North America - Market size and forecast 2023-2028 ($ billion)
      • Exhibit 76: Data Table on North America - Market size and forecast 2023-2028 ($ billion)
      • Exhibit 77: Chart on North America - Year-over-year growth 2023-2028 (%)
      • Exhibit 78: Data Table on North America - Year-over-year growth 2023-2028 (%)
    • 9.4 APAC - Market size and forecast 2023-2028
      • Exhibit 79: Chart on APAC - Market size and forecast 2023-2028 ($ billion)
      • Exhibit 80: Data Table on APAC - Market size and forecast 2023-2028 ($ billion)
      • Exhibit 81: Chart on APAC - Year-over-year growth 2023-2028 (%)
      • Exhibit 82: Data Table on APAC - Year-over-year growth 2023-2028 (%)
    • 9.5 Europe - Market size and forecast 2023-2028
      • Exhibit 83: Chart on Europe - Market size and forecast 2023-2028 ($ billion)
      • Exhibit 84: Data Table on Europe - Market size and forecast 2023-2028 ($ billion)
      • Exhibit 85: Chart on Europe - Year-over-year growth 2023-2028 (%)
      • Exhibit 86: Data Table on Europe - Year-over-year growth 2023-2028 (%)
    • 9.6 Middle East and Africa - Market size and forecast 2023-2028
      • Exhibit 87: Chart on Middle East and Africa - Market size and forecast 2023-2028 ($ billion)
      • Exhibit 88: Data Table on Middle East and Africa - Market size and forecast 2023-2028 ($ billion)
      • Exhibit 89: Chart on Middle East and Africa - Year-over-year growth 2023-2028 (%)
      • Exhibit 90: Data Table on Middle East and Africa - Year-over-year growth 2023-2028 (%)
    • 9.7 South America - Market size and forecast 2023-2028
      • Exhibit 91: Chart on South America - Market size and forecast 2023-2028 ($ billion)
      • Exhibit 92: Data Table on South America - Market size and forecast 2023-2028 ($ billion)
      • Exhibit 93: Chart on South America - Year-over-year growth 2023-2028 (%)
      • Exhibit 94: Data Table on South America - Year-over-year growth 2023-2028 (%)
    • 9.8 US - Market size and forecast 2023-2028
      • Exhibit 95: Chart on US - Market size and forecast 2023-2028 ($ billion)
      • Exhibit 96: Data Table on US - Market size and forecast 2023-2028 ($ billion)
      • Exhibit 97: Chart on US - Year-over-year growth 2023-2028 (%)
      • Exhibit 98: Data Table on US - Year-over-year growth 2023-2028 (%)
    • 9.9 China - Market size and forecast 2023-2028
      • Exhibit 99: Chart on China - Market size and forecast 2023-2028 ($ billion)
      • Exhibit 100: Data Table on China - Market size and forecast 2023-2028 ($ billion)
      • Exhibit 101: Chart on China - Year-over-year growth 2023-2028 (%)
      • Exhibit 102: Data Table on China - Year-over-year growth 2023-2028 (%)
    • 9.10 Germany - Market size and forecast 2023-2028
      • Exhibit 103: Chart on Germany - Market size and forecast 2023-2028 ($ billion)
      • Exhibit 104: Data Table on Germany - Market size and forecast 2023-2028 ($ billion)
      • Exhibit 105: Chart on Germany - Year-over-year growth 2023-2028 (%)
      • Exhibit 106: Data Table on Germany - Year-over-year growth 2023-2028 (%)
    • 9.11 India - Market size and forecast 2023-2028
      • Exhibit 107: Chart on India - Market size and forecast 2023-2028 ($ billion)
      • Exhibit 108: Data Table on India - Market size and forecast 2023-2028 ($ billion)
      • Exhibit 109: Chart on India - Year-over-year growth 2023-2028 (%)
      • Exhibit 110: Data Table on India - Year-over-year growth 2023-2028 (%)
    • 9.12 UK - Market size and forecast 2023-2028
      • Exhibit 111: Chart on UK - Market size and forecast 2023-2028 ($ billion)
      • Exhibit 112: Data Table on UK - Market size and forecast 2023-2028 ($ billion)
      • Exhibit 113: Chart on UK - Year-over-year growth 2023-2028 (%)
      • Exhibit 114: Data Table on UK - Year-over-year growth 2023-2028 (%)
    • 9.13 Market opportunity by geography
      • Exhibit 115: Market opportunity by geography ($ billion)
      • Exhibit 116: Data Tables on Market opportunity by geography ($ billion)

    10 Drivers, Challenges, and Trends

    • 10.1 Market drivers
      • 10.2 Market challenges
        • 10.3 Impact of drivers and challenges
          • Exhibit 117: Impact of drivers and challenges in 2023 and 2028
        • 10.4 Market trends

          11 Vendor Landscape

          • 11.1 Overview
            • 11.2 Vendor landscape
              • Exhibit 118: Overview on Criticality of inputs and Factors of differentiation
            • 11.3 Landscape disruption
              • Exhibit 119: Overview on factors of disruption
            • 11.4 Industry risks
              • Exhibit 120: Impact of key risks on business

            12 Vendor Analysis

            • 12.1 Vendors covered
              • Exhibit 121: Vendors covered
            • 12.2 Market positioning of vendors
              • Exhibit 122: Matrix on vendor position and classification
            • 12.3 A and A Thermal Spray Coatings
              • Exhibit 123: A and A Thermal Spray Coatings - Overview
              • Exhibit 124: A and A Thermal Spray Coatings - Product / Service
              • Exhibit 125: A and A Thermal Spray Coatings - Key offerings
            • 12.4 Chromalloy Gas Turbine LLC
              • Exhibit 126: Chromalloy Gas Turbine LLC - Overview
              • Exhibit 127: Chromalloy Gas Turbine LLC - Product / Service
              • Exhibit 128: Chromalloy Gas Turbine LLC - Key offerings
            • 12.5 Compagnie de Saint Gobain
              • Exhibit 129: Compagnie de Saint Gobain - Overview
              • Exhibit 130: Compagnie de Saint Gobain - Business segments
              • Exhibit 131: Compagnie de Saint Gobain - Key news
              • Exhibit 132: Compagnie de Saint Gobain - Key offerings
              • Exhibit 133: Compagnie de Saint Gobain - Segment focus
            • 12.6 CTS Inc.
              • Exhibit 134: CTS Inc. - Overview
              • Exhibit 135: CTS Inc. - Product / Service
              • Exhibit 136: CTS Inc. - Key offerings
            • 12.7 Hannecard Group
              • Exhibit 137: Hannecard Group - Overview
              • Exhibit 138: Hannecard Group - Product / Service
              • Exhibit 139: Hannecard Group - Key offerings
            • 12.8 Hayden Corp.
              • Exhibit 140: Hayden Corp. - Overview
              • Exhibit 141: Hayden Corp. - Product / Service
              • Exhibit 142: Hayden Corp. - Key offerings
            • 12.9 Honeywell International Inc.
              • Exhibit 143: Honeywell International Inc. - Overview
              • Exhibit 144: Honeywell International Inc. - Business segments
              • Exhibit 145: Honeywell International Inc. - Key news
              • Exhibit 146: Honeywell International Inc. - Key offerings
              • Exhibit 147: Honeywell International Inc. - Segment focus
            • 12.10 KECO Engineered Coatings Inc.
              • Exhibit 148: KECO Engineered Coatings Inc. - Overview
              • Exhibit 149: KECO Engineered Coatings Inc. - Product / Service
              • Exhibit 150: KECO Engineered Coatings Inc. - Key offerings
            • 12.11 Linde Plc
              • Exhibit 151: Linde Plc - Overview
              • Exhibit 152: Linde Plc - Business segments
              • Exhibit 153: Linde Plc - Key news
              • Exhibit 154: Linde Plc - Key offerings
              • Exhibit 155: Linde Plc - Segment focus
            • 12.12 Metallic Bonds Ltd.
              • Exhibit 156: Metallic Bonds Ltd. - Overview
              • Exhibit 157: Metallic Bonds Ltd. - Product / Service
              • Exhibit 158: Metallic Bonds Ltd. - Key offerings
            • 12.13 Metallisation Ltd.
              • Exhibit 159: Metallisation Ltd. - Overview
              • Exhibit 160: Metallisation Ltd. - Product / Service
              • Exhibit 161: Metallisation Ltd. - Key offerings
            • 12.14 Northwest Mettech Corp.
              • Exhibit 162: Northwest Mettech Corp. - Overview
              • Exhibit 163: Northwest Mettech Corp. - Product / Service
              • Exhibit 164: Northwest Mettech Corp. - Key offerings
            • 12.15 OC Oerlikon Corp. AG
              • Exhibit 165: OC Oerlikon Corp. AG - Overview
              • Exhibit 166: OC Oerlikon Corp. AG - Business segments
              • Exhibit 167: OC Oerlikon Corp. AG - Key offerings
              • Exhibit 168: OC Oerlikon Corp. AG - Segment focus
            • 12.16 Thermion Inc.
              • Exhibit 169: Thermion Inc. - Overview
              • Exhibit 170: Thermion Inc. - Product / Service
              • Exhibit 171: Thermion Inc. - Key offerings
            • 12.17 TWI Ltd.
              • Exhibit 172: TWI Ltd. - Overview
              • Exhibit 173: TWI Ltd. - Product / Service
              • Exhibit 174: TWI Ltd. - Key offerings

            13 Appendix

            • 13.1 Scope of the report
              • 13.2 Inclusions and exclusions checklist
                • Exhibit 175: Inclusions checklist
                • Exhibit 176: Exclusions checklist
              • 13.3 Currency conversion rates for US$
                • Exhibit 177: Currency conversion rates for US$
              • 13.4 Research methodology
                • Exhibit 178: Research methodology
                • Exhibit 179: Validation techniques employed for market sizing
                • Exhibit 180: Information sources
              • 13.5 List of abbreviations
                • Exhibit 181: List of abbreviations

              Research Methodology

              Technavio presents a detailed picture of the market by way of study, synthesis, and summation of data from multiple sources. The analysts have presented the various facets of the market with a particular focus on identifying the key industry influencers. The data thus presented is comprehensive, reliable, and the result of extensive research, both primary and secondary.

              INFORMATION SOURCES

              Primary sources

              • Manufacturers and suppliers
              • Channel partners
              • Industry experts
              • Strategic decision makers

              Secondary sources

              • Industry journals and periodicals
              • Government data
              • Financial reports of key industry players
              • Historical data
              • Press releases

              DATA ANALYSIS

              Data Synthesis

              • Collation of data
              • Estimation of key figures
              • Analysis of derived insights

              Data Validation

              • Triangulation with data models
              • Reference against proprietary databases
              • Corroboration with industry experts

              REPORT WRITING

              Qualitative

              • Market drivers
              • Market challenges
              • Market trends
              • Five forces analysis

              Quantitative

              • Market size and forecast
              • Market segmentation
              • Geographical insights
              • Competitive landscape

              Interested in this report?

              Get your sample now to see our research methodology and insights!

              Download Now

              Frequently Asked Questions

              Thermal Barrier Coatings market growth will increase by $ 4.83 bn during 2024-2028.

              The Thermal Barrier Coatings market is expected to grow at a CAGR of 5.36% during 2024-2028.

              Thermal Barrier Coatings market is segmented by Type( Ceramic, Metal, Intermetallic) End-user( Aerospace, Automotive, Power plants, Others)

              A and A Thermal Spray Coatings, Chromalloy Gas Turbine LLC, Compagnie de Saint Gobain, CTS Inc., Fisher Barton, Flame Spray Inc., Hannecard Group, Hayden Corp., Honeywell International Inc., KECO Engineered Coatings Inc., Linde Plc, Metallic Bonds Ltd., Metallisation Ltd., Northwest Mettech Corp., OC Oerlikon Corp. AG, Precision Coatings Inc., Tech Line Coatings LLC, Thermion Inc., TWI Ltd., Zircotec Ltd. are a few of the key vendors in the Thermal Barrier Coatings market.

              North America will register the highest growth rate of 36% among the other regions. Therefore, the Thermal Barrier Coatings market in North America is expected to garner significant business opportunities for the vendors during the forecast period.

              US, China, India, Germany, UK

              • Increasing demand for fuel-efficient aircraft and gas turbine enginesThe need for reducingto reduce emissions is driving up the demand for fuel-efficient aircraft and gas turbine engines is the driving factor this market.
              • which is driving major the growth ofin the global thermal barrier coatings market. Thermal barrier se cutting-edge coatings offer an essential answer coating alternatives by improving the longevity and performance of engine parts exposed to high temperatures. For instance is the driving factor this market.
              • thermal barrier coatings are used in Pratt & Whitney PurePower Geared Turbofan engines to lower emissions and increase fuel efficiency. These coatings are used in the aerospace industry is the driving factor this market.
              • such as on Boeing 787 Dreamliner is the driving factor this market.
              • to improve fuel efficiency. The increased focus on emission reduction and fuel efficiency highlights the vital role that thermal barrier coatings play is the driving factor this market.
              • making them a key player in the global market for these technologies. Such factors are expected to fuel the fuel the demand for thermal barrier coatings from the gas turbine engines and aircraft industry is the driving factor this market.
              • which will thereby driveing the growth of the global thermal barrier coatings market during the forecast period. is the driving factor this market.

              The Thermal Barrier Coatings market vendors should focus on grabbing business opportunities from the Ceramic segment as it accounted for the largest market share in the base year.