Cross-Border E-Commerce Logistics Market Size 2025-2029
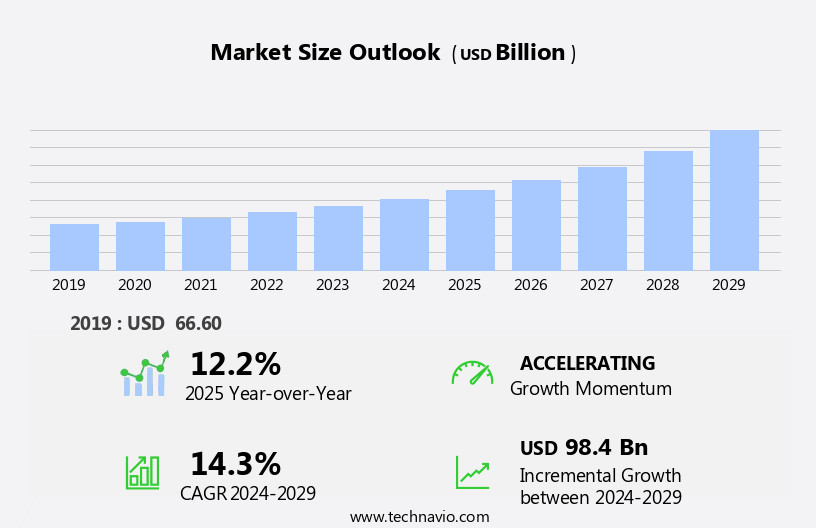
The cross-border e-commerce logistics market size is forecast to increase by USD 98.4 billion at a CAGR of 14.3% between 2024 and 2029.
- The market is experiencing significant growth, driven by the increasing penetration of mobile computing devices and the adoption of blockchain technology in the logistics sector. The former enables seamless shopping experiences for consumers, leading to a in cross-border e-commerce transactions. The latter offers enhanced security and transparency, addressing concerns around counterfeit goods and supply chain visibility. However, the market is not without challenges. The high cost of air freight and logistics remains a significant barrier to entry for many players, particularly for those operating in long-tail markets.
- To capitalize on market opportunities and navigate these challenges effectively, companies must focus on optimizing their logistics networks, leveraging technology to streamline operations, and exploring alternative transportation modes. By doing so, they can reduce costs, improve delivery times, and enhance customer satisfaction, positioning themselves for long-term success in the dynamic and evolving cross-border e-commerce logistics landscape.
What will be the Size of the Cross-Border E-Commerce Logistics Market during the forecast period?

Request Free Sample
- The market has experienced significant growth as businesses and consumers increasingly engage in online trading across international borders. Retailers and e-commerce companies face unique challenges in this arena, including flight cancellations, travel bans, border controls, and business shutdowns due to health checks and quarantines related to the outbreak. Freight carriers and logistics providers play a crucial role in facilitating the transportation of goods, navigating complex regulations and border processes. The market's size is substantial, with a growing number of B2B and B2C transactions involving international shipments.
- Mobile computing and blockchain technology are driving innovation in cross-border logistics, enabling real-time tracking and secure transactions. Despite these advancements, the market remains subject to disruptions from border controls and international border closures, as well as uncertainties surrounding air freight and consumer spending. Overall, the market is a dynamic and evolving landscape, presenting both opportunities and challenges for businesses and individuals alike.
How is this Cross-Border E-Commerce Logistics Industry segmented?
The cross-border e-commerce logistics industry research report provides comprehensive data (region-wise segment analysis), with forecasts and estimates in "USD billion" for the period 2025-2029, as well as historical data from 2019-2023 for the following segments.
- Service
- Transportation
- Warehousing
- Others
- End-user
- Manufacturing
- Automotive
- Oil and gas
- Others
- Delivery Mode
- Standard delivery
- Same-day delivery
- Geography
- APAC
- Australia
- China
- India
- Japan
- South Korea
- North America
- Europe
- South America
- Middle East and Africa
By Service Insights
The transportation segment is estimated to witness significant growth during the forecast period.
The transportation sector in The market is experiencing significant growth due to the expanding e-commerce industry and increased investment in logistics infrastructure by governments. E-commerce retailers and brands rely on logistics enterprises to move their products across international borders using various modes of transport, including rail, air, water, and roadways. The high capital intensity and expertise required for transportation services make outsourcing an attractive option. Government initiatives to enhance logistics capabilities and streamline customs clearance processes are also contributing to the market's growth. Logistics service providers offer value-added solutions such as contract logistics, freight forwarding, cargo insurance, network planning, and network optimization to cater to the unique needs of cross-border e-commerce businesses.
Transportation challenges, including trade barriers, border controls, travel bans, and movement restrictions, pose significant hurdles for cross-border e-commerce logistics. However, advancements in technology, such as blockchain and mobile computing, are helping to improve the accuracy, security, and versatility of data flow, making international transactions more efficient. Despite these challenges, the market is expected to grow substantially during the forecast period due to the increasing middleclass population, urbanization, and the shift towards online shopping. The market dynamics are influenced by factors such as consumer spending, confirmed cases and deaths related to outbreaks, business shutdowns, health checks, regulations, and flight cancellations. Freight carriers and freights are adapting to these challenges by implementing new strategies, such as quarantines and online trading platforms, to ensure the smooth flow of goods.

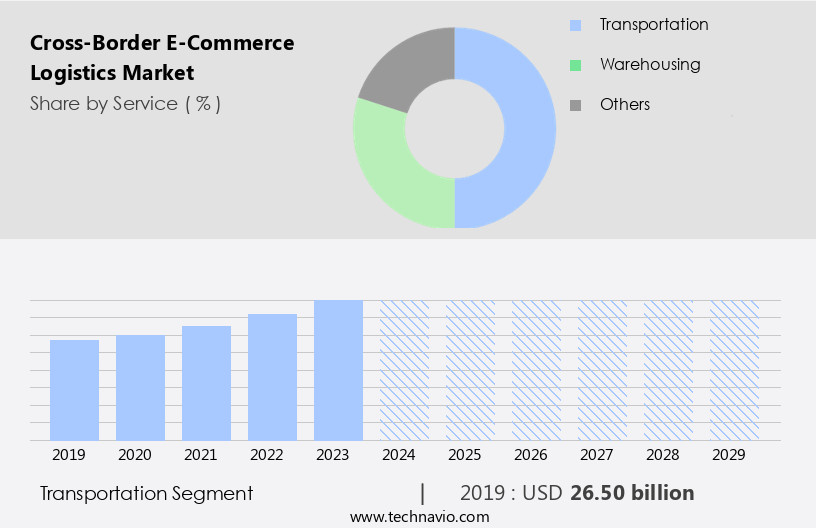
Get a glance at the market report of share of various segments Request Free Sample
The Transportation segment was valued at USD 26.50 billion in 2019 and showed a gradual increase during the forecast period.
Regional Analysis
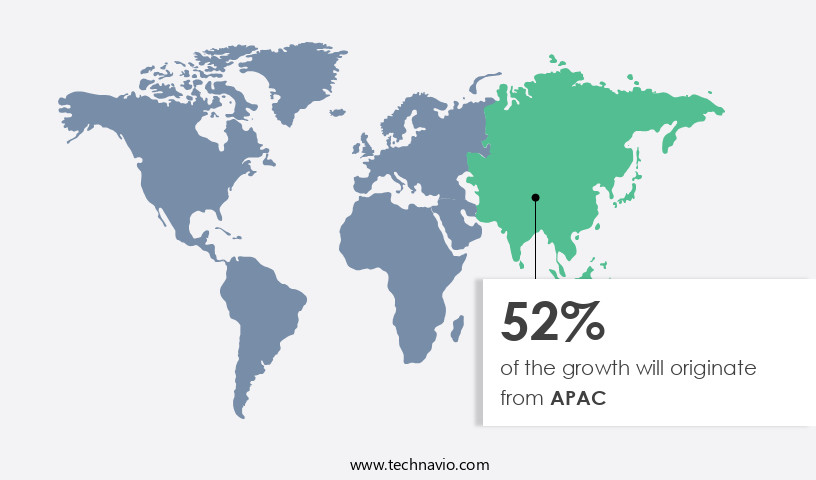
APAC is estimated to contribute 52% to the growth of the global market during the forecast period.Technavio’s analysts have elaborately explained the regional trends and drivers that shape the market during the forecast period.

For more insights on the market size of various regions, Request Free Sample
The market in Asia Pacific is projected to expand due to the significant consumer base and increasing urbanization in the region. With the growing disposable income and widespread use of smartphones, the number of digital transactions is surging. This digital shift offers opportunities for e-commerce companies to target the vast population and expand their consumer base. Government initiatives, such as trade agreements and foreign direct investment, are further bolstering the market's growth. However, trade barriers, including customs clearance, border controls, and movement restrictions, pose challenges to cross-border e-commerce logistics. The unpredictability of events like outbreaks, business shutdowns, and travel bans adds complexity to the market.
To mitigate risks and ensure accuracy in the flow of goods, businesses are exploring the use of blockchain technology for secure and efficient cross-border transportation. The versatility of data and the increasing importance of security are driving investments in logistics enterprises to address these challenges.
Market Dynamics
Our researchers analyzed the data with 2024 as the base year, along with the key drivers, trends, and challenges. A holistic analysis of drivers will help companies refine their marketing strategies to gain a competitive advantage.
What are the key market drivers leading to the rise in the adoption of Cross-Border E-Commerce Logistics Industry?
- Increasing penetration of mobile computing devices is the key driver of the market.
- The proliferation of mobile devices has significantly influenced the expansion of the global Internet and e-commerce market. Both mobile phones and tablets are experiencing notable growth in usage across various markets. Initially, many e-commerce companies provided their services through websites; however, the increasing popularity of mobile devices has led to the development of mobile applications. These apps offer a superior shopping experience, with ease of payment and convenience for customers.
- Moreover, they enable the recording of user data, which enables targeted advertising and a personalized shopping experience, thereby enhancing customer retention. The convenience and enhanced user experience offered by mobile shopping apps have contributed to the growth of the market.
What are the market trends shaping the Cross-Border E-Commerce Logistics Industry?
- Adoption of blockchain technology in logistics sector is the upcoming market trend.
- Blockchain technology is revolutionizing the logistics industry by enhancing the security, visibility, and accuracy of data. By recording digital transactions such as log miles and hours driven, this technology enables more precise forecasting and asset utilization. It also prevents fraudulent activities in freight management and streamlines elements like freight contracts and parts management. Major logistics service providers are anticipated to adopt this technology due to its numerous benefits, including increased operational visibility and effective product tracking throughout the logistics process.
- This adoption is expected to transform the industry, making it more efficient and secure.
What challenges does the Cross-Border E-Commerce Logistics Industry face during its growth?
- High cost of air freight and logistics is a key challenge affecting the industry growth.
- The market faces a significant challenge due to the high cost of air freight and logistics services. This expense discourages a substantial number of potential users from utilizing these services for transporting their goods. The operational costs have been identified as a major hindrance to market growth. Despite the advantages of fast delivery offered by air freight, many buyers opt for marine or land transportation due to their lower costs.
- This trend is particularly prevalent for non-urgent or non-high-value goods. Consequently, the high cost structure poses a significant barrier to entry for many players in the cross-border e-commerce logistics industry.
Exclusive Customer Landscape
The cross-border e-commerce logistics market forecasting report includes the adoption lifecycle of the market, covering from the innovator’s stage to the laggard’s stage. It focuses on adoption rates in different regions based on penetration. Furthermore, the cross-border e-commerce logistics market report also includes key purchase criteria and drivers of price sensitivity to help companies evaluate and develop their market growth analysis strategies.
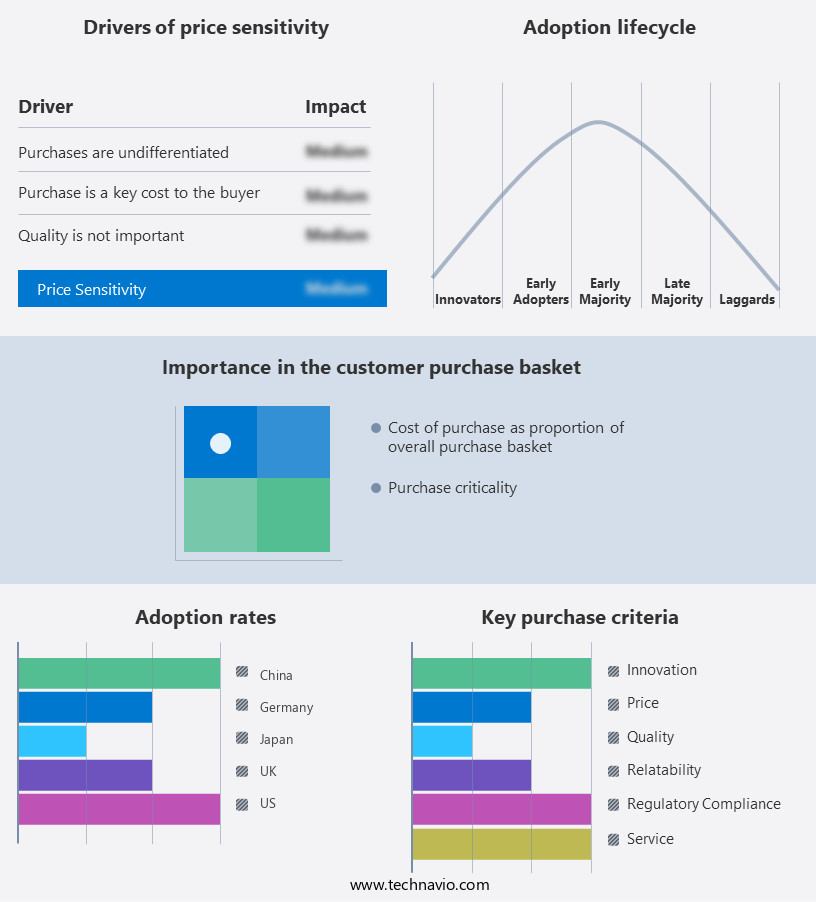
Customer Landscape
Key Companies & Market Insights
Companies are implementing various strategies, such as strategic alliances, cross-border e-commerce logistics market forecast, partnerships, mergers and acquisitions, geographical expansion, and product/service launches, to enhance their presence in the industry.
Agility Public Warehousing Co. K.S.C.P - Cainiao, the company's cross-border e-commerce logistics brand, streamlines global trade for online sellers through efficient solutions. By leveraging advanced technologies and extensive global networks, Cainiao ensures seamless international shipping and delivery, ultimately enhancing sellers' competitiveness in the digital marketplace.
The industry research and growth report includes detailed analyses of the competitive landscape of the market and information about key companies, including:
- Agility Public Warehousing Co. K.S.C.P
- Alibaba Group Holding Ltd.
- Amazon.com Inc.
- AP Moller Maersk AS
- Aramex International LLC
- C H Robinson Worldwide Inc.
- CMA CGM Group
- ContextLogic Inc.
- Deutsche Post AG
- DSV AS
- eBay Inc.
- FedEx Corp.
- GXO Logistics Inc.
- JD.com Inc.
- Kuehne Nagel Management AG
- Newegg Commerce Inc.
- SF Express Co. Ltd.
- Singapore Post Ltd.
- United Parcel Service Inc.
- XPO Inc.
Qualitative and quantitative analysis of companies has been conducted to help clients understand the wider business environment as well as the strengths and weaknesses of key industry players. Data is qualitatively analyzed to categorize companies as pure play, category-focused, industry-focused, and diversified; it is quantitatively analyzed to categorize companies as dominant, leading, strong, tentative, and weak.
Research Analyst Overview
Cross-border e-commerce logistics has emerged as a significant market dynamic in the global retail landscape. The international trade of consumer goods through electronic channels has witnessed remarkable growth in recent years, driven by various factors. One of the key challenges in cross-border e-commerce is the existence of trade barriers at international borders. Retailers and brands face numerous hurdles in moving their products across borders, including regulatory compliance, customs clearance, and transportation logistics. These barriers can lead to increased costs, longer delivery times, and potential disruptions to the flow of goods. Urbanization and the growing middleclass population in developing regions have fueled the demand for consumer goods, leading to an increase in cross-border e-commerce transactions.
The convenience of online shopping, digital transactions, and the versatility of data have made it easier for individuals to access a wider range of products from around the world. However, the cross-border e-commerce market is not without its challenges. The outbreak of various diseases, business shutdowns, and travel bans have disrupted the flow of goods and caused delays in customs clearance. Freight carriers have reported increased fraudulent freight activities, leading to security concerns and potential losses for businesses. The adoption of blockchain technology in cross-border e-commerce logistics has emerged as a potential solution to some of these challenges. This technology provides a secure and transparent way to track the movement of goods across borders, reducing the risk of fraud and increasing the accuracy of customs clearance.
The infrastructure and regulations governing cross-border e-commerce logistics vary widely from one country to another. Businesses need to navigate complex customs procedures, health checks, and movement restrictions to ensure the timely and cost-effective delivery of their products. The future estimations for the cross-border e-commerce market are positive, with significant investment pockets in developed regions. However, the market is subject to various economic and geopolitical factors that can impact the flow of goods and the profitability of logistics enterprises. In , cross-border e-commerce logistics is a complex and dynamic market that requires a deep of the various factors that impact the flow of goods across international borders.
Retailers and brands need to navigate a complex regulatory landscape, ensure the security of their shipments, and adapt to changing market conditions to succeed in this market. The use of technology, such as blockchain, can help mitigate some of the challenges and improve the efficiency and accuracy of cross-border e-commerce logistics.
Market Scope
|
Report Coverage
|
Details
|
Page number
|
223
|
Base year
|
2024
|
Historic period
|
2019-2023 |
Forecast period
|
2025-2029
|
Growth momentum & CAGR
|
Accelerate at a CAGR of 14.3%
|
Market growth 2025-2029
|
USD 98.4 billion
|
Market structure
|
Fragmented
|
YoY growth 2024-2025(%)
|
12.2
|
Key countries
|
China, US, Canada, Japan, South Korea, India, UK, Germany, France, and Australia
|
Competitive landscape
|
Leading Companies, Market Positioning of Companies, Competitive Strategies, and Industry Risks
|
Request Free Sample
What are the Key Data Covered in this Cross-Border E-Commerce Logistics Market Research and Growth Report?
- CAGR of the Cross-Border E-Commerce Logistics industry during the forecast period
- Detailed information on factors that will drive the growth and forecasting between 2025 and 2029
- Precise estimation of the size of the market and its contribution of the industry in focus to the parent market
- Accurate predictions about upcoming growth and trends and changes in consumer behaviour
- Growth of the market across APAC, North America, Europe, South America, and Middle East and Africa
- Thorough analysis of the market’s competitive landscape and detailed information about companies
- Comprehensive analysis of factors that will challenge the cross-border e-commerce logistics market growth of industry companies
We can help! Our analysts can customize this cross-border e-commerce logistics market research report to meet your requirements.
Get in touch
1 Executive Summary
- 1.1 Market overview
- Executive Summary - Chart on Market Overview
- Executive Summary - Data Table on Market Overview
- Executive Summary - Chart on Global Market Characteristics
- Executive Summary - Chart on Market by Geography
- Executive Summary - Chart on Market Segmentation by Service
- Executive Summary - Chart on Market Segmentation by End-user
- Executive Summary - Chart on Market Segmentation by Delivery Mode
- Executive Summary - Chart on Incremental Growth
- Executive Summary - Data Table on Incremental Growth
- Executive Summary - Chart on Company Market Positioning
2 Technavio Analysis
- 2.1 Analysis of price sensitivity, lifecycle, customer purchase basket, adoption rates, and purchase criteria
- Analysis of price sensitivity, lifecycle, customer purchase basket, adoption rates, and purchase criteria
- 2.2 Criticality of inputs and Factors of differentiation
- Overview on criticality of inputs and factors of differentiation
- 2.3 Factors of disruption
- Overview on factors of disruption
- 2.4 Impact of drivers and challenges
- Impact of drivers and challenges in 2024 and 2029
3 Market Landscape
- 3.1 Market ecosystem
- Parent Market
- Data Table on - Parent Market
- 3.2 Market characteristics
- Market characteristics analysis
4 Market Sizing
- 4.1 Market definition
- Offerings of companies included in the market definition
- 4.2 Market segment analysis
- 4.4 Market outlook: Forecast for 2024-2029
- Chart on Global - Market size and forecast 2024-2029 ($ billion)
- Data Table on Global - Market size and forecast 2024-2029 ($ billion)
- Chart on Global Market: Year-over-year growth 2024-2029 (%)
- Data Table on Global Market: Year-over-year growth 2024-2029 (%)
5 Historic Market Size
- 5.1 Global Cross-Border E-Commerce Logistics Market 2019 - 2023
- Historic Market Size - Data Table on Global Cross-Border E-Commerce Logistics Market 2019 - 2023 ($ billion)
- 5.2 Service segment analysis 2019 - 2023
- Historic Market Size - Service Segment 2019 - 2023 ($ billion)
- 5.3 End-user segment analysis 2019 - 2023
- Historic Market Size - End-user Segment 2019 - 2023 ($ billion)
- 5.4 Delivery Mode segment analysis 2019 - 2023
- Historic Market Size - Delivery Mode Segment 2019 - 2023 ($ billion)
- 5.5 Geography segment analysis 2019 - 2023
- Historic Market Size - Geography Segment 2019 - 2023 ($ billion)
- 5.6 Country segment analysis 2019 - 2023
- Historic Market Size - Country Segment 2019 - 2023 ($ billion)
6 Qualitative Analysis
- 6.1 The AI impact on Global Cross-border E-commerce Logistics Market
7 Five Forces Analysis
- 7.1 Five forces summary
- Five forces analysis - Comparison between 2024 and 2029
- 7.2 Bargaining power of buyers
- Bargaining power of buyers - Impact of key factors 2024 and 2029
- 7.3 Bargaining power of suppliers
- Bargaining power of suppliers - Impact of key factors in 2024 and 2029
- 7.4 Threat of new entrants
- Threat of new entrants - Impact of key factors in 2024 and 2029
- 7.5 Threat of substitutes
- Threat of substitutes - Impact of key factors in 2024 and 2029
- 7.6 Threat of rivalry
- Threat of rivalry - Impact of key factors in 2024 and 2029
- 7.7 Market condition
- Chart on Market condition - Five forces 2024 and 2029
8 Market Segmentation by Service
- 8.1 Market segments
- Chart on Service - Market share 2024-2029 (%)
- Data Table on Service - Market share 2024-2029 (%)
- 8.2 Comparison by Service
- Chart on Comparison by Service
- Data Table on Comparison by Service
- 8.3 Transportation - Market size and forecast 2024-2029
- Chart on Transportation - Market size and forecast 2024-2029 ($ billion)
- Data Table on Transportation - Market size and forecast 2024-2029 ($ billion)
- Chart on Transportation - Year-over-year growth 2024-2029 (%)
- Data Table on Transportation - Year-over-year growth 2024-2029 (%)
- 8.4 Warehousing - Market size and forecast 2024-2029
- Chart on Warehousing - Market size and forecast 2024-2029 ($ billion)
- Data Table on Warehousing - Market size and forecast 2024-2029 ($ billion)
- Chart on Warehousing - Year-over-year growth 2024-2029 (%)
- Data Table on Warehousing - Year-over-year growth 2024-2029 (%)
- 8.5 Others - Market size and forecast 2024-2029
- Chart on Others - Market size and forecast 2024-2029 ($ billion)
- Data Table on Others - Market size and forecast 2024-2029 ($ billion)
- Chart on Others - Year-over-year growth 2024-2029 (%)
- Data Table on Others - Year-over-year growth 2024-2029 (%)
- 8.6 Market opportunity by Service
- Market opportunity by Service ($ billion)
- Data Table on Market opportunity by Service ($ billion)
9 Market Segmentation by End-user
- 9.1 Market segments
- Chart on End-user - Market share 2024-2029 (%)
- Data Table on End-user - Market share 2024-2029 (%)
- 9.2 Comparison by End-user
- Chart on Comparison by End-user
- Data Table on Comparison by End-user
- 9.3 Manufacturing - Market size and forecast 2024-2029
- Chart on Manufacturing - Market size and forecast 2024-2029 ($ billion)
- Data Table on Manufacturing - Market size and forecast 2024-2029 ($ billion)
- Chart on Manufacturing - Year-over-year growth 2024-2029 (%)
- Data Table on Manufacturing - Year-over-year growth 2024-2029 (%)
- 9.4 Automotive - Market size and forecast 2024-2029
- Chart on Automotive - Market size and forecast 2024-2029 ($ billion)
- Data Table on Automotive - Market size and forecast 2024-2029 ($ billion)
- Chart on Automotive - Year-over-year growth 2024-2029 (%)
- Data Table on Automotive - Year-over-year growth 2024-2029 (%)
- 9.5 Oil and gas - Market size and forecast 2024-2029
- Chart on Oil and gas - Market size and forecast 2024-2029 ($ billion)
- Data Table on Oil and gas - Market size and forecast 2024-2029 ($ billion)
- Chart on Oil and gas - Year-over-year growth 2024-2029 (%)
- Data Table on Oil and gas - Year-over-year growth 2024-2029 (%)
- 9.6 Others - Market size and forecast 2024-2029
- Chart on Others - Market size and forecast 2024-2029 ($ billion)
- Data Table on Others - Market size and forecast 2024-2029 ($ billion)
- Chart on Others - Year-over-year growth 2024-2029 (%)
- Data Table on Others - Year-over-year growth 2024-2029 (%)
- 9.7 Market opportunity by End-user
- Market opportunity by End-user ($ billion)
- Data Table on Market opportunity by End-user ($ billion)
10 Market Segmentation by Delivery Mode
- 10.1 Market segments
- Chart on Delivery Mode - Market share 2024-2029 (%)
- Data Table on Delivery Mode - Market share 2024-2029 (%)
- 10.2 Comparison by Delivery Mode
- Chart on Comparison by Delivery Mode
- Data Table on Comparison by Delivery Mode
- 10.3 Standard delivery - Market size and forecast 2024-2029
- Chart on Standard delivery - Market size and forecast 2024-2029 ($ billion)
- Data Table on Standard delivery - Market size and forecast 2024-2029 ($ billion)
- Chart on Standard delivery - Year-over-year growth 2024-2029 (%)
- Data Table on Standard delivery - Year-over-year growth 2024-2029 (%)
- 10.4 Same-day delivery - Market size and forecast 2024-2029
- Chart on Same-day delivery - Market size and forecast 2024-2029 ($ billion)
- Data Table on Same-day delivery - Market size and forecast 2024-2029 ($ billion)
- Chart on Same-day delivery - Year-over-year growth 2024-2029 (%)
- Data Table on Same-day delivery - Year-over-year growth 2024-2029 (%)
- 10.5 Market opportunity by Delivery Mode
- Market opportunity by Delivery Mode ($ billion)
- Data Table on Market opportunity by Delivery Mode ($ billion)
11 Customer Landscape
- 11.1 Customer landscape overview
- Analysis of price sensitivity, lifecycle, customer purchase basket, adoption rates, and purchase criteria
12 Geographic Landscape
- 12.1 Geographic segmentation
- Chart on Market share by geography 2024-2029 (%)
- Data Table on Market share by geography 2024-2029 (%)
- 12.2 Geographic comparison
- Chart on Geographic comparison
- Data Table on Geographic comparison
- 12.3 APAC - Market size and forecast 2024-2029
- Chart on APAC - Market size and forecast 2024-2029 ($ billion)
- Data Table on APAC - Market size and forecast 2024-2029 ($ billion)
- Chart on APAC - Year-over-year growth 2024-2029 (%)
- Data Table on APAC - Year-over-year growth 2024-2029 (%)
- 12.4 North America - Market size and forecast 2024-2029
- Chart on North America - Market size and forecast 2024-2029 ($ billion)
- Data Table on North America - Market size and forecast 2024-2029 ($ billion)
- Chart on North America - Year-over-year growth 2024-2029 (%)
- Data Table on North America - Year-over-year growth 2024-2029 (%)
- 12.5 Europe - Market size and forecast 2024-2029
- Chart on Europe - Market size and forecast 2024-2029 ($ billion)
- Data Table on Europe - Market size and forecast 2024-2029 ($ billion)
- Chart on Europe - Year-over-year growth 2024-2029 (%)
- Data Table on Europe - Year-over-year growth 2024-2029 (%)
- 12.6 South America - Market size and forecast 2024-2029
- Chart on South America - Market size and forecast 2024-2029 ($ billion)
- Data Table on South America - Market size and forecast 2024-2029 ($ billion)
- Chart on South America - Year-over-year growth 2024-2029 (%)
- Data Table on South America - Year-over-year growth 2024-2029 (%)
- 12.7 Middle East and Africa - Market size and forecast 2024-2029
- Chart on Middle East and Africa - Market size and forecast 2024-2029 ($ billion)
- Data Table on Middle East and Africa - Market size and forecast 2024-2029 ($ billion)
- Chart on Middle East and Africa - Year-over-year growth 2024-2029 (%)
- Data Table on Middle East and Africa - Year-over-year growth 2024-2029 (%)
- 12.8 China - Market size and forecast 2024-2029
- Chart on China - Market size and forecast 2024-2029 ($ billion)
- Data Table on China - Market size and forecast 2024-2029 ($ billion)
- Chart on China - Year-over-year growth 2024-2029 (%)
- Data Table on China - Year-over-year growth 2024-2029 (%)
- 12.9 US - Market size and forecast 2024-2029
- Chart on US - Market size and forecast 2024-2029 ($ billion)
- Data Table on US - Market size and forecast 2024-2029 ($ billion)
- Chart on US - Year-over-year growth 2024-2029 (%)
- Data Table on US - Year-over-year growth 2024-2029 (%)
- 12.10 Canada - Market size and forecast 2024-2029
- Chart on Canada - Market size and forecast 2024-2029 ($ billion)
- Data Table on Canada - Market size and forecast 2024-2029 ($ billion)
- Chart on Canada - Year-over-year growth 2024-2029 (%)
- Data Table on Canada - Year-over-year growth 2024-2029 (%)
- 12.11 Japan - Market size and forecast 2024-2029
- Chart on Japan - Market size and forecast 2024-2029 ($ billion)
- Data Table on Japan - Market size and forecast 2024-2029 ($ billion)
- Chart on Japan - Year-over-year growth 2024-2029 (%)
- Data Table on Japan - Year-over-year growth 2024-2029 (%)
- 12.12 India - Market size and forecast 2024-2029
- Chart on India - Market size and forecast 2024-2029 ($ billion)
- Data Table on India - Market size and forecast 2024-2029 ($ billion)
- Chart on India - Year-over-year growth 2024-2029 (%)
- Data Table on India - Year-over-year growth 2024-2029 (%)
- 12.13 South Korea - Market size and forecast 2024-2029
- Chart on South Korea - Market size and forecast 2024-2029 ($ billion)
- Data Table on South Korea - Market size and forecast 2024-2029 ($ billion)
- Chart on South Korea - Year-over-year growth 2024-2029 (%)
- Data Table on South Korea - Year-over-year growth 2024-2029 (%)
- 12.14 Germany - Market size and forecast 2024-2029
- Chart on Germany - Market size and forecast 2024-2029 ($ billion)
- Data Table on Germany - Market size and forecast 2024-2029 ($ billion)
- Chart on Germany - Year-over-year growth 2024-2029 (%)
- Data Table on Germany - Year-over-year growth 2024-2029 (%)
- 12.15 UK - Market size and forecast 2024-2029
- Chart on UK - Market size and forecast 2024-2029 ($ billion)
- Data Table on UK - Market size and forecast 2024-2029 ($ billion)
- Chart on UK - Year-over-year growth 2024-2029 (%)
- Data Table on UK - Year-over-year growth 2024-2029 (%)
- 12.16 Australia - Market size and forecast 2024-2029
- Chart on Australia - Market size and forecast 2024-2029 ($ billion)
- Data Table on Australia - Market size and forecast 2024-2029 ($ billion)
- Chart on Australia - Year-over-year growth 2024-2029 (%)
- Data Table on Australia - Year-over-year growth 2024-2029 (%)
- 12.17 France - Market size and forecast 2024-2029
- Chart on France - Market size and forecast 2024-2029 ($ billion)
- Data Table on France - Market size and forecast 2024-2029 ($ billion)
- Chart on France - Year-over-year growth 2024-2029 (%)
- Data Table on France - Year-over-year growth 2024-2029 (%)
- 12.18 Market opportunity by geography
- Market opportunity by geography ($ billion)
- Data Tables on Market opportunity by geography ($ billion)
13 Drivers, Challenges, and Opportunity/Restraints
- 13.3 Impact of drivers and challenges
- Impact of drivers and challenges in 2024 and 2029
- 13.4 Market opportunities/restraints
14 Competitive Landscape
- 14.2 Competitive Landscape
- Overview on criticality of inputs and factors of differentiation
- 14.3 Landscape disruption
- Overview on factors of disruption
- 14.4 Industry risks
- Impact of key risks on business
15 Competitive Analysis
- 15.2 Company ranking index
- 15.3 Market positioning of companies
- Matrix on companies position and classification
- 15.4 Alibaba Group Holding Ltd.
- Alibaba Group Holding Ltd. - Overview
- Alibaba Group Holding Ltd. - Business segments
- Alibaba Group Holding Ltd. - Key news
- Alibaba Group Holding Ltd. - Key offerings
- Alibaba Group Holding Ltd. - Segment focus
- SWOT
- 15.5 Amazon.com Inc.
- Amazon.com Inc. - Overview
- Amazon.com Inc. - Business segments
- Amazon.com Inc. - Key news
- Amazon.com Inc. - Key offerings
- Amazon.com Inc. - Segment focus
- SWOT
- 15.6 AP Moller Maersk AS
- AP Moller Maersk AS - Overview
- AP Moller Maersk AS - Business segments
- AP Moller Maersk AS - Key news
- AP Moller Maersk AS - Key offerings
- AP Moller Maersk AS - Segment focus
- SWOT
- 15.7 Aramex International LLC
- Aramex International LLC - Overview
- Aramex International LLC - Product / Service
- Aramex International LLC - Key news
- Aramex International LLC - Key offerings
- SWOT
- 15.8 C H Robinson Worldwide Inc.
- C H Robinson Worldwide Inc. - Overview
- C H Robinson Worldwide Inc. - Business segments
- C H Robinson Worldwide Inc. - Key news
- C H Robinson Worldwide Inc. - Key offerings
- C H Robinson Worldwide Inc. - Segment focus
- SWOT
- 15.9 CMA CGM Group
- CMA CGM Group - Overview
- CMA CGM Group - Product / Service
- CMA CGM Group - Key news
- CMA CGM Group - Key offerings
- SWOT
- 15.10 ContextLogic Inc.
- ContextLogic Inc. - Overview
- ContextLogic Inc. - Product / Service
- ContextLogic Inc. - Key offerings
- SWOT
- 15.11 Deutsche Post AG
- Deutsche Post AG - Overview
- Deutsche Post AG - Business segments
- Deutsche Post AG - Key news
- Deutsche Post AG - Key offerings
- Deutsche Post AG - Segment focus
- SWOT
- 15.12 DSV AS
- DSV AS - Overview
- DSV AS - Business segments
- DSV AS - Key offerings
- DSV AS - Segment focus
- SWOT
- 15.13 eBay Inc.
- eBay Inc. - Overview
- eBay Inc. - Product / Service
- eBay Inc. - Key offerings
- SWOT
- 15.14 FedEx Corp.
- FedEx Corp. - Overview
- FedEx Corp. - Business segments
- FedEx Corp. - Key news
- FedEx Corp. - Key offerings
- FedEx Corp. - Segment focus
- SWOT
- 15.15 JD.com Inc.
- JD.com Inc. - Overview
- JD.com Inc. - Business segments
- JD.com Inc. - Key offerings
- JD.com Inc. - Segment focus
- SWOT
- 15.16 Kuehne Nagel Management AG
- Kuehne Nagel Management AG - Overview
- Kuehne Nagel Management AG - Business segments
- Kuehne Nagel Management AG - Key news
- Kuehne Nagel Management AG - Key offerings
- Kuehne Nagel Management AG - Segment focus
- SWOT
- 15.17 United Parcel Service Inc.
- United Parcel Service Inc. - Overview
- United Parcel Service Inc. - Business segments
- United Parcel Service Inc. - Key news
- United Parcel Service Inc. - Key offerings
- United Parcel Service Inc. - Segment focus
- SWOT
- 15.18 XPO Inc.
- XPO Inc. - Overview
- XPO Inc. - Business segments
- XPO Inc. - Key news
- XPO Inc. - Key offerings
- XPO Inc. - Segment focus
- SWOT
16 Appendix
- 16.2 Inclusions and exclusions checklist
- Inclusions checklist
- Exclusions checklist
- 16.3 Currency conversion rates for US$
- Currency conversion rates for US$
- 16.4 Research methodology
- 16.7 Validation techniques employed for market sizing
- Validation techniques employed for market sizing
- 16.9 360 degree market analysis
- 360 degree market analysis
- 16.10 List of abbreviations