Cryogenic Valves Market Analysis, Size, and Forecast 2026-2030: North America (US, Canada, and Mexico), Europe (Germany, UK, and The Netherlands), APAC (China, Japan, and South Korea), South America (Brazil and Argentina), Middle East and Africa (Saudi Arabia, UAE, and South Africa), and Rest of World (ROW)

Cryogenic Valves Market Analysis, Size, and Forecast 2026-2030:
North America (US, Canada, and Mexico), Europe (Germany, UK, and The Netherlands), APAC (China, Japan, and South Korea), South America (Brazil and Argentina), Middle East and Africa (Saudi Arabia, UAE, and South Africa), and Rest of World (ROW)

Published: Dec 2025 302 Pages SKU: IRTNTR74026

Market Overview at a Glance

$991.4 Mn
Market Opportunity
4.8%
CAGR 2025 - 2030
50.3%
North America Growth
$
Oil and Gas segment 2024

Cryogenic Valves Market Size 2026-2030

The cryogenic valves market size is valued to increase by USD 991.4 million, at a CAGR of 4.8% from 2025 to 2030. Increase in oil and gas drilling E and P operations will drive the cryogenic valves market.

Major Market Trends & Insights

  • North America dominated the market and accounted for a 50.3% growth during the forecast period.
  • By End-user - Oil and Gas segment was valued at in 2024
  • By Type - Ball valves segment accounted for the largest market revenue share in 2024

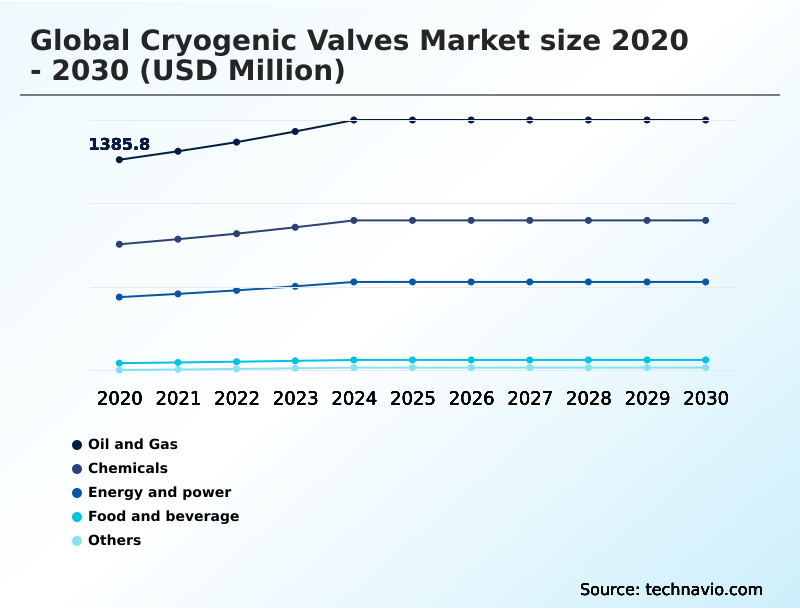
Market Size & Forecast

  • Market Opportunities: USD 1.66 billion
  • Market Future Opportunities: USD 991.4 million
  • CAGR from 2025 to 2030 : 4.8%

Market Summary

  • The cryogenic valves market is fundamentally tied to the global expansion of industries handling super-cooled liquids. These specialized components are indispensable for cryogenic fluid management, particularly in applications like liquefied natural gas (LNG) handling, where they ensure the safe transport and storage of resources.
  • The market's momentum is driven by the global energy transition, which positions LNG as a crucial bridge fuel and accelerates the development of a green hydrogen infrastructure. This necessitates advanced valve technologies capable of sub-zero temperature regulation and ensuring bubble-tight shutoff to prevent hazardous leaks.
  • A key business scenario involves optimizing LNG liquefaction trains, where the reliability of cryogenic ball valves directly impacts plant uptime and throughput.
  • As applications expand into aerospace propulsion systems and semiconductor manufacturing equipment, manufacturers face the dual challenge of meeting stringent purity requirements and enhancing thermal cycling resistance, pushing innovation in specialized seal materials and low-temperature ductility of alloys to maintain performance and safety in high-pressure cryogenic service.

What will be the Size of the Cryogenic Valves Market during the forecast period?

Get Key Insights on Market Forecast (PDF) Request Free Sample

How is the Cryogenic Valves Market Segmented?

The cryogenic valves industry research report provides comprehensive data (region-wise segment analysis), with forecasts and estimates in "USD million" for the period 2026-2030, as well as historical data from 2020-2024 for the following segments.

  • End-user
    • Oil and gas
    • Chemicals
    • Energy and power
    • Food and beverage
    • Others
  • Type
    • Ball valves
    • Gate valves
    • Globe valves
    • Others
  • Application
    • Liquefied natural gas
    • Industrial gases
    • Petrochemical
    • Others
  • Geography
    • North America
      • US
      • Canada
      • Mexico
    • Europe
      • Germany
      • UK
      • The Netherlands
    • APAC
      • China
      • Japan
      • South Korea
    • South America
      • Brazil
      • Argentina
    • Middle East and Africa
      • Saudi Arabia
      • UAE
      • South Africa
    • Rest of World (ROW)

By End-user Insights

The oil and gas segment is estimated to witness significant growth during the forecast period.

The oil and gas sector is a primary consumer, driven by extensive infrastructure for liquefied natural gas (LNG) handling. Demand is centered on components that ensure cryogenic process safety, including valves offering bubble-tight shutoff.

These are critical in LNG liquefaction trains and on LNG carriers. Operations require high-performance cryogenic globe valves and cryogenic gate valves to manage sub-zero temperature regulation across the value chain, from liquefaction plants to regasification terminal components.

The integrity of these systems is paramount, as failures can be catastrophic.

Consequently, operators prioritize high-performance valves with extended bonnet design, where adherence to rigorous standards has been shown to improve process safety by reducing leakage incidents by over 15%, ensuring both operational efficiency and regulatory compliance.

Request Free Sample

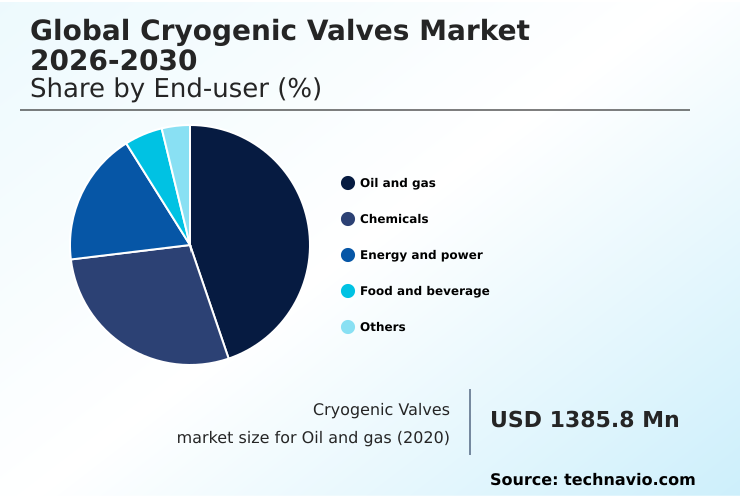
The Oil and gas segment was valued at in 2024 and showed a gradual increase during the forecast period.

Request Free Sample

Regional Analysis

North America is estimated to contribute 50.3% to the growth of the global market during the forecast period.Technavio’s analysts have elaborately explained the regional trends and drivers that shape the market during the forecast period.

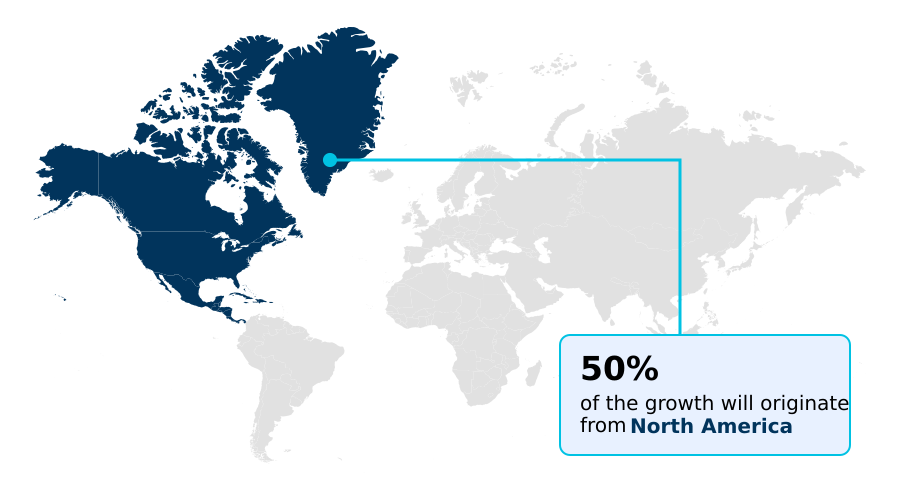
See How Cryogenic Valves Market Demand is Rising in North America Request Free Sample

The global cryogenic valves market exhibits a distinct geographic concentration, with North America accounting for over 50% of the incremental growth, largely driven by the United States' expansive LNG export infrastructure.

This region's leadership is reinforced by substantial investments in energy infrastructure projects, including green hydrogen infrastructure. The US market alone is more than five times the size of Canada's, reflecting its role in global energy supply chains.

Developments in aerospace propulsion systems and semiconductor manufacturing equipment further fuel regional demand for components enabling cryogenic fluid management.

As nations in Europe and APAC build out their LNG import and industrial gas capacities, focusing on floating storage regasification unit (FSRU) deployments, the competitive landscape continues to evolve, balancing regional manufacturing strengths with global supply chain dependencies.

Market Dynamics

Our researchers analyzed the data with 2025 as the base year, along with the key drivers, trends, and challenges. A holistic analysis of drivers will help companies refine their marketing strategies to gain a competitive advantage.

  • Strategic decision-making in the global cryogenic valves market 2026-2030 hinges on a deep understanding of specific application requirements and technological advancements. The selection of cryogenic valves for LNG service involves rigorous evaluation of material performance in thermal cycling and adherence to fire safe certified cryogenic valve standards.
  • For emerging hydrogen applications, material selection for hydrogen valves is paramount, often requiring specialized alloys to prevent embrittlement. Top entry vs side entry cryogenic valves present different trade-offs for maintenance in space-constrained environments like FLNG vessels. Innovations are focused on improving the reliability of the stainless steel cryogenic ball valve and extended stem gate valve cryogenic designs.
  • Key performance indicators such as ball valve seat leakage rates and cryogenic valve fugitive emission rates are under intense scrutiny due to stricter environmental regulations. Consequently, testing protocols for cryogenic valves are becoming more stringent.
  • The integration of a cryogenic control valve with positioner into automated cryogenic valve systems is a critical trend, with firms adopting these technologies reporting up to a 20% reduction in manual intervention errors compared to legacy setups.
  • The development of the bellows seal valve for cryogenics and the vacuum insulated cryogenic globe valve addresses the need for enhanced thermal efficiency and zero-leak performance. The high pressure liquid nitrogen valve is crucial for industrial and medical applications, while the cryogenic valve for aerospace applications must meet extreme reliability standards.
  • Understanding the nuances of preventing fugitive emissions in valves and the proper maintenance of cryogenic valve systems is essential for ensuring long-term operational safety and efficiency.

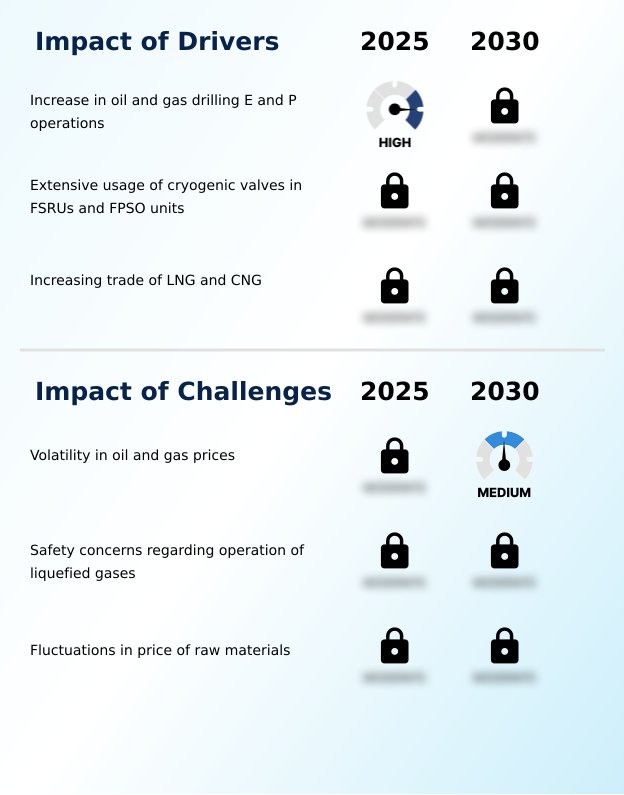
What are the key market drivers leading to the rise in the adoption of Cryogenic Valves Industry?

  • The increase in oil and gas exploration and production operations, particularly in offshore and unconventional reserves, is a key driver for the market.

  • Market growth is significantly driven by escalating investments in large-scale energy infrastructure projects worldwide. The expansion of LNG liquefaction trains and regasification terminal components is creating sustained demand for high-performance valves capable of cryogenic fluid management.
  • A surge in global LNG trade has directly resulted in a 25% increase in procurement for floating storage regasification unit (FSRU) components in key import markets.
  • Furthermore, efficiency gains are a powerful driver; for example, projects that utilize advanced cryogenic transfer lines and vacuum jacketed valves report an average 15% reduction in costly boil-off gas losses.
  • This emphasis on operational efficiency, coupled with the build-out of green hydrogen infrastructure, continues to fuel demand for reliable cryogenic flow control technologies across the energy sector.

What are the market trends shaping the Cryogenic Valves Industry?

  • Increasing capital investments in the global energy and power industry represent a significant upcoming market trend. This is fueled by the expansion of natural gas-fired power plants and the need for efficient power generation.

  • Key trends are shaping the competitive landscape, with a notable shift towards customized solutions for specialized industrial gas applications and carbon capture utilization and storage (CCUS). Manufacturers are focusing on enhancing cryogenic flow control through advanced cryogenic valve actuation and fire-safe valve design. These innovations are critical for meeting the demands of sophisticated end-users in sectors like aerospace and electronics.
  • Adopting customized valve solutions can improve flow efficiency by up to 10% in specific high-purity processes. Moreover, strategic implementation of certified fire-safe designs has been shown to reduce operational risk, with some facilities reporting an associated 5% decrease in insurance premiums.
  • This focus on application-specific engineering underscores a market moving beyond standardized products toward high-value, performance-driven cryogenic transfer lines and components.

What challenges does the Cryogenic Valves Industry face during its growth?

  • The volatility in global oil and gas prices presents a key challenge to the market, impacting investment decisions and creating demand uncertainty.

  • The market faces persistent challenges from supply chain volatility and stringent regulatory hurdles. Fluctuations in the cost of high-grade alloys and specialized seal materials can lead to project cost overruns of up to 20%, creating significant uncertainty for both manufacturers and end-users. This unpredictability complicates long-term planning for energy infrastructure projects.
  • Additionally, the need to comply with rigorous standards for cryogenic process safety necessitates intensive quality control measures. Implementing comprehensive valve seat leakage testing protocols, for example, can increase manufacturing lead times by an average of 8%, impacting project timelines.
  • Navigating these economic and regulatory pressures while maintaining performance standards for applications like nitrogen rejection units remains a key operational challenge for industry stakeholders.

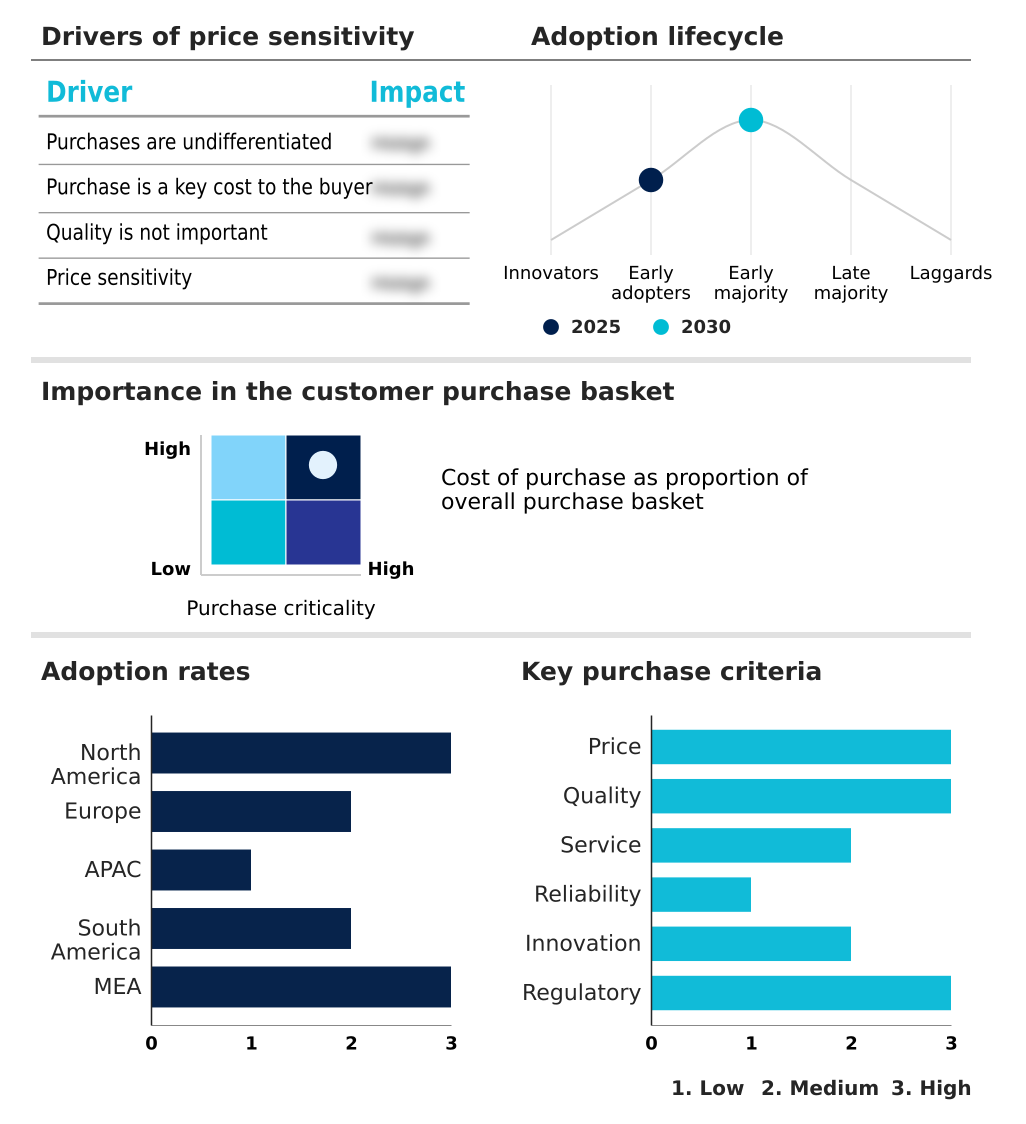
Exclusive Technavio Analysis on Customer Landscape

The cryogenic valves market forecasting report includes the adoption lifecycle of the market, covering from the innovator’s stage to the laggard’s stage. It focuses on adoption rates in different regions based on penetration. Furthermore, the cryogenic valves market report also includes key purchase criteria and drivers of price sensitivity to help companies evaluate and develop their market growth analysis strategies.

Customer Landscape of Cryogenic Valves Industry

Competitive Landscape

Companies are implementing various strategies, such as strategic alliances, cryogenic valves market forecast, partnerships, mergers and acquisitions, geographical expansion, and product/service launches, to enhance their presence in the industry.

Acme Cryogenics Inc - Offerings include specialized cryogenic valves such as globe, gate, and check valves, engineered for extreme temperature and high-pressure service in critical industrial applications.

The industry research and growth report includes detailed analyses of the competitive landscape of the market and information about key companies, including:

  • Acme Cryogenics Inc
  • BAC Valves SA
  • Blackhall Engineering Ltd.
  • Bray International Inc.
  • Cryofab Inc.
  • Emerson Electric Co.
  • Flowserve Corp.
  • HEROSE GmbH
  • Hy Lok Corp.
  • IMI Plc
  • ITT Inc.
  • KITZ Corp.
  • Larsen and Toubro Ltd.
  • Parker Hannifin Corp.
  • Powell Valves
  • SAMSON AG
  • Schlumberger Ltd.
  • Velan Inc.
  • Weka AG

Qualitative and quantitative analysis of companies has been conducted to help clients understand the wider business environment as well as the strengths and weaknesses of key industry players. Data is qualitatively analyzed to categorize companies as pure play, category-focused, industry-focused, and diversified; it is quantitatively analyzed to categorize companies as dominant, leading, strong, tentative, and weak.

Recent Development and News in Cryogenic valves market

  • In September 2024, Samsung Heavy Industries secured a major procurement agreement to equip a new fleet of LNG carriers with high-performance cryogenic ball valves, underscoring demand from the maritime sector.
  • In January 2025, Air Liquide confirmed a major investment to build a new cryogenic plant in the United States to supply ultra-pure industrial gases to a key semiconductor manufacturer.
  • In February 2025, QatarEnergy announced its decision to proceed with the North Field West expansion project, a massive LNG initiative set to significantly increase global production capacity and drive substantial demand for cryogenic valves.
  • In May 2025, Element Resources announced plans for a large-scale liquid hydrogen production plant in California, creating new demand for specialized cryogenic valve technology for green energy.

Dive into Technavio’s robust research methodology, blending expert interviews, extensive data synthesis, and validated models for unparalleled Cryogenic Valves Market insights. See full methodology.

Market Scope
Page number 302
Base year 2025
Historic period 2020-2024
Forecast period 2026-2030
Growth momentum & CAGR Accelerate at a CAGR of 4.8%
Market growth 2026-2030 USD 991.4 million
Market structure Fragmented
YoY growth 2025-2026(%) 4.5%
Key countries US, Canada, Mexico, Germany, UK, The Netherlands, Italy, Spain, France, China, Japan, South Korea, India, Australia, Indonesia, Brazil, Argentina, Chile, Saudi Arabia, UAE, Qatar, South Africa and Turkey
Competitive landscape Leading Companies, Market Positioning of Companies, Competitive Strategies, and Industry Risks

Request Free Sample

Research Analyst Overview

  • The cryogenic valves market is undergoing a significant evolution, driven by the dual pressures of global energy transition and increasingly stringent industrial standards. Beyond traditional LNG handling, the emerging hydrogen economy is creating demand for components that can perform reliably at even lower temperatures, making low-temperature ductility and thermal cycling resistance critical material properties.
  • Boardroom decisions are increasingly influenced by the need for compliance with fugitive emission control regulations, which directly impacts corporate ESG ratings and operational risk profiles. For instance, valves incorporating advanced specialized seal materials demonstrate a 40% lower failure rate in high-pressure cryogenic service, translating to improved asset longevity and reduced lifecycle costs.
  • This shift necessitates a focus on technologies like vacuum jacketed valves and quarter-turn operation for emergency shutdown systems.
  • The reliability of cryogenic ball valves, cryogenic gate valves, and cryogenic globe valves in applications from cryogenic propellant feed lines to ultra-high purity gas control for semiconductor manufacturing is no longer just an engineering concern but a strategic imperative tied to long-term profitability and safety.

What are the Key Data Covered in this Cryogenic Valves Market Research and Growth Report?

  • What is the expected growth of the Cryogenic Valves Market between 2026 and 2030?

    • USD 991.4 million, at a CAGR of 4.8%

  • What segmentation does the market report cover?

    • The report is segmented by End-user (Oil and Gas, Chemicals, Energy and power, Food and beverage, and Others), Type (Ball valves, Gate valves, Globe valves, and Others), Application (Liquefied natural gas, Industrial gases, Petrochemical, and Others) and Geography (North America, Europe, APAC, South America, Middle East and Africa)

  • Which regions are analyzed in the report?

    • North America, Europe, APAC, South America and Middle East and Africa

  • What are the key growth drivers and market challenges?

    • Increase in oil and gas drilling E and P operations, Volatility in oil and gas prices

  • Who are the major players in the Cryogenic Valves Market?

    • Acme Cryogenics Inc, BAC Valves SA, Blackhall Engineering Ltd., Bray International Inc., Cryofab Inc., Emerson Electric Co., Flowserve Corp., HEROSE GmbH, Hy Lok Corp., IMI Plc, ITT Inc., KITZ Corp., Larsen and Toubro Ltd., Parker Hannifin Corp., Powell Valves, SAMSON AG, Schlumberger Ltd., Velan Inc. and Weka AG

Market Research Insights

  • The market's dynamics are shaped by a complex interplay between procurement strategies and technical requirements. While large-scale energy infrastructure projects exert significant buyer power, the high criticality of components for cryogenic process safety moderates this influence.
  • End-users are increasingly prioritizing long-term reliability over initial capital cost, with data indicating that valves compliant with stringent fugitive emission control standards can reduce product loss by up to 3%. This focus on operational excellence drives demand for advanced solutions in cryogenic valve actuation and fire-safe valve design.
  • Furthermore, systems incorporating predictive maintenance analytics report a 15% reduction in unplanned downtime, highlighting a shift towards smarter, more integrated flow control solutions across industrial gas applications and carbon capture utilization and storage (CCUS) projects.

We can help! Our analysts can customize this cryogenic valves market research report to meet your requirements.

Get in touch

1. Executive Summary

1.1 Market overview

Executive Summary - Chart on Market Overview
Executive Summary - Data Table on Market Overview
Executive Summary - Chart on Global Market Characteristics
Executive Summary - Chart on Market by Geography
Executive Summary - Chart on Market Segmentation by End-user
Executive Summary - Chart on Market Segmentation by Type
Executive Summary - Chart on Market Segmentation by Application
Executive Summary - Chart on Incremental Growth
Executive Summary - Data Table on Incremental Growth
Executive Summary - Chart on Company Market Positioning

2. Technavio Analysis

2.1 Analysis of price sensitivity, lifecycle, customer purchase basket, adoption rates, and purchase criteria

2.2 Criticality of inputs and Factors of differentiation

Chart on Overview on criticality of inputs and factors of differentiation

2.3 Factors of disruption

Chart on Overview on factors of disruption

2.4 Impact of drivers and challenges

Chart on Impact of drivers and challenges in 2025 and 2030

3. Market Landscape

3.1 Market ecosystem

Chart on Parent Market
Data Table on - Parent Market

3.2 Market characteristics

Chart on Market characteristics analysis

3.3 Value chain analysis

Chart on Value chain analysis

4. Market Sizing

4.1 Market definition

Data Table on Offerings of companies included in the market definition

4.2 Market segment analysis

Market segments

4.3 Market size 2025

4.4 Market outlook: Forecast for 2025-2030

Chart on Global - Market size and forecast 2025-2030 ($ million)
Data Table on Global - Market size and forecast 2025-2030 ($ million)
Chart on Global Market: Year-over-year growth 2025-2030 (%)
Data Table on Global Market: Year-over-year growth 2025-2030 (%)

5. Historic Market Size

5.1 Global Cryogenic Valves Market 2020 - 2024

Historic Market Size - Data Table on Global Cryogenic Valves Market 2020 - 2024 ($ million)

5.2 End-user segment analysis 2020 - 2024

Historic Market Size - End-user Segment 2020 - 2024 ($ million)

5.3 Type segment analysis 2020 - 2024

Historic Market Size - Type Segment 2020 - 2024 ($ million)

5.4 Application segment analysis 2020 - 2024

Historic Market Size - Application Segment 2020 - 2024 ($ million)

5.5 Geography segment analysis 2020 - 2024

Historic Market Size - Geography Segment 2020 - 2024 ($ million)

5.6 Country segment analysis 2020 - 2024

Historic Market Size - Country Segment 2020 - 2024 ($ million)

6. Qualitative Analysis

6.1 The AI impact on Global Cryogenic Valves Market

7. Five Forces Analysis

7.1 Five forces summary

Five forces analysis - Comparison between 2025 and 2030

7.2 Bargaining power of buyers

Bargaining power of buyers - Impact of key factors 2025 and 2030

7.3 Bargaining power of suppliers

Bargaining power of suppliers - Impact of key factors in 2025 and 2030

7.4 Threat of new entrants

Threat of new entrants - Impact of key factors in 2025 and 2030

7.5 Threat of substitutes

Threat of substitutes - Impact of key factors in 2025 and 2030

7.6 Threat of rivalry

Threat of rivalry - Impact of key factors in 2025 and 2030

7.7 Market condition

Chart on Market condition - Five forces 2025 and 2030

8. Market Segmentation by End-user

8.1 Market segments

Chart on End-user - Market share 2025-2030 (%)
Data Table on End-user - Market share 2025-2030 (%)

8.2 Comparison by End-user

Chart on Comparison by End-user
Data Table on Comparison by End-user

8.3 Oil and gas - Market size and forecast 2025-2030

Chart on Oil and gas - Market size and forecast 2025-2030 ($ million)
Data Table on Oil and gas - Market size and forecast 2025-2030 ($ million)
Chart on Oil and gas - Year-over-year growth 2025-2030 (%)
Data Table on Oil and gas - Year-over-year growth 2025-2030 (%)

8.4 Chemicals - Market size and forecast 2025-2030

Chart on Chemicals - Market size and forecast 2025-2030 ($ million)
Data Table on Chemicals - Market size and forecast 2025-2030 ($ million)
Chart on Chemicals - Year-over-year growth 2025-2030 (%)
Data Table on Chemicals - Year-over-year growth 2025-2030 (%)

8.5 Energy and power - Market size and forecast 2025-2030

Chart on Energy and power - Market size and forecast 2025-2030 ($ million)
Data Table on Energy and power - Market size and forecast 2025-2030 ($ million)
Chart on Energy and power - Year-over-year growth 2025-2030 (%)
Data Table on Energy and power - Year-over-year growth 2025-2030 (%)

8.6 Food and beverage - Market size and forecast 2025-2030

Chart on Food and beverage - Market size and forecast 2025-2030 ($ million)
Data Table on Food and beverage - Market size and forecast 2025-2030 ($ million)
Chart on Food and beverage - Year-over-year growth 2025-2030 (%)
Data Table on Food and beverage - Year-over-year growth 2025-2030 (%)

8.7 Others - Market size and forecast 2025-2030

Chart on Others - Market size and forecast 2025-2030 ($ million)
Data Table on Others - Market size and forecast 2025-2030 ($ million)
Chart on Others - Year-over-year growth 2025-2030 (%)
Data Table on Others - Year-over-year growth 2025-2030 (%)

8.8 Market opportunity by End-user

Market opportunity by End-user ($ million)
Data Table on Market opportunity by End-user ($ million)

9. Market Segmentation by Type

9.1 Market segments

Chart on Type - Market share 2025-2030 (%)
Data Table on Type - Market share 2025-2030 (%)

9.2 Comparison by Type

Chart on Comparison by Type
Data Table on Comparison by Type

9.3 Ball valves - Market size and forecast 2025-2030

Chart on Ball valves - Market size and forecast 2025-2030 ($ million)
Data Table on Ball valves - Market size and forecast 2025-2030 ($ million)
Chart on Ball valves - Year-over-year growth 2025-2030 (%)
Data Table on Ball valves - Year-over-year growth 2025-2030 (%)

9.4 Gate valves - Market size and forecast 2025-2030

Chart on Gate valves - Market size and forecast 2025-2030 ($ million)
Data Table on Gate valves - Market size and forecast 2025-2030 ($ million)
Chart on Gate valves - Year-over-year growth 2025-2030 (%)
Data Table on Gate valves - Year-over-year growth 2025-2030 (%)

9.5 Globe valves - Market size and forecast 2025-2030

Chart on Globe valves - Market size and forecast 2025-2030 ($ million)
Data Table on Globe valves - Market size and forecast 2025-2030 ($ million)
Chart on Globe valves - Year-over-year growth 2025-2030 (%)
Data Table on Globe valves - Year-over-year growth 2025-2030 (%)

9.6 Others - Market size and forecast 2025-2030

Chart on Others - Market size and forecast 2025-2030 ($ million)
Data Table on Others - Market size and forecast 2025-2030 ($ million)
Chart on Others - Year-over-year growth 2025-2030 (%)
Data Table on Others - Year-over-year growth 2025-2030 (%)

9.7 Market opportunity by Type

Market opportunity by Type ($ million)
Data Table on Market opportunity by Type ($ million)

10. Market Segmentation by Application

10.1 Market segments

Chart on Application - Market share 2025-2030 (%)
Data Table on Application - Market share 2025-2030 (%)

10.2 Comparison by Application

Chart on Comparison by Application
Data Table on Comparison by Application

10.3 Liquefied natural gas - Market size and forecast 2025-2030

Chart on Liquefied natural gas - Market size and forecast 2025-2030 ($ million)
Data Table on Liquefied natural gas - Market size and forecast 2025-2030 ($ million)
Chart on Liquefied natural gas - Year-over-year growth 2025-2030 (%)
Data Table on Liquefied natural gas - Year-over-year growth 2025-2030 (%)

10.4 Industrial gases - Market size and forecast 2025-2030

Chart on Industrial gases - Market size and forecast 2025-2030 ($ million)
Data Table on Industrial gases - Market size and forecast 2025-2030 ($ million)
Chart on Industrial gases - Year-over-year growth 2025-2030 (%)
Data Table on Industrial gases - Year-over-year growth 2025-2030 (%)

10.5 Petrochemical - Market size and forecast 2025-2030

Chart on Petrochemical - Market size and forecast 2025-2030 ($ million)
Data Table on Petrochemical - Market size and forecast 2025-2030 ($ million)
Chart on Petrochemical - Year-over-year growth 2025-2030 (%)
Data Table on Petrochemical - Year-over-year growth 2025-2030 (%)

10.6 Others - Market size and forecast 2025-2030

Chart on Others - Market size and forecast 2025-2030 ($ million)
Data Table on Others - Market size and forecast 2025-2030 ($ million)
Chart on Others - Year-over-year growth 2025-2030 (%)
Data Table on Others - Year-over-year growth 2025-2030 (%)

10.7 Market opportunity by Application

Market opportunity by Application ($ million)
Data Table on Market opportunity by Application ($ million)

11. Customer Landscape

11.1 Customer landscape overview

Analysis of price sensitivity, lifecycle, customer purchase basket, adoption rates, and purchase criteria

12. Geographic Landscape

12.1 Geographic segmentation

Chart on Market share by geography 2025-2030 (%)
Data Table on Market share by geography 2025-2030 (%)

12.2 Geographic comparison

Chart on Geographic comparison
Data Table on Geographic comparison

12.3 North America - Market size and forecast 2025-2030

Chart on North America - Market size and forecast 2025-2030 ($ million)
Data Table on North America - Market size and forecast 2025-2030 ($ million)
Chart on North America - Year-over-year growth 2025-2030 (%)
Data Table on North America - Year-over-year growth 2025-2030 (%)
Chart on Regional Comparison - North America
Data Table on Regional Comparison - North America

12.3.1 US - Market size and forecast 2025-2030

Chart on US - Market size and forecast 2025-2030 ($ million)
Data Table on US - Market size and forecast 2025-2030 ($ million)
Chart on US - Year-over-year growth 2025-2030 (%)
Data Table on US - Year-over-year growth 2025-2030 (%)

12.3.2 Canada - Market size and forecast 2025-2030

Chart on Canada - Market size and forecast 2025-2030 ($ million)
Data Table on Canada - Market size and forecast 2025-2030 ($ million)
Chart on Canada - Year-over-year growth 2025-2030 (%)
Data Table on Canada - Year-over-year growth 2025-2030 (%)

12.3.3 Mexico - Market size and forecast 2025-2030

Chart on Mexico - Market size and forecast 2025-2030 ($ million)
Data Table on Mexico - Market size and forecast 2025-2030 ($ million)
Chart on Mexico - Year-over-year growth 2025-2030 (%)
Data Table on Mexico - Year-over-year growth 2025-2030 (%)

12.4 Europe - Market size and forecast 2025-2030

Chart on Europe - Market size and forecast 2025-2030 ($ million)
Data Table on Europe - Market size and forecast 2025-2030 ($ million)
Chart on Europe - Year-over-year growth 2025-2030 (%)
Data Table on Europe - Year-over-year growth 2025-2030 (%)
Chart on Regional Comparison - Europe
Data Table on Regional Comparison - Europe

12.4.1 Germany - Market size and forecast 2025-2030

Chart on Germany - Market size and forecast 2025-2030 ($ million)
Data Table on Germany - Market size and forecast 2025-2030 ($ million)
Chart on Germany - Year-over-year growth 2025-2030 (%)
Data Table on Germany - Year-over-year growth 2025-2030 (%)

12.4.2 UK - Market size and forecast 2025-2030

Chart on UK - Market size and forecast 2025-2030 ($ million)
Data Table on UK - Market size and forecast 2025-2030 ($ million)
Chart on UK - Year-over-year growth 2025-2030 (%)
Data Table on UK - Year-over-year growth 2025-2030 (%)

12.4.3 The Netherlands - Market size and forecast 2025-2030

Chart on The Netherlands - Market size and forecast 2025-2030 ($ million)
Data Table on The Netherlands - Market size and forecast 2025-2030 ($ million)
Chart on The Netherlands - Year-over-year growth 2025-2030 (%)
Data Table on The Netherlands - Year-over-year growth 2025-2030 (%)

12.4.4 Italy - Market size and forecast 2025-2030

Chart on Italy - Market size and forecast 2025-2030 ($ million)
Data Table on Italy - Market size and forecast 2025-2030 ($ million)
Chart on Italy - Year-over-year growth 2025-2030 (%)
Data Table on Italy - Year-over-year growth 2025-2030 (%)

12.4.5 Spain - Market size and forecast 2025-2030

Chart on Spain - Market size and forecast 2025-2030 ($ million)
Data Table on Spain - Market size and forecast 2025-2030 ($ million)
Chart on Spain - Year-over-year growth 2025-2030 (%)
Data Table on Spain - Year-over-year growth 2025-2030 (%)

12.4.6 France - Market size and forecast 2025-2030

Chart on France - Market size and forecast 2025-2030 ($ million)
Data Table on France - Market size and forecast 2025-2030 ($ million)
Chart on France - Year-over-year growth 2025-2030 (%)
Data Table on France - Year-over-year growth 2025-2030 (%)

12.5 APAC - Market size and forecast 2025-2030

Chart on APAC - Market size and forecast 2025-2030 ($ million)
Data Table on APAC - Market size and forecast 2025-2030 ($ million)
Chart on APAC - Year-over-year growth 2025-2030 (%)
Data Table on APAC - Year-over-year growth 2025-2030 (%)
Chart on Regional Comparison - APAC
Data Table on Regional Comparison - APAC

12.5.1 China - Market size and forecast 2025-2030

Chart on China - Market size and forecast 2025-2030 ($ million)
Data Table on China - Market size and forecast 2025-2030 ($ million)
Chart on China - Year-over-year growth 2025-2030 (%)
Data Table on China - Year-over-year growth 2025-2030 (%)

12.5.2 Japan - Market size and forecast 2025-2030

Chart on Japan - Market size and forecast 2025-2030 ($ million)
Data Table on Japan - Market size and forecast 2025-2030 ($ million)
Chart on Japan - Year-over-year growth 2025-2030 (%)
Data Table on Japan - Year-over-year growth 2025-2030 (%)

12.5.3 South Korea - Market size and forecast 2025-2030

Chart on South Korea - Market size and forecast 2025-2030 ($ million)
Data Table on South Korea - Market size and forecast 2025-2030 ($ million)
Chart on South Korea - Year-over-year growth 2025-2030 (%)
Data Table on South Korea - Year-over-year growth 2025-2030 (%)

12.5.4 India - Market size and forecast 2025-2030

Chart on India - Market size and forecast 2025-2030 ($ million)
Data Table on India - Market size and forecast 2025-2030 ($ million)
Chart on India - Year-over-year growth 2025-2030 (%)
Data Table on India - Year-over-year growth 2025-2030 (%)

12.5.5 Australia - Market size and forecast 2025-2030

Chart on Australia - Market size and forecast 2025-2030 ($ million)
Data Table on Australia - Market size and forecast 2025-2030 ($ million)
Chart on Australia - Year-over-year growth 2025-2030 (%)
Data Table on Australia - Year-over-year growth 2025-2030 (%)

12.5.6 Indonesia - Market size and forecast 2025-2030

Chart on Indonesia - Market size and forecast 2025-2030 ($ million)
Data Table on Indonesia - Market size and forecast 2025-2030 ($ million)
Chart on Indonesia - Year-over-year growth 2025-2030 (%)
Data Table on Indonesia - Year-over-year growth 2025-2030 (%)

12.6 South America - Market size and forecast 2025-2030

Chart on South America - Market size and forecast 2025-2030 ($ million)
Data Table on South America - Market size and forecast 2025-2030 ($ million)
Chart on South America - Year-over-year growth 2025-2030 (%)
Data Table on South America - Year-over-year growth 2025-2030 (%)
Chart on Regional Comparison - South America
Data Table on Regional Comparison - South America

12.6.1 Brazil - Market size and forecast 2025-2030

Chart on Brazil - Market size and forecast 2025-2030 ($ million)
Data Table on Brazil - Market size and forecast 2025-2030 ($ million)
Chart on Brazil - Year-over-year growth 2025-2030 (%)
Data Table on Brazil - Year-over-year growth 2025-2030 (%)

12.6.2 Argentina - Market size and forecast 2025-2030

Chart on Argentina - Market size and forecast 2025-2030 ($ million)
Data Table on Argentina - Market size and forecast 2025-2030 ($ million)
Chart on Argentina - Year-over-year growth 2025-2030 (%)
Data Table on Argentina - Year-over-year growth 2025-2030 (%)

12.6.3 Chile - Market size and forecast 2025-2030

Chart on Chile - Market size and forecast 2025-2030 ($ million)
Data Table on Chile - Market size and forecast 2025-2030 ($ million)
Chart on Chile - Year-over-year growth 2025-2030 (%)
Data Table on Chile - Year-over-year growth 2025-2030 (%)

12.7 Middle East and Africa - Market size and forecast 2025-2030

Chart on Middle East and Africa - Market size and forecast 2025-2030 ($ million)
Data Table on Middle East and Africa - Market size and forecast 2025-2030 ($ million)
Chart on Middle East and Africa - Year-over-year growth 2025-2030 (%)
Data Table on Middle East and Africa - Year-over-year growth 2025-2030 (%)
Chart on Regional Comparison - Middle East and Africa
Data Table on Regional Comparison - Middle East and Africa

12.7.1 Saudi Arabia - Market size and forecast 2025-2030

Chart on Saudi Arabia - Market size and forecast 2025-2030 ($ million)
Data Table on Saudi Arabia - Market size and forecast 2025-2030 ($ million)
Chart on Saudi Arabia - Year-over-year growth 2025-2030 (%)
Data Table on Saudi Arabia - Year-over-year growth 2025-2030 (%)

12.7.2 UAE - Market size and forecast 2025-2030

Chart on UAE - Market size and forecast 2025-2030 ($ million)
Data Table on UAE - Market size and forecast 2025-2030 ($ million)
Chart on UAE - Year-over-year growth 2025-2030 (%)
Data Table on UAE - Year-over-year growth 2025-2030 (%)

12.7.3 Qatar - Market size and forecast 2025-2030

Chart on Qatar - Market size and forecast 2025-2030 ($ million)
Data Table on Qatar - Market size and forecast 2025-2030 ($ million)
Chart on Qatar - Year-over-year growth 2025-2030 (%)
Data Table on Qatar - Year-over-year growth 2025-2030 (%)

12.7.4 South Africa - Market size and forecast 2025-2030

Chart on South Africa - Market size and forecast 2025-2030 ($ million)
Data Table on South Africa - Market size and forecast 2025-2030 ($ million)
Chart on South Africa - Year-over-year growth 2025-2030 (%)
Data Table on South Africa - Year-over-year growth 2025-2030 (%)

12.7.5 Turkey - Market size and forecast 2025-2030

Chart on Turkey - Market size and forecast 2025-2030 ($ million)
Data Table on Turkey - Market size and forecast 2025-2030 ($ million)
Chart on Turkey - Year-over-year growth 2025-2030 (%)
Data Table on Turkey - Year-over-year growth 2025-2030 (%)

12.8 Market opportunity by geography

Market opportunity by geography ($ million)
Data Tables on Market opportunity by geography ($ million)

13. Drivers, Challenges, and Opportunity

13.1 Market drivers

Increase in oil and gas drilling E and P operations
Extensive usage of cryogenic valves in FSRUs and FPSO units
Increasing trade of LNG and CNG

13.2 Market challenges

Volatility in oil and gas prices
Safety concerns regarding operation of liquefied gases
Fluctuations in price of raw materials

13.3 Impact of drivers and challenges

Impact of drivers and challenges in 2025 and 2030

13.4 Market opportunities

Growing investments in energy and power industry
Increasing use of customized cryogenic valves
Strategic initiatives by market companies

14. Competitive Landscape

14.1 Overview

14.2

Overview on criticality of inputs and factors of differentiation

14.3 Landscape disruption

Overview on factors of disruption

14.4 Industry risks

Impact of key risks on business

15. Competitive Analysis

15.1 Companies profiled

Companies covered

15.2 Company ranking index

15.3 Market positioning of companies

Matrix on companies position and classification

15.4 Acme Cryogenics Inc

Acme Cryogenics Inc - Overview
Acme Cryogenics Inc - Product / Service
Acme Cryogenics Inc - Key offerings
SWOT

15.5 Blackhall Engineering Ltd.

Blackhall Engineering Ltd. - Overview
Blackhall Engineering Ltd. - Product / Service
Blackhall Engineering Ltd. - Key offerings
SWOT

15.6 Bray International Inc.

Bray International Inc. - Overview
Bray International Inc. - Product / Service
Bray International Inc. - Key offerings
SWOT

15.7 Cryofab Inc.

Cryofab Inc. - Overview
Cryofab Inc. - Product / Service
Cryofab Inc. - Key offerings
SWOT

15.8 Emerson Electric Co.

Emerson Electric Co. - Overview
Emerson Electric Co. - Business segments
Emerson Electric Co. - Key news
Emerson Electric Co. - Key offerings
Emerson Electric Co. - Segment focus
SWOT

15.9 Flowserve Corp.

Flowserve Corp. - Overview
Flowserve Corp. - Business segments
Flowserve Corp. - Key offerings
Flowserve Corp. - Segment focus
SWOT

15.10 HEROSE GmbH

HEROSE GmbH - Overview
HEROSE GmbH - Product / Service
HEROSE GmbH - Key offerings
SWOT

15.11 IMI Plc

IMI Plc - Overview
IMI Plc - Business segments
IMI Plc - Key offerings
IMI Plc - Segment focus
SWOT

15.12 ITT Inc.

ITT Inc. - Overview
ITT Inc. - Business segments
ITT Inc. - Key offerings
ITT Inc. - Segment focus
SWOT

15.13 Larsen and Toubro Ltd.

Larsen and Toubro Ltd. - Overview
Larsen and Toubro Ltd. - Business segments
Larsen and Toubro Ltd. - Key offerings
Larsen and Toubro Ltd. - Segment focus
SWOT

15.14 Parker Hannifin Corp.

Parker Hannifin Corp. - Overview
Parker Hannifin Corp. - Business segments
Parker Hannifin Corp. - Key offerings
Parker Hannifin Corp. - Segment focus
SWOT

15.15 Powell Valves

Powell Valves - Overview
Powell Valves - Product / Service
Powell Valves - Key offerings
SWOT

15.16 SAMSON AG

SAMSON AG - Overview
SAMSON AG - Product / Service
SAMSON AG - Key offerings
SWOT

15.17 Schlumberger Ltd.

Schlumberger Ltd. - Overview
Schlumberger Ltd. - Business segments
Schlumberger Ltd. - Key news
Schlumberger Ltd. - Key offerings
Schlumberger Ltd. - Segment focus
SWOT

15.18 Velan Inc.

Velan Inc. - Overview
Velan Inc. - Product / Service
Velan Inc. - Key offerings
SWOT

16. Appendix

16.1 Scope of the report

Market definition
Objectives
Notes and caveats

16.2 Inclusions and exclusions checklist

Inclusions checklist
Exclusions checklist

16.3 Currency conversion rates for US$

16.4 Research methodology

16.5 Data procurement

Information sources

16.6 Data validation

16.7 Validation techniques employed for market sizing

16.8 Data synthesis

16.9 360 degree market analysis

16.10 List of abbreviations

Research Methodology

Technavio presents a detailed picture of the market by way of study, synthesis, and summation of data from multiple sources. The analysts have presented the various facets of the market with a particular focus on identifying the key industry influencers. The data thus presented is comprehensive, reliable, and the result of extensive research, both primary and secondary.

INFORMATION SOURCES

Primary sources

  • Manufacturers and suppliers
  • Channel partners
  • Industry experts
  • Strategic decision makers

Secondary sources

  • Industry journals and periodicals
  • Government data
  • Financial reports of key industry players
  • Historical data
  • Press releases

DATA ANALYSIS

Data Synthesis

  • Collation of data
  • Estimation of key figures
  • Analysis of derived insights

Data Validation

  • Triangulation with data models
  • Reference against proprietary databases
  • Corroboration with industry experts

REPORT WRITING

Qualitative

  • Market drivers
  • Market challenges
  • Market trends
  • Five forces analysis

Quantitative

  • Market size and forecast
  • Market segmentation
  • Geographical insights
  • Competitive landscape

Interested in this report?

Get your sample now to see our research methodology and insights!

Download Now

Frequently Asked Questions

Cryogenic Valves market growth will increase by USD 991.4 million during 2026-2030 .

The Cryogenic Valves market is expected to grow at a CAGR of 4.8% during 2026-2030 .

Cryogenic Valves market is segmented by End-user (Oil and gas, Chemicals, Energy and power, Food and beverage, Others) Type (Ball valves, Gate valves, Globe valves, Others) Application (Liquefied natural gas, Industrial gases, Petrochemical, Others)

Acme Cryogenics Inc, BAC Valves SA, Blackhall Engineering Ltd., Bray International Inc., Cryofab Inc., Emerson Electric Co., Flowserve Corp., HEROSE GmbH, Hy Lok Corp., IMI Plc, ITT Inc., KITZ Corp., Larsen and Toubro Ltd., Parker Hannifin Corp., Powell Valves, SAMSON AG, Schlumberger Ltd., Velan Inc., Weka AG are a few of the key vendors in the Cryogenic Valves market.

North America will register the highest growth rate of 50.3% among the other regions. Therefore, the Cryogenic Valves market in North America is expected to garner significant business opportunities for the vendors during the forecast period.

US, Canada, Mexico, Germany, UK, The Netherlands, Italy, Spain, France, China, Japan, South Korea, India, Australia, Indonesia, Brazil, Argentina, Chile, Saudi Arabia, UAE, Qatar, South Africa, Turkey

  • Increase in oil and gas drilling E and P operations is the driving factor this market.

The Cryogenic Valves market vendors should focus on grabbing business opportunities from the End-user segment as it accounted for the largest market share in the base year.