High Purity Gas Market Size 2025-2029
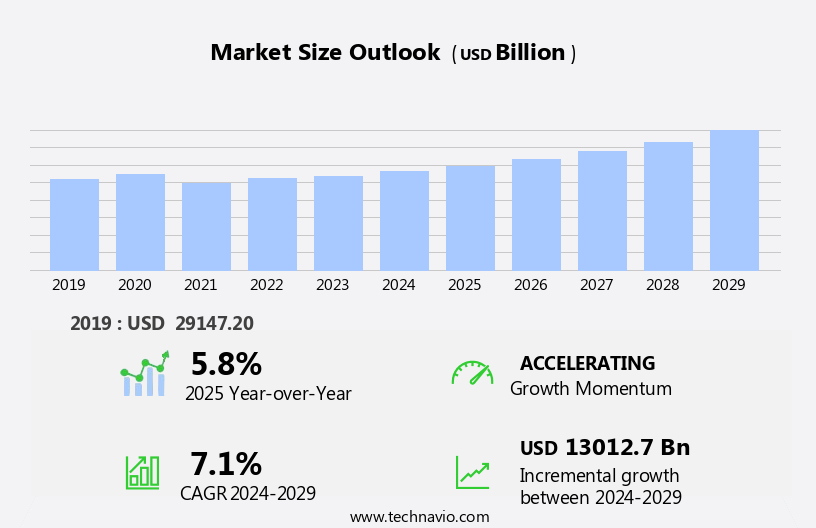
The high purity gas market size is forecast to increase by USD 13.01 billion at a CAGR of 7.1% between 2024 and 2029.
- The market is driven by the increasing demand for specialty gases, such as neon, high purity nitrogen, high purity hydrogen, and high purity oxygen, in various industries, including illumination, insulation, and chemical reactions. Sustainability goals are also fueling market growth, as industries seek to reduce greenhouse gas emissions and increase the use of renewable energy sources. Innovations in air separation technology, which is used to extract these gases, are enabling the production of ultra-high purity gases with even greater efficiency and consistency.
- However, the high cost of producing and transporting these gases remains a significant challenge for market growth. Producers must continue to invest in research and development to improve production processes and reduce costs while maintaining the highest standards of purity. This will be crucial for remaining competitive in the market and meeting the evolving needs of industries that rely on high purity gases for their operations.
What will be the Size of the Market During the Forecast Period?
- The market encompasses the production and supply of gases with minimal impurities, primarily used in various industries such as electronics, metal production, and renewable energy. These gases include atmospheric gases like nitrogen, oxygen, and argon, as well as noble gases such as helium, neon, krypton, and xenon, and reactive gases like hydrogen, fluorine, chlorine, and bromine. High purity gases are essential in numerous applications, including the production of Indium Tin Oxide (ITO) for electronics, solar photovoltaic (PV) production, and cryogenic rocket propellants. In the electronics industry, high purity gases are used to create a clean environment for semiconductor manufacturing, ensuring the production of high-quality electronic devices. In metal production, these gases serve as shielding or reducing agents, enabling the production of metals with superior properties. In the renewable energy sector, high purity gases play a crucial role in solar power and wind power generation. Solar cells require high purity gases like silane, phosphine, and diborane for their fabrication.
- Hydrogen fuel cells, another essential component of the renewable energy landscape, utilize high purity hydrogen gas for efficient electricity generation. Quality yield is a significant concern in the market, as even trace amounts of impurities can significantly impact the performance and reliability of end products. Producers of high purity gases employ advanced technologies and stringent quality control measures to ensure the delivery of gases with the lowest possible impurity levels. The demand for high purity gases is driven by the increasing adoption of advanced technologies and the growing emphasis on energy efficiency and environmental sustainability. As industries continue to innovate and push the boundaries of technology, the need for high purity gases will remain a constant requirement. In conclusion, the market plays a vital role in enabling various industries to produce high-quality products and contribute to a more sustainable future. With stringent quality control measures and continuous advancements in production technologies, the market is poised for continued growth and innovation.
How is this market segmented and which is the largest segment?
The market research report provides comprehensive data (region-wise segment analysis), with forecasts and estimates in "USD billion" for the period 2025-2029, as well as historical data from 2019-2023 for the following segments.
- Type
- Noble gas
- Carbon gas
- Others
- End-user
- Electronics
- Healthcare
- Others
- Geography
- APAC
- China
- India
- Japan
- South Korea
- North America
- Canada
- US
- Europe
- Germany
- UK
- France
- Italy
- South America
- Middle East and Africa
- APAC
By Type Insights
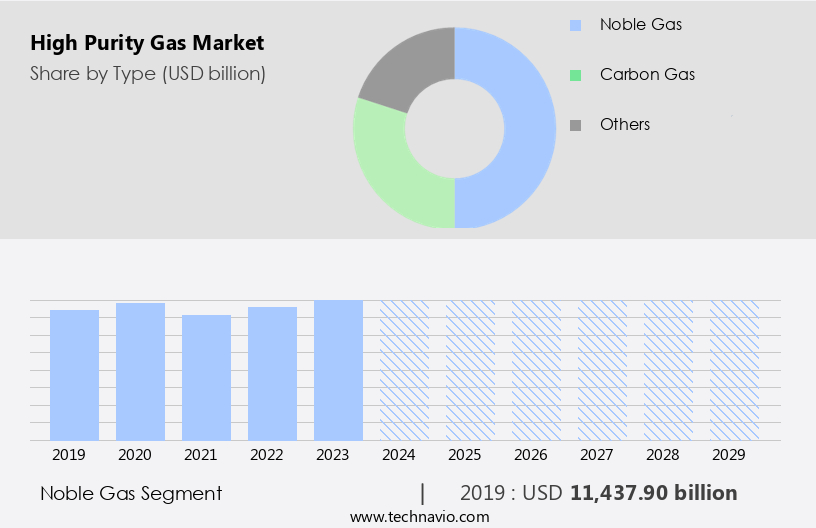
- The noble gas segment is estimated to witness significant growth during the forecast period.
The market encompasses various types of gases, with noble gases holding significant importance due to their distinctive characteristics and wide-ranging uses. Helium, for instance, is a key noble gas with extensive applications, particularly in cryogenics. In this field, it is employed to cool superconducting magnets in Magnetic Resonance Imaging (MRI) machines, requiring high purity forms for optimal performance.
Further, the scientific research and aerospace industries also heavily rely on high purity helium for fuel tank purging and pressurization. Another notable noble gas is neon, which finds extensive use in high purity applications. Its most common use is in neon signs and high-voltage indicators. However, its applications extend beyond illumination, as it is also used as a coolant in cryogenic freezers and other specialized uses. The demand for high purity neon is fueled by its efficiency and dependability in these applications. Hence, such factors are fuelling the growth of this segment during the forecast period.
Get a glance at the market report of share of various segments Request Free Sample
The noble gas segment was valued at USD 13.30 billion in 2019 and showed a gradual increase during the forecast period.
Regional Analysis
- North America is estimated to contribute 42% to the growth of the global market during the forecast period.
Technavio's analysts have elaborately explained the regional trends and drivers that shape the market during the forecast period.

For more insights on the market share of various regions Request Free Sample
The Asia Pacific region is experiencing substantial growth in the market due to increased investments and technological advancements, particularly in the clean energy sector. In September 2024, the Indian state of Uttar Pradesh attracted USD 13.69 billion in private investment proposals for the green hydrogen sector. This investment tide is expected to significantly advance the state's clean energy initiatives. Notably, Trafalgar Square Capital, a UK-based company, intends to build a green hydrogen production facility near Lucknow, India, with an annual capacity of 10,000 tons. Uttar Pradesh has ambitious goals, aiming to produce one million tons of green hydrogen or green ammonia annually by 2029.
Further, high purity gases such as noble gases, ultra-high purity carbon gas, and impurities-free gases like fluorine, chlorine, and bromine are essential components in various industries, including consumer electronics and smart appliances. Ensuring high quality yield is crucial in these applications to maintain product performance and reliability. The market is expected to continue growing as the demand for clean energy technologies increases.
Market Dynamics
Our researchers analyzed the data with 2024 as the base year, along with the key drivers, trends, and challenges. A holistic analysis of drivers will help companies refine their marketing strategies to gain a competitive advantage.
What are the key market drivers leading to the rise in adoption of High Purity Gas Market?
Sustainability goals are the key drivers of the market.
- The market is experiencing significant growth due to the increasing emphasis on sustainability and the reduction of greenhouse gas emissions. By preventing these emissions from being released into the atmosphere, ZeCarb plays a vital role in mitigating climate change and supporting industries in their shift towards more sustainable practices. This innovation is made possible through advanced purification processes, including air separation units, pressure swing adsorption, cryogenic distillation, and membrane separation.
- Additionally, these specialized machines are essential in producing high purity gases used in various applications, such as electronic components manufacturing in clean rooms, fuel cell technology for electric vehicles, and biotechnology research. The chemical industry, in particular, benefits significantly from high purity gases, as they are crucial in various production processes. Fuel cell technology and electric vehicles are also major consumers of high purity gases, as they require hydrogen for operation. The increasing adoption of these technologies is expected to drive the growth of the market.
What are the market trends shaping the High Purity Gas Market?
Innovations in extraction processes are the upcoming trends in the market.
- The market is experiencing notable progress, specifically in the area of extracting essential gases like helium and hydrogen. In January 2024, the US unveiled groundbreaking techniques to tackle its helium deficiency by isolating helium from flare gases. This development is significant because it employs modular, widely accessible technology, commonly utilized in oil production and other industries.
- The core innovation encompasses the sequential extraction of gases and the integration of closed-loop processes. These techniques boost gas extraction efficiency and capture valuable by-products from flared surface gas, diverging from conventional methods that prioritize maximizing resources and minimizing waste.
What challenges does High Purity Gas Market face during the growth?
The high cost of high purity gases is a key challenge affecting the market growth.
- The market is experiencing notable challenges due to rising costs for gases such as helium and argon. According to recent reports, the price of helium has seen a substantial increase, jumping from USD 7.57 per cubic meter in 2020 to an unprecedented USD 14 per cubic meter in 2023. This significant price hike, as reported by the US Geological Survey, underscores the market's vulnerability to supply disruptions. With a limited number of helium sources, any interruption, be it a plant shutdown or geopolitical conflict, can result in sudden shortages and further price escalations. Similarly, the cost of hydrogen gas has also risen substantially.
- Nanotechnology, automation, green technologies, semiconductor production, artificial intelligence (AI), and the Internet of Things (IoT) are some industries heavily reliant on high purity gases, particularly noble gases like helium and argon. The integration of 5G technology is further expected to increase the demand for these gases. However, the escalating costs pose a significant challenge to these industries. To mitigate these challenges, market players are exploring innovative solutions, such as the development of alternative sources and improved production methods. Green technologies, for instance, are gaining popularity as they offer a more sustainable and cost-effective alternative to traditional methods. Additionally, the integration of AI and IoT in gas production and distribution processes is expected to enhance efficiency and reduce costs.
Exclusive Customer Landscape
The market forecasting report includes the adoption lifecycle of the market, covering from the innovator's stage to the laggard's stage. It focuses on adoption rates in different regions based on penetration. Furthermore, the market report also includes key purchase criteria and drivers of price sensitivity to help companies evaluate and develop their market growth analysis strategies.

Customer Landscape
Key Companies & Market Insights
Companies are implementing various strategies, such as strategic alliances, market forecast, partnerships, mergers and acquisitions, geographical expansion, and product/service launches, to enhance their presence in the market.
The market research and growth report includes detailed analyses of the competitive landscape of the market and information about key companies, including:
Air Liquide: The company offers high purity gas for use in research applications, chemical processes, and other uses.
- Air Liquide
- Ballard Power Systems Inc.
- BASF SE
- Buzwair Industrial Gases Factories
- Chengdu Taiyu Industrial Gases Co. Ltd.
- Ellenbarrie Industrial Gases Ltd.
- GCE Holding AB
- Iwatani Corp.
- Linde Plc
- Matheson TRI Gas Inc.
- Mesa Specialty Gases and Equipment
- Messer SE and Co. KGaA
- Resonac Holdings Corp.
- RIGAS
- SOL India Pvt Ltd.
Qualitative and quantitative analysis of companies has been conducted to help clients understand the wider business environment as well as the strengths and weaknesses of key market players. Data is qualitatively analyzed to categorize companies as pure play, category-focused, industry-focused, and diversified; it is quantitatively analyzed to categorize companies as dominant, leading, strong, tentative, and weak.
Research Analyst Overview
High purity gas is a vital component in various industries, including consumer electronics, semiconductor production, and healthcare. Impurities in these gases can significantly impact the quality yield, leading to lower efficiency and increased costs. Ultra-high purity gas, with a purity level of 99.999%, is essential for specialized applications such as clean rooms and specialized machines. Atmospheric gases like nitrogen, oxygen, and carbon dioxide undergo purification processes, such as pressure swing adsorption, cryogenic distillation, and membrane separation, to produce high purity gases. Noble gases, including helium, argon, neon, krypton, and xenon, are used for insulation, illumination, and as coolants in various applications.
However, the demand for high purity gases is driven by the growing adoption of advanced technologies such as fuel cell technology, electric vehicles, biotechnology, nanotechnology, automation, green technologies, and AI. These industries require high purity gases for various applications, from insulation in semiconductor production to cryogenic rocket propellants and cooling agents in energy and power generation. High purity nitrogen, hydrogen, and oxygen are used extensively in the electronics industry for the production of Indium Tin Oxide (ITO), solar PV production, and LED fabrication. The healthcare industry uses high purity gases in MRI machines and clean room environments. The demand for these gases is expected to grow as the adoption of renewable sources of energy, such as solar power and wind power, increases.
Additionally, carbon gases, on the other hand, contribute to greenhouse gas emissions and have a significant carbon footprint. The focus on reducing carbon emissions and carbon gases has led to the development of carbon capture, utilization, and storage technologies. The stable pricing of noble gases, such as neon, is a significant factor driving their demand in various applications. In conclusion, the market is a dynamic and growing industry, driven by the increasing adoption of advanced technologies and the need for high-quality gases in various industries. The demand for high purity gases is expected to continue to grow as the world transitions to a more sustainable and technologically advanced future.
|
Market Scope |
|
|
Report Coverage |
Details |
|
Page number |
209 |
|
Base year |
2024 |
|
Historic period |
2019-2023 |
|
Forecast period |
2025-2029 |
|
Growth momentum & CAGR |
Accelerate at a CAGR of 7.1% |
|
Market growth 2025-2029 |
USD 13.01 billion |
|
Market structure |
Fragmented |
|
YoY growth 2024-2025(%) |
6.9 |
|
Key countries |
China, US, Japan, Germany, Canada, France, UK, South Korea, India, and Italy |
|
Competitive landscape |
Leading Companies, Market Positioning of Companies, Competitive Strategies, and Industry Risks |
What are the Key Data Covered in this Market Research and Growth Report?
- CAGR of the market during the forecast period
- Detailed information on factors that will drive the market growth and forecasting between 2025 and 2029
- Precise estimation of the size of the market and its contribution of the market in focus to the parent market
- Accurate predictions about upcoming market growth and trends and changes in consumer behaviour
- Growth of the market across APAC, North America, Europe, South America, and Middle East and Africa
- Thorough analysis of the market's competitive landscape and detailed information about companies
- Comprehensive analysis of factors that will challenge the growth of market companies
We can help! Our analysts can customize this market research report to meet your requirements. Get in touch
 RIA -
RIA - 
