Current Transformer Market Size 2025-2029
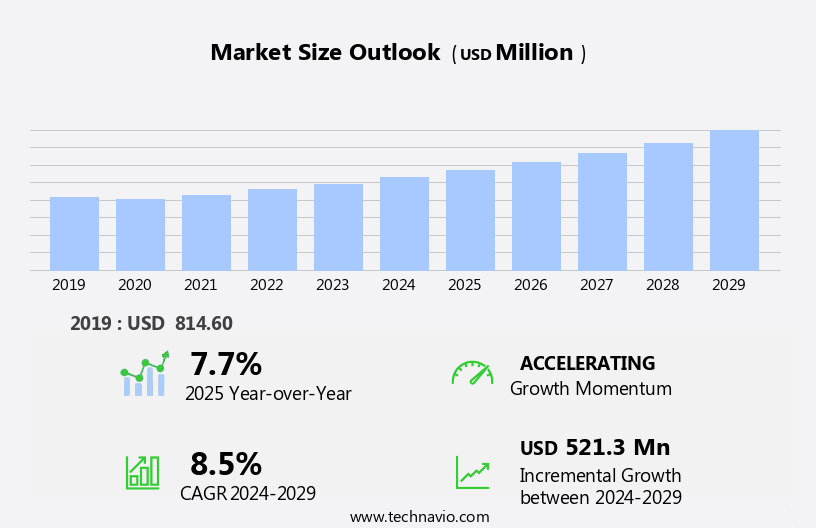
The current transformer market size is forecast to increase by USD 521.3 million at a CAGR of 8.5% between 2024 and 2029.
- The market is witnessing significant growth due to the increasing adoption of electrical equipment in various industries and the integration of renewable energy sources, such as solar power, into the electrical grid. A key trend In the market is the use of smart grids, which require highly accurate current measurements. Current transformers play a crucial role in this regard, providing enhanced accuracy at extremely low current levels. Another trend is the utilization of auxiliary current transformers to improve the overall efficiency and reliability of electrical systems. However, the high cost of upgrading electricity distribution networks remains a major challenge for market growth. In summary, the market is poised for expansion due to the growing demand for electrical equipment and the integration of renewable energy sources into the power grid, with smart grids and auxiliary current transformers driving market growth. Despite these opportunities, the high cost of network upgrades remains a significant challenge.
What will be the Size of the Market During the Forecast Period?
- The market experiences steady growth, driven by the increasing demand for electricity in urbanizing areas and the expansion of power systems worldwide. These play a crucial role in the measurement, monitoring, protection, and control of electrical currents in power transmission and distribution networks. Utilities rely on these transformers to ensure grid reliability, facilitate the integration of renewable energy sources such as solar power, and improve power quality. Smart grids and digital control systems are major trends In the power industry, driving the demand for advanced current transformers capable of providing real-time data, load monitoring, fault detection, power quality analysis, and cooling technologies.
- Oil immersed transformers, while still prevalent, face challenges due to concerns over leakage and health hazards. Overall, the market is expected to continue growing, driven by the need for efficient, reliable, and intelligent power transmission and distribution solutions.
How is this Industry segmented and which is the largest segment?
The industry research report provides comprehensive data (region-wise segment analysis), with forecasts and estimates in "USD million" for the period 2025-2029, as well as historical data from 2019-2023 for the following segments.
- Type
- Oil immersed
- Dry type
- Application
- Switchgear
- Power transformers
- Usage
- Indoor
- Outdoor
- Geography
- APAC
- China
- India
- Japan
- South Korea
- North America
- Canada
- US
- Europe
- Germany
- UK
- France
- Italy
- Middle East and Africa
- South America
- APAC
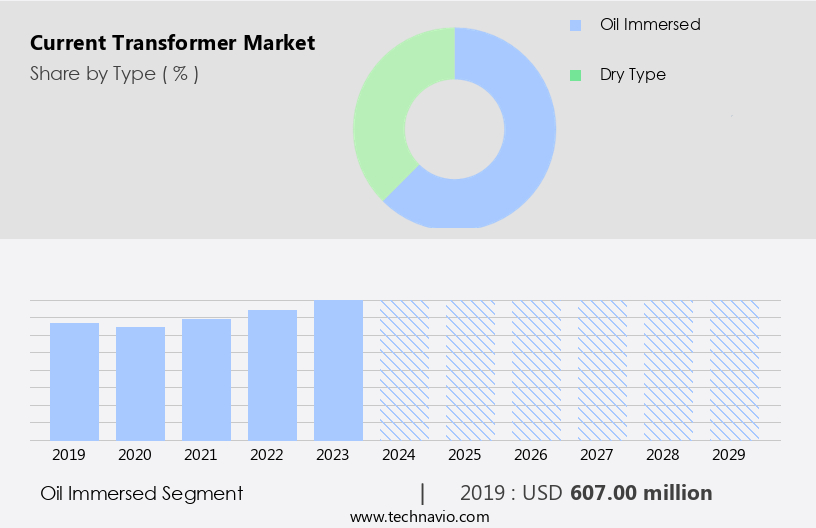
By Type Insights
- The oil immersed segment is estimated to witness significant growth during the forecast period. The market encompasses various types, including oil-immersed current transformers. These transformers are designed for immersion in insulating oil, ensuring effective insulation and cooling. Primarily used in high-voltage applications, such as power generation, transmission, and distribution systems, oil-immersed current transformers are installed in outdoor substations and switchyards for current measurement, protection, and control purposes. Key benefits of oil-immersed current transformers include superior insulation properties due to the oil's dielectric strength, preventing electrical breakdowns. Installed in power systems worldwide, they contribute significantly to grid reliability, particularly in large-scale power projects, solar power, and wind power integration. The advanced features include digital outputs, digital control, real-time data, load monitoring, fault detection, power quality analysis, and cooling capabilities. Despite potential health hazards and fire risks associated with oil immersion, these transformers remain a crucial component of power infrastructure, ensuring operational efficiency and accuracy in power flow control and grid integration.
Get a glance at the market report of share of various segments Request Free Sample
The oil immersed segment was valued at USD 607.00 million in 2019 and showed a gradual increase during the forecast period.
Regional Analysis
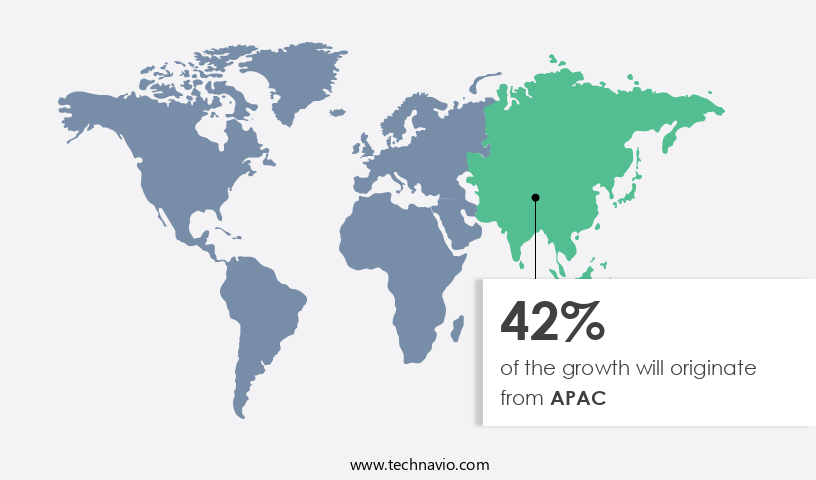
- APAC is estimated to contribute 42% to the growth of the global market during the forecast period. Technavio's analysts have elaborately explained the regional trends and drivers that shape the market during the forecast period. The Asia Pacific region experiences significant demand for electrical power due to the expansion of electricity-intensive industries and population growth, leading to increased urbanization. This trend has enhanced living standards and boosted electricity consumption in major countries like China and India. The privatization of utility companies has facilitated efficient electricity production and distribution, lowering electricity prices and fostering fair competition. A reliable power supply is essential for economic growth In the region.
For more insights on the market size of various regions, Request Free Sample
The growing private sector involvement in power transmission and distribution is anticipated to increase investments in networks, particularly in China, India, Pakistan, Australia, and Thailand. Key drivers for this growth include the integration of renewable energy sources, smart grids, and power flow control for grid reliability. These play a crucial role in power systems, measurement, monitoring, protection, and power infrastructure development. Advanced features such as digital current, communication capabilities, real-time data, and smart grid compatibility are increasingly sought after for their accuracy and operational benefits.
Market Dynamics
Our researchers analyzed the data with 2024 as the base year, along with the key drivers, trends, and challenges. A holistic analysis of drivers will help companies refine their marketing strategies to gain a competitive advantage.
What are the key market drivers leading to the rise In the adoption of Current Transformer Industry?
- Enhanced accuracy of current transformers at extremely low current levels is the key driver of the market. The power industry is witnessing significant transformations due to the increasing role of independent power producers (IPPs) globally. These producers require precise measurement and monitoring of electrical currents for their metering points, which often experience wide swings despite having low auxiliary power requirements for transmission connection. Inaccuracies in current measurement for such applications can be costly, making it essential to use high-performing current transformers. A Class 0.3 current transformer must meet stringent criteria to accommodate the instrumentation burden connected to it. The transformer correction factor should remain within a range of 0.997 to 1.003 for a current transformer at a 100% current ratio, up to the continuous current rating factor.
- This requirement is crucial for power systems, including measurement, monitoring, protection, and power flow control in various applications, such as power plants, electricity grids, control rooms, switchgears, and metering purposes. These play a vital role in grid integration, development, construction, and maintenance of power infrastructure. They are essential for grid reliability, especially In the context of renewable energy projects, such as solar power and wind power, where power quality analysis, load monitoring, fault detection, and real-time data are crucial. These transformers are available in various types, including oil immersed, toroidal, and wound type, catering to different voltage ratings and power transmission requirements.
What are the market trends shaping the Current Transformer Industry?
- Use of auxiliary current transformers is the upcoming market trend. Current transformers play a crucial role in electricity systems by measuring, monitoring, and protecting electrical currents in power systems. The growth drivers for current transformer demand include population growth, urbanization, and the development of power infrastructure for large-scale power projects, smart grids, renewable energy integration, and grid reliability. These are essential components of power systems, serving measurement, monitoring, protection, and power flow control functions. Auxiliary current transformers are a type of current transformer used to reduce the burden on primary current transformers. They operate similarly to primary transformers but face unique challenges. The additional burden imposed on primary current transformers by auxiliary current transformers can lead to increased errors in measurement.
- Furthermore, the performance of auxiliary current transformers may not be as precise as primary transformers due to their design and operational restrictions. These are used in various applications, including power plants, electricity grids, control rooms, switchgears, and metering purposes. They are available in various types, such as toroidal, wound type, oil immersed, and digital current transformers, with different voltage ratings and cooling methods. While current transformers are essential for power transmission and distribution, they come with challenges, such as cooling, oil leakage, health hazards, and fire risks. Despite these challenges, current transformers remain indispensable components of power systems, enabling accurate current measurement, real-time data, load monitoring, fault detection, power quality analysis, and grid integration.
What challenges does the Current Transformer Industry face during its growth?
- High cost of upgrading electricity distribution networks is a key challenge affecting the industry growth. The electricity sector is experiencing significant growth due to population expansion and urbanization, leading to increased demand for current transformers in power systems. Current transformers are essential components in measurement, monitoring, protection, and power flow control in electrical power systems. Their role is crucial in grid integration of renewable energy sources, such as solar and wind energy, for grid reliability and operational efficiency. Power utilities and large-scale power projects require current transformers for various applications, including power plants, electricity grids, control rooms, switchgears, and metering purposes. These transformers measure and control electrical currents in high voltage power transmission lines and voltage ratings.
- Smart grids, digital current, and advanced features are the new trends In the power sector, necessitating the development, construction, and maintenance of power infrastructure. However, the high costs associated with upgrading power systems to accommodate these advanced technologies are a significant challenge for utilities and IPPs. The aging power infrastructure In the US and the need for renewable energy integration are expected to drive current transformer demand over the next two decades, with billions of dollars required for grid modernization. Current transformers come in various types, such as toroidal and wound type, and offer digital outputs, digital control, real-time data, load monitoring, fault detection, power quality analysis, cooling, and oil immersed.
Exclusive Customer Landscape
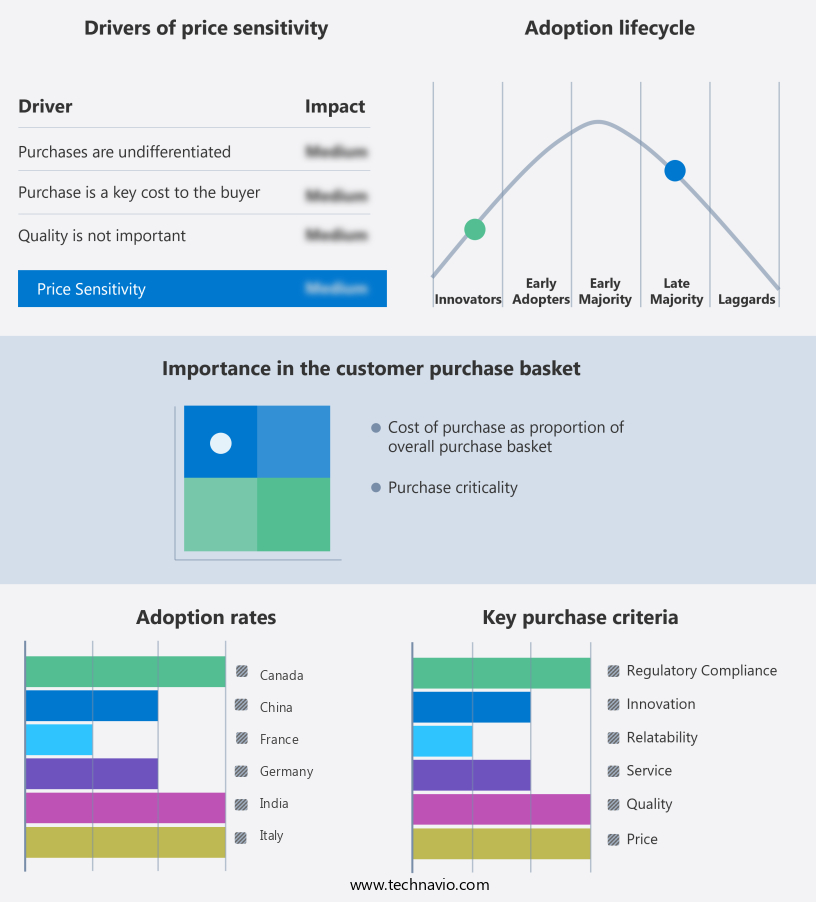
The market forecasting report includes the adoption lifecycle of the market, covering from the innovator's stage to the laggard's stage. It focuses on adoption rates in different regions based on penetration. Furthermore, the market report also includes key purchase criteria and drivers of price sensitivity to help companies evaluate and develop their market growth analysis strategies.
Customer Landscape
Key Companies & Market Insights
Companies are implementing various strategies, such as strategic alliances, market forecast, partnerships, mergers and acquisitions, geographical expansion, and product/service launches, to enhance their presence In the industry.
ABB Ltd. - The company offers current transformers such as ANSI AccuRange.
The industry research and growth report includes detailed analyses of the competitive landscape of the market and information about key companies, including:
- CGS Instrument Transformers
- Dalian Huayi Electric Power Electric Appliances Co. Ltd.
- Eaton Corp. plc
- Fanox Electronic SL
- FRER Srl Vle
- General Electric Co.
- Hammond Manufacturing Co. Ltd.
- Hyosung Corp.
- Murugappa Group
- PREMO SL
- Schneider Electric SE
- Siemens AG
- SOCOMEC Group
- Sumitomo Electric Industries Ltd.
- Trench Ltd.
- Vacuumschmelze GmbH and Co. KG
Qualitative and quantitative analysis of companies has been conducted to help clients understand the wider business environment as well as the strengths and weaknesses of key industry players. Data is qualitatively analyzed to categorize companies as pure play, category-focused, industry-focused, and diversified; it is quantitatively analyzed to categorize companies as dominant, leading, strong, tentative, and weak.
Research Analyst Overview
The electricity sector is experiencing significant growth and development due to population expansion and urbanization across the globe. This expansion is driving the demand for current transformers in various power systems. Current transformers play a crucial role in the measurement, monitoring, protection, and control of electrical currents in power transmission and distribution networks. Current transformers are essential components of power systems, enabling accurate measurement and monitoring of electrical currents. They facilitate the protection of power infrastructure against faults and ensure grid reliability. In the context of renewable energy integration, current transformers are indispensable for power flow control, grid integration, and real-time data analysis.
In addition, the power sector's digital transformation is another growth driver for current transformers. The integration of smart grids and advanced power management systems necessitates the deployment of current transformers with digital communication capabilities, digital outputs, and digital control. These features enable real-time data monitoring, load monitoring, fault detection, and power quality analysis. Current transformers are also essential in cooling systems, particularly those that use oil immersion. The cooling systems ensure the transformers' efficient operation and prolong their lifespan. However, the use of oil-immersed transformers comes with operational restrictions due to health hazards and fire risks. Current transformer development and construction are ongoing processes to meet the evolving needs of the power sector.
Moreover, toroidal and wound-type current transformers cater to various applications, including power plants, electricity grids, control rooms, switchgears, and metering purposes. High voltage current transformers are essential for transmission lines and voltage ratings, ensuring the safe and efficient transfer of electrical power. The power infrastructure's maintenance and upkeep are essential for grid stability and reliability. Current transformers' role in this process is to ensure accurate and continuous monitoring of electrical currents. This information is crucial for identifying potential faults and addressing them before they cause significant damage to the power infrastructure.
Furthermore, the ongoing digital transformation of the power sector and the integration of renewable energy sources are driving the demand for current transformers with advanced features and digital communication capabilities. The power sector's development and maintenance require continuous innovation and improvement in current transformer technology to ensure grid reliability and efficiency.
|
Market Scope |
|
|
Report Coverage |
Details |
|
Page number |
216 |
|
Base year |
2024 |
|
Historic period |
2019-2023 |
|
Forecast period |
2025-2029 |
|
Growth momentum & CAGR |
Accelerate at a CAGR of 8.5% |
|
Market growth 2025-2029 |
USD 521.3 million |
|
Market structure |
Fragmented |
|
YoY growth 2024-2025(%) |
7.7 |
|
Key countries |
US, China, India, Canada, Japan, Germany, UK, France, South Korea, and Italy |
|
Competitive landscape |
Leading Companies, market growth and forecasting, Market Positioning of Companies, Competitive Strategies, and Industry Risks |
What are the Key Data Covered in this Market Research and Growth Report?
- CAGR of the industry during the forecast period
- Detailed information on factors that will drive the growth and forecasting between 2025 and 2029
- Precise estimation of the size of the market and its contribution of the industry in focus to the parent market
- Accurate predictions about upcoming growth and trends and changes in consumer behaviour
- Growth of the market across APAC, North America, Europe, Middle East and Africa, and South America
- Thorough analysis of the market's competitive landscape and detailed information about companies
- Comprehensive analysis of factors that will challenge the market growth of industry companies
We can help! Our analysts can customize this market research report to meet your requirements.
 RIA -
RIA - 
