Curved Television Market Analysis APAC, North America, Europe, South America, Middle East and Africa - China, US, South Korea, India, Germany - Size and Forecast 2024-2028

Curved Television Market Analysis APAC, North America, Europe, South America, Middle East and Africa - China, US, South Korea, India, Germany - Size and Forecast 2024-2028

Published: May 2024 176 Pages SKU: IRTNTR70965

Market Overview at a Glance

$12.72 B
Market Opportunity
29.08%
CAGR
22.6
YoY growth 2023-2024(%)

Curved Television Market Size 2024-2028

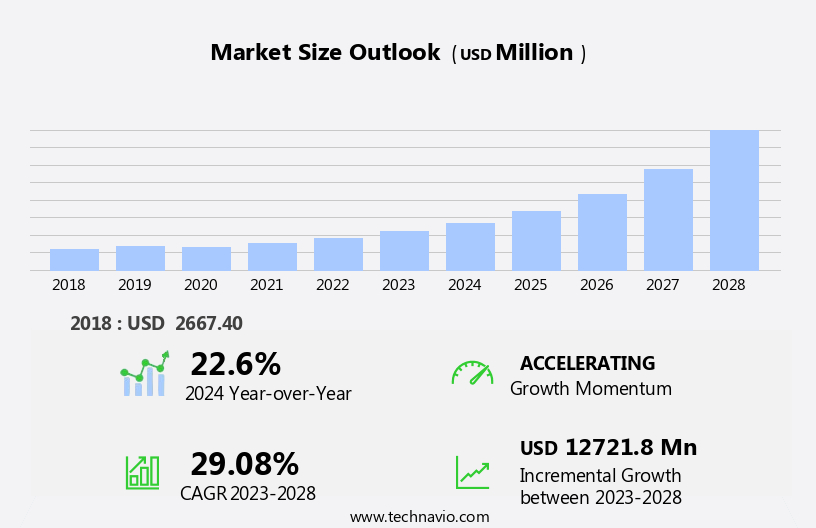
The curved television market size is forecast to increase by USD 12.72 billion at a CAGR of 29.08% between 2023 and 2028.

  • The market is experiencing significant growth due to several key trends. The increasing demand for an immersive viewing experience is driving market growth, as curved TVs offer a more expansive and immersive image compared to traditional flat-screen TVs. Additionally, customers are increasingly prioritizing better image quality, size, and features when making TV purchasing decisions, making curved TVs an attractive option. Furthermore, the emergence of low-cost companies is making curved TVs , smart TV more accessible to a wider audience, expanding the market's reach. Overall, these factors are contributing to the growth and development of the market.

What will be the Size of the Curved Television Market During the Forecast Period?

Curved Television Market Size

 Request Free Sample

  • The market continues to evolve, with significant growth in demand for ultra-high definition (UHD) curved TVs in both residential and commercial segments. These innovative displays offer enhanced viewing experiences through their curved designs, which provide a more immersive and cinematic experience for consumers. Organic LED (OLED) and Mini LED technologies are driving advancements in picture quality and energy efficiency. E-commerce channels, including online sales, have become key distribution platforms, enabling easy access to these high-end and mid-end curved TVs. Smart cities, esports, and the gaming industry are major adopters of curved Infinity Screen TVs, leveraging their large, curved displays for immersive experiences.
  • Content providers and the entertainment industry are also investing in curved designs to differentiate their offerings. Flat televisions remain a significant competition, but aggressive marketing strategies by manufacturers and the increasing popularity of curved designs are expected to drive market growth. The International Trade Administration continues to monitor trade policies and regulations impacting the market. Curved TVs have been featured in various industries, from Peloton fitness studios to James Bond films, further highlighting their appeal and versatility.

How is this Curved Television Industry segmented and which is the largest segment?

The curved television industry research report provides comprehensive data (region-wise segment analysis), with forecasts and estimates in "USD million" for the period 2024-2028, as well as historical data from 2018-2022 for the following segments.

  • Technology
    • HD
    • UHD
  • Display Size
    • Up to 43 inches
    • 48-50 inches
    • 55-64 inches
    • Greater than 65 inches
  • Geography
    • APAC
      • China
      • India
      • South Korea
    • North America
      • US
    • Europe
      • Germany
    • South America
    • Middle East and Africa

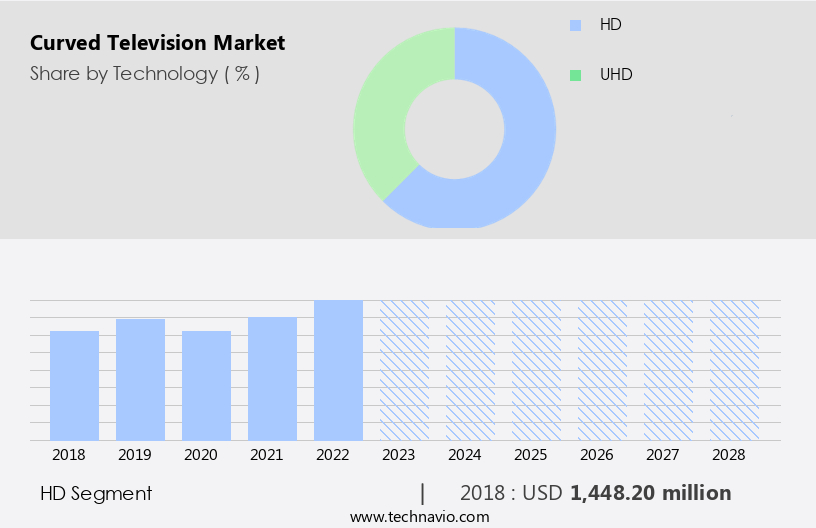
By Technology Insights

  • The hd segment is estimated to witness significant growth during the forecast period.

The market is experiencing significant growth due to the increasing affordability of high-definition (HD) curved TVs and their superior ultra-high definition resolution. Technological advancements in HD televisions and the availability of technologically superior products at competitive prices are key factors driving market expansion. companies, in collaboration with content providers, are expanding the capabilities of HD televisions by offering smart television accessories, such as sticks, enabling users to access and stream Internet content in HD quality on their televisions. For instance, CloudWalker Streaming Technologies provides the HALFTICKET television Smart Stick, which comes with 8 GB internal storage. The residential and commercial segments are the primary consumers of curved televisions, with the mid-end segment witnessing the fastest growth.

Geopolitical factors, including economic sanctions, political instability, recession, and consumer spending, may impact the market. TV manufacturers are employing aggressive marketing strategies to increase sales through e-commerce channels and retail stores. The integration of Organic LED (OLED) technology, Mini LED, and the gaming industry, including esports, is also contributing to the market's growth. Smart cities and streaming platforms are expected to provide significant opportunities for market expansion.

Curved Television Market Size

Get a glance at the  Curved Television Industry report of share of various segments Request Free Sample

The HD segment was valued at USD 1.45 billion in 2018 and showed a gradual increase during the forecast period.

Regional Analysis

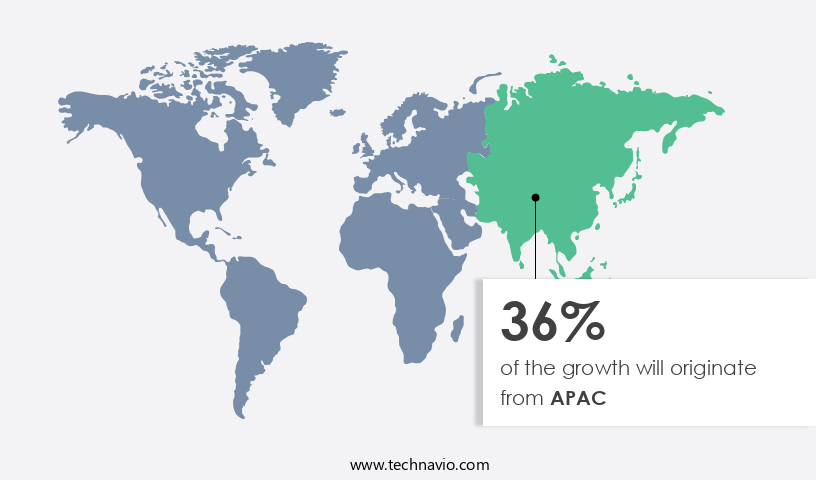
  • APAC is estimated to contribute 36% to the growth of the global market during the forecast period.

Technavio's analysts have elaborately explained the regional trends and drivers that shape the market during the forecast period.

Curved Television Market Share by Geography

For more insights on the market share of various regions, Request Free Sample

The APAC region, home to numerous electronics manufacturers, is a significant contributor to The market. With leading IC drivers and panel display companies, as well as OEMs, residing In the region, particularly China, the region experiences a lower average selling price (ASP) for curved TVs compared to other regions. This price advantage drives increased consumer adoption. Chinese manufacturers offer curved TVs at more affordable prices compared to global brands, such as Samsung and LG Electronics Inc. The residential and commercial segments are key markets for curved TVs, with ultra-high definition resolution and smart TV features gaining popularity. E-commerce channels and online sales further boost sales, particularly in smart cities.

Geopolitical factors, including economic sanctions, political instability, recession, and consumer spending, influence market dynamics. TV manufacturers showcase innovative technologies, such as Organic LED (OLED), Infinity Screen TV, Mini LED, and Curved Television, at industry events like CES. Content providers and streaming platforms are also investing in curved televisions, with brands like LG OLED Flex, Peloton, Rockies, and James Bond promoting their curved TV offerings. The gaming industry, including esports, further fuels demand for curved televisions.

Market Dynamics

Our  researchers analyzed the data with 2023 as the base year, along with the key drivers, trends, and challenges. A holistic analysis of drivers will help companies refine their marketing strategies to gain a competitive advantage.

What are the key market drivers leading to the rise In the adoption of Curved Television Industry?

Increasing demand for augmented experience is the key driver of the market.

  • Curved TVs, featuring Ultra-high definition resolution and Organic LED (OLED) technology, are gaining popularity in both the Residential and Commercial segments. The 55-inch curved TVs are particularly favored for their immersive picture quality and curved designs, which provide a more cinematic experience. E-commerce channels, such as Amazon, are driving Online sales, making these high-end and mid-range Consumer electronic products more accessible. Smart cities and the Entertainment industry are key growth drivers for curved televisions. However, geopolitical factors, including economic sanctions and political instability, may impact the market. A recession could also decrease Consumer spending, affecting TV manufacturers' sales. The market dynamics are influenced by various factors, including aggressive marketing strategies by manufacturers like LG and Samsung, the introduction of innovative products like the Infinity Screen TV, and the integration of Peloton and Rockies into curved televisions.
  • The Gaming industry, Esports, and Smart TVs are also significant contributors to the market's growth. Content providers and Streaming platforms are collaborating to offer exclusive content on curved televisions, further increasing demand. The emergence of Cloud gaming and Mini LED technology is expected to provide new opportunities for market expansion. Despite challenges, the market is poised for steady growth during the forecast period.

What are the market trends shaping the Curved Television Industry?

Shifting of customer preference toward better image quality, size, and features of TVs is the upcoming market trend.

  • Curved televisions, featuring Organic LED (OLED) and Ultra-high definition resolution, have gained significant attention in both the residential and commercial segments. Consumers are increasingly seeking advanced picture quality and immersive viewing experiences, driving the demand for curved designs. Unlike flat televisions, curved models offer reduced distortion and reflections, enhancing the overall viewing experience. For instance, at a standard 8-foot viewing distance, curved TVs, such as LG OLED Flex, reduce distortion by approximately 50%. Furthermore, curved designs minimize reflections on the screen, allowing for perfect blacks and improved image quality. Curved TVs also cater to various market segments, including high-end, mid-end, and low-end consumer electronic products.
  • E-commerce channels, such as Amazon, have significantly contributed to the online sales of curved televisions. In addition, the adoption of curved televisions in smart cities, esports, and the gaming industry has further fueled market growth. However, geopolitical factors, including economic sanctions and political instability, may impact the market dynamics. Consumer spending patterns and aggressive marketing strategies by TV manufacturers, such as CES and Infinity Screen TV, also influence market trends. The entertainment industry's shift towards streaming platforms and content providers, like Peloton, Rockies, and James Bond, has also contributed to the increasing popularity of curved televisions. Innovations in display technology, such as Mini LED and OLED, continue to advance the market.
  • In conclusion, the market is expected to continue growing due to the increasing demand for advanced picture quality and immersive viewing experiences.

What challenges does the Curved Television Industry face during its growth?

Emergence of low-cost vendors is a key challenge affecting the industry growth.

  • The market encompasses the sale and production of curved Ultra-high definition TVs, including Organic LED (OLED) and Mini LED models, for both the residential and commercial segments. The market is characterized by intense competition among various players, with key differences in product offerings and pricing strategies. Global companies provide high-end curved TVs with advanced features and superior picture quality, catering to the demands of the premium segment. In contrast, new entrants from Asia Pacific (APAC) regions offer more affordable options, targeting the mid- and low-end markets. Despite differences in performance, these cost-effective curved televisions have gained significant traction, particularly in price-sensitive regions.
  • The commercial segment, including smart cities and the gaming industry, presents substantial growth opportunities for curved televisions, driven by the need for immersive viewing experiences. E-commerce channels, such as Amazon, have become crucial distribution channels for curved televisions, with online sales accounting for a substantial portion of total sales. However, geopolitical factors, including economic sanctions, political instability, and recession, may impact consumer spending and, consequently, the market dynamics. TV manufacturers continue to innovate, with offerings such as LG OLED Flex and Infinity Screen TVs, as well as partnerships with brands like Peloton and the Rockies, further enhancing the market landscape.
  • The entertainment industry, including content providers and streaming platforms, also plays a significant role in shaping the market. In conclusion, the market is experiencing steady growth, driven by technological advancements, competitive pricing, and evolving consumer preferences. Despite the presence of established players, new entrants from APAC countries are making their mark by offering cost-effective alternatives. The market is expected to remain dynamic, with ongoing innovation and strategic partnerships shaping its future trajectory.

Exclusive Customer Landscape

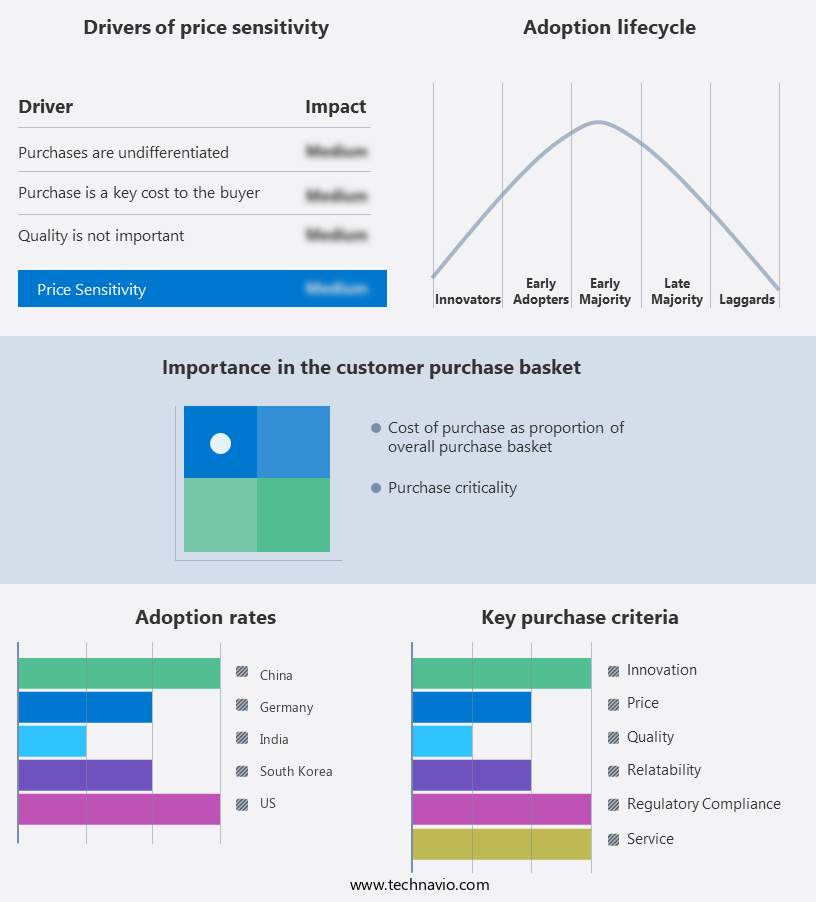
The curved television market forecasting report includes the adoption lifecycle of the market, covering from the innovator's stage to the laggard's stage. It focuses on adoption rates in different regions based on penetration. Furthermore, the curved television market report also includes key purchase criteria and drivers of price sensitivity to help companies evaluate and develop their market growth analysis strategies.

Curved Television Market Share by Geography

 Customer Landscape

Key Companies & Market Insights

Companies are implementing various strategies, such as strategic alliances, curved television market forecast, partnerships, mergers and acquisitions, geographical expansion, and product/service launches, to enhance their presence In the industry.

Changhong - Curved televisions, including the Changhong Ruba UD55F7300i 4K UHD Smart LED TV, represent a growing segment In the global display market. These televisions offer an immersive viewing experience by providing a more natural perspective and reducing the perceived edge distortion. The curved design also allows for a wider viewing angle and improved color accuracy. As consumer preferences shift towards larger, high-definition screens, the demand for curved televisions is expected to increase. This trend is driven by advancements in display technology and the increasing affordability of curved televisions. The market for curved televisions is projected to grow significantly In the coming years, offering manufacturers and retailers new opportunities to cater to the evolving needs of tech-savvy consumers.

The industry research and growth report includes detailed analyses of the competitive landscape of the market and information about key companies, including:

  • Changhong
  • CloudWalker Streaming Technologies Pvt. Ltd.
  • Haier Smart Home Co. Ltd.
  • Hisense International Co. Ltd.
  • JVCKENWOOD Corp.
  • Koninklijke Philips N.V.
  • LG Electronics Inc.
  • Loewe Technology GmbH
  • Nimble Holdings Co. Ltd.
  • Panasonic Holdings Corp.
  • PLR IP Holdings LLC
  • Samsung Electronics Co. Ltd.
  • Sceptre Inc.
  • Sharp Corp.
  • Skyworth Group Ltd.
  • Sony Group Corp.
  • Stanlee India Enterprises Pvt. Ltd.
  • TCL Electronics Holdings Ltd.
  • Vu Television
  • Xiaomi Communications Co. Ltd.

Qualitative and quantitative analysis of companies has been conducted to help clients understand the wider business environment as well as the strengths and weaknesses of key industry players. Data is qualitatively analyzed to categorize companies as pure play, category-focused, industry-focused, and diversified; it is quantitatively analyzed to categorize companies as dominant, leading, strong, tentative, and weak.

Research Analyst Overview

Curved televisions have emerged as a significant trend In the consumer electronic products market, offering an immersive viewing experience with enhanced picture quality. The residential segment has shown a notable preference for curved televisions due to their ability to provide a more cinematic experience. However, the commercial segment, including smart cities and businesses, is also exploring the benefits of curved televisions for digital signage and advertising applications. Curved televisions boast ultra-high definition resolution, which contributes to improved picture quality. The organic light-emitting diode (OLED) technology, with its ability to produce perfect blacks and vibrant colors, has gained popularity In the market.

This technology is used in high-end curved televisions, offering superior contrast and brightness. Manufacturers have adopted various strategies to cater to different market segments. Mid-end and low-end curved televisions use mini-LED technology, which offers energy efficiency and cost-effectiveness. The gaming industry and esports have also shown interest in curved televisions, as they provide a more immersive gaming experience. Smart cities and businesses are increasingly adopting curved televisions for digital signage and advertising purposes. The large, curved screens offer a more engaging and eye-catching display, making them an attractive option for commercial applications. The market faces several market dynamics.

Economic factors, such as consumer spending and economic conditions, can significantly impact sales. Geopolitical factors, such as political instability and economic sanctions, can disrupt international trade and impact the supply chain. Marketing strategies have played a crucial role In the growth of the market. Manufacturers have employed aggressive marketing campaigns to differentiate their products and attract consumers. E-commerce channels and online sales have also contributed to the market's growth, offering convenience and accessibility to consumers. Content providers and streaming platforms have also shown interest in curved televisions, recognizing their potential for delivering an enhanced viewing experience. The entertainment industry, including movies and TV shows, can benefit from the immersive nature of curved televisions, providing a more cinematic experience for viewers.

In conclusion, the market is experiencing significant growth due to its ability to offer an immersive viewing experience and enhanced picture quality. The market faces various market dynamics, including economic and geopolitical factors, and manufacturers have adopted various strategies to cater to different market segments. The future of curved televisions looks promising, with continued innovation and advancements in technology.

Market Scope

Report Coverage

Details

Page number

176

Base year

2023

Historic period

2018-2022

Forecast period

2024-2028

Growth momentum & CAGR

Accelerate at a CAGR of 29.08%

Market growth 2024-2028

USD 12721.8 million

Market structure

Fragmented

YoY growth 2023-2024(%)

22.6

Key countries

China, US, South Korea, India, and Germany

Competitive landscape

Leading Companies, Market Positioning of Companies, Competitive Strategies, and Industry Risks

Request Free Sample

What are the Key Data Covered in this Curved Television Market Research and Growth Report?

  • CAGR of the Curved Television industry during the forecast period
  • Detailed information on factors that will drive the growth and forecasting between 2024 and 2028
  • Precise estimation of the size of the market and its contribution of the industry in focus to the parent market
  • Accurate predictions about upcoming growth and trends and changes in consumer behaviour
  • Growth of the market across APAC, North America, Europe, South America, and Middle East and Africa
  • Thorough analysis of the market's competitive landscape and detailed information about companies
  • Comprehensive analysis of factors that will challenge the curved television market growth of industry companies

We can help! Our analysts can customize this curved television market research report to meet your requirements.

Get in touch

1 Executive Summary

  • 1.1 Market overview
    • Executive Summary - Chart on Market Overview
    • Executive Summary - Data Table on Market Overview
    • Executive Summary - Chart on Global Market Characteristics
    • Executive Summary - Chart on Market by Geography
    • Executive Summary - Chart on Market Segmentation by Technology
    • Executive Summary - Chart on Market Segmentation by Display Size
    • Executive Summary - Chart on Incremental Growth
    • Executive Summary - Data Table on Incremental Growth
    • Executive Summary - Chart on Company Market Positioning

2 Market Landscape

  • 2.1 Market ecosystem
    • Parent Market
    • Data Table on - Parent Market
  • 2.2 Market characteristics
    • Market characteristics analysis
  • 2.3 Value chain analysis
    • Value Chain Analysis

3 Market Sizing

  • 3.1 Market definition
    • Offerings of companies included in the market definition
  • 3.2 Market segment analysis
    • Market segments
  • 3.3 Market size 2023
    • 3.4 Market outlook: Forecast for 2023-2028
      • Chart on Global - Market size and forecast 2023-2028 ($ million)
      • Data Table on Global - Market size and forecast 2023-2028 ($ million)
      • Chart on Global Market: Year-over-year growth 2023-2028 (%)
      • Data Table on Global Market: Year-over-year growth 2023-2028 (%)

    4 Historic Market Size

    • 4.1 Global Curved Television Market 2018 - 2022
      • Historic Market Size - Data Table on Global Curved Television Market 2018 - 2022 ($ million)
    • 4.2 Technology segment analysis 2018 - 2022
      • Historic Market Size - Technology Segment 2018 - 2022 ($ million)
    • 4.3 Display Size segment analysis 2018 - 2022
      • Historic Market Size - Display Size Segment 2018 - 2022 ($ million)
    • 4.4 Geography segment analysis 2018 - 2022
      • Historic Market Size - Geography Segment 2018 - 2022 ($ million)
    • 4.5 Country segment analysis 2018 - 2022
      • Historic Market Size - Country Segment 2018 - 2022 ($ million)

    5 Five Forces Analysis

    • 5.1 Five forces summary
      • Five forces analysis - Comparison between 2023 and 2028
    • 5.2 Bargaining power of buyers
      • Bargaining power of buyers - Impact of key factors 2023 and 2028
    • 5.3 Bargaining power of suppliers
      • Bargaining power of suppliers - Impact of key factors in 2023 and 2028
    • 5.4 Threat of new entrants
      • Threat of new entrants - Impact of key factors in 2023 and 2028
    • 5.5 Threat of substitutes
      • Threat of substitutes - Impact of key factors in 2023 and 2028
    • 5.6 Threat of rivalry
      • Threat of rivalry - Impact of key factors in 2023 and 2028
    • 5.7 Market condition
      • Chart on Market condition - Five forces 2023 and 2028

    6 Market Segmentation by Technology

    • 6.1 Market segments
      • Chart on Technology - Market share 2023-2028 (%)
      • Data Table on Technology - Market share 2023-2028 (%)
    • 6.2 Comparison by Technology
      • Chart on Comparison by Technology
      • Data Table on Comparison by Technology
    • 6.3 HD - Market size and forecast 2023-2028
      • Chart on HD - Market size and forecast 2023-2028 ($ million)
      • Data Table on HD - Market size and forecast 2023-2028 ($ million)
      • Chart on HD - Year-over-year growth 2023-2028 (%)
      • Data Table on HD - Year-over-year growth 2023-2028 (%)
    • 6.4 UHD - Market size and forecast 2023-2028
      • Chart on UHD - Market size and forecast 2023-2028 ($ million)
      • Data Table on UHD - Market size and forecast 2023-2028 ($ million)
      • Chart on UHD - Year-over-year growth 2023-2028 (%)
      • Data Table on UHD - Year-over-year growth 2023-2028 (%)
    • 6.5 Market opportunity by Technology
      • Market opportunity by Technology ($ million)
      • Data Table on Market opportunity by Technology ($ million)

    7 Market Segmentation by Display Size

    • 7.1 Market segments
      • Chart on Display Size - Market share 2023-2028 (%)
      • Data Table on Display Size - Market share 2023-2028 (%)
    • 7.2 Comparison by Display Size
      • Chart on Comparison by Display Size
      • Data Table on Comparison by Display Size
    • 7.3 Up to 43 inches - Market size and forecast 2023-2028
      • Chart on Up to 43 inches - Market size and forecast 2023-2028 ($ million)
      • Data Table on Up to 43 inches - Market size and forecast 2023-2028 ($ million)
      • Chart on Up to 43 inches - Year-over-year growth 2023-2028 (%)
      • Data Table on Up to 43 inches - Year-over-year growth 2023-2028 (%)
    • 48-50 inches - Market size and forecast 2023-2028
      • Chart on 48-50 inches - Market size and forecast 2023-2028 ($ million)
      • Data Table on 48-50 inches - Market size and forecast 2023-2028 ($ million)
      • Chart on 48-50 inches - Year-over-year growth 2023-2028 (%)
      • Data Table on 48-50 inches - Year-over-year growth 2023-2028 (%)
    • 55-64 inches - Market size and forecast 2023-2028
      • Chart on 55-64 inches - Market size and forecast 2023-2028 ($ million)
      • Data Table on 55-64 inches - Market size and forecast 2023-2028 ($ million)
      • Chart on 55-64 inches - Year-over-year growth 2023-2028 (%)
      • Data Table on 55-64 inches - Year-over-year growth 2023-2028 (%)
    • 7.6 Greater than 65 inches - Market size and forecast 2023-2028
      • Chart on Greater than 65 inches - Market size and forecast 2023-2028 ($ million)
      • Data Table on Greater than 65 inches - Market size and forecast 2023-2028 ($ million)
      • Chart on Greater than 65 inches - Year-over-year growth 2023-2028 (%)
      • Data Table on Greater than 65 inches - Year-over-year growth 2023-2028 (%)
    • 7.7 Market opportunity by Display Size
      • Market opportunity by Display Size ($ million)
      • Data Table on Market opportunity by Display Size ($ million)

    8 Customer Landscape

    • 8.1 Customer landscape overview
      • Analysis of price sensitivity, lifecycle, customer purchase basket, adoption rates, and purchase criteria

    9 Geographic Landscape

    • 9.1 Geographic segmentation
      • Chart on Market share by geography 2023-2028 (%)
      • Data Table on Market share by geography 2023-2028 (%)
    • 9.2 Geographic comparison
      • Chart on Geographic comparison
      • Data Table on Geographic comparison
    • 9.3 APAC - Market size and forecast 2023-2028
      • Chart on APAC - Market size and forecast 2023-2028 ($ million)
      • Data Table on APAC - Market size and forecast 2023-2028 ($ million)
      • Chart on APAC - Year-over-year growth 2023-2028 (%)
      • Data Table on APAC - Year-over-year growth 2023-2028 (%)
    • 9.4 North America - Market size and forecast 2023-2028
      • Chart on North America - Market size and forecast 2023-2028 ($ million)
      • Data Table on North America - Market size and forecast 2023-2028 ($ million)
      • Chart on North America - Year-over-year growth 2023-2028 (%)
      • Data Table on North America - Year-over-year growth 2023-2028 (%)
    • 9.5 Europe - Market size and forecast 2023-2028
      • Chart on Europe - Market size and forecast 2023-2028 ($ million)
      • Data Table on Europe - Market size and forecast 2023-2028 ($ million)
      • Chart on Europe - Year-over-year growth 2023-2028 (%)
      • Data Table on Europe - Year-over-year growth 2023-2028 (%)
    • 9.6 South America - Market size and forecast 2023-2028
      • Chart on South America - Market size and forecast 2023-2028 ($ million)
      • Data Table on South America - Market size and forecast 2023-2028 ($ million)
      • Chart on South America - Year-over-year growth 2023-2028 (%)
      • Data Table on South America - Year-over-year growth 2023-2028 (%)
    • 9.7 Middle East and Africa - Market size and forecast 2023-2028
      • Chart on Middle East and Africa - Market size and forecast 2023-2028 ($ million)
      • Data Table on Middle East and Africa - Market size and forecast 2023-2028 ($ million)
      • Chart on Middle East and Africa - Year-over-year growth 2023-2028 (%)
      • Data Table on Middle East and Africa - Year-over-year growth 2023-2028 (%)
    • 9.8 China - Market size and forecast 2023-2028
      • Chart on China - Market size and forecast 2023-2028 ($ million)
      • Data Table on China - Market size and forecast 2023-2028 ($ million)
      • Chart on China - Year-over-year growth 2023-2028 (%)
      • Data Table on China - Year-over-year growth 2023-2028 (%)
    • 9.9 South Korea - Market size and forecast 2023-2028
      • Chart on South Korea - Market size and forecast 2023-2028 ($ million)
      • Data Table on South Korea - Market size and forecast 2023-2028 ($ million)
      • Chart on South Korea - Year-over-year growth 2023-2028 (%)
      • Data Table on South Korea - Year-over-year growth 2023-2028 (%)
    • 9.10 US - Market size and forecast 2023-2028
      • Chart on US - Market size and forecast 2023-2028 ($ million)
      • Data Table on US - Market size and forecast 2023-2028 ($ million)
      • Chart on US - Year-over-year growth 2023-2028 (%)
      • Data Table on US - Year-over-year growth 2023-2028 (%)
    • 9.11 India - Market size and forecast 2023-2028
      • Chart on India - Market size and forecast 2023-2028 ($ million)
      • Data Table on India - Market size and forecast 2023-2028 ($ million)
      • Chart on India - Year-over-year growth 2023-2028 (%)
      • Data Table on India - Year-over-year growth 2023-2028 (%)
    • 9.12 Germany - Market size and forecast 2023-2028
      • Chart on Germany - Market size and forecast 2023-2028 ($ million)
      • Data Table on Germany - Market size and forecast 2023-2028 ($ million)
      • Chart on Germany - Year-over-year growth 2023-2028 (%)
      • Data Table on Germany - Year-over-year growth 2023-2028 (%)
    • 9.13 Market opportunity by geography
      • Market opportunity by geography ($ million)
      • Data Tables on Market opportunity by geography ($ million)

    10 Drivers, Challenges, and Opportunity/Restraints

    • 10.1 Market drivers
      • 10.2 Market challenges
        • 10.3 Impact of drivers and challenges
          • Impact of drivers and challenges in 2023 and 2028
        • 10.4 Market opportunities/restraints

          11 Competitive Landscape

          • 11.1 Overview
            • 11.2 Competitive Landscape
              • Overview on criticality of inputs and factors of differentiation
            • 11.3 Landscape disruption
              • Overview on factors of disruption
            • 11.4 Industry risks
              • Impact of key risks on business

            12 Competitive Analysis

            • 12.1 Companies profiled
              • Companies covered
            • 12.2 Market positioning of companies
              • Matrix on companies position and classification
            • 12.3 Changhong
              • Changhong - Overview
              • Changhong - Product / Service
              • Changhong - Key offerings
            • 12.4 CloudWalker Streaming Technologies Pvt. Ltd.
              • CloudWalker Streaming Technologies Pvt. Ltd. - Overview
              • CloudWalker Streaming Technologies Pvt. Ltd. - Product / Service
              • CloudWalker Streaming Technologies Pvt. Ltd. - Key offerings
            • 12.5 Haier Smart Home Co. Ltd.
              • Haier Smart Home Co. Ltd. - Overview
              • Haier Smart Home Co. Ltd. - Business segments
              • Haier Smart Home Co. Ltd. - Key news
              • Haier Smart Home Co. Ltd. - Key offerings
              • Haier Smart Home Co. Ltd. - Segment focus
            • 12.6 JVCKENWOOD Corp.
              • JVCKENWOOD Corp. - Overview
              • JVCKENWOOD Corp. - Business segments
              • JVCKENWOOD Corp. - Key news
              • JVCKENWOOD Corp. - Key offerings
              • JVCKENWOOD Corp. - Segment focus
            • 12.7 Koninklijke Philips NV
              • Koninklijke Philips NV - Overview
              • Koninklijke Philips NV - Business segments
              • Koninklijke Philips NV - Key news
              • Koninklijke Philips NV - Key offerings
              • Koninklijke Philips NV - Segment focus
            • 12.8 LG Electronics Inc.
              • LG Electronics Inc. - Overview
              • LG Electronics Inc. - Product / Service
              • LG Electronics Inc. - Key news
              • LG Electronics Inc. - Key offerings
            • 12.9 Panasonic Holdings Corp.
              • Panasonic Holdings Corp. - Overview
              • Panasonic Holdings Corp. - Business segments
              • Panasonic Holdings Corp. - Key news
              • Panasonic Holdings Corp. - Key offerings
              • Panasonic Holdings Corp. - Segment focus
            • 12.10 PLR IP Holdings LLC
              • PLR IP Holdings LLC - Overview
              • PLR IP Holdings LLC - Product / Service
              • PLR IP Holdings LLC - Key offerings
            • 12.11 Samsung Electronics Co. Ltd.
              • Samsung Electronics Co. Ltd. - Overview
              • Samsung Electronics Co. Ltd. - Business segments
              • Samsung Electronics Co. Ltd. - Key news
              • Samsung Electronics Co. Ltd. - Key offerings
              • Samsung Electronics Co. Ltd. - Segment focus
            • 12.12 Sceptre Inc.
              • Sceptre Inc. - Overview
              • Sceptre Inc. - Product / Service
              • Sceptre Inc. - Key offerings
            • 12.13 Sharp Corp.
              • Sharp Corp. - Overview
              • Sharp Corp. - Business segments
              • Sharp Corp. - Key news
              • Sharp Corp. - Key offerings
              • Sharp Corp. - Segment focus
            • 12.14 Skyworth Group Ltd.
              • Skyworth Group Ltd. - Overview
              • Skyworth Group Ltd. - Product / Service
              • Skyworth Group Ltd. - Key offerings
            • 12.15 Sony Group Corp.
              • Sony Group Corp. - Overview
              • Sony Group Corp. - Business segments
              • Sony Group Corp. - Key news
              • Sony Group Corp. - Key offerings
              • Sony Group Corp. - Segment focus
            • 12.16 TCL Electronics Holdings Ltd.
              • TCL Electronics Holdings Ltd. - Overview
              • TCL Electronics Holdings Ltd. - Business segments
              • TCL Electronics Holdings Ltd. - Key offerings
              • TCL Electronics Holdings Ltd. - Segment focus
            • 12.17 Xiaomi Communications Co. Ltd.
              • Xiaomi Communications Co. Ltd. - Overview
              • Xiaomi Communications Co. Ltd. - Business segments
              • Xiaomi Communications Co. Ltd. - Key news
              • Xiaomi Communications Co. Ltd. - Key offerings
              • Xiaomi Communications Co. Ltd. - Segment focus

            13 Appendix

            • 13.1 Scope of the report
              • 13.2 Inclusions and exclusions checklist
                • Inclusions checklist
                • Exclusions checklist
              • 13.3 Currency conversion rates for US$
                • Currency conversion rates for US$
              • 13.4 Research methodology
                • Research methodology
              • 13.5 Data procurement
                • Information sources
              • 13.6 Data validation
                • Data validation
              • 13.7 Validation techniques employed for market sizing
                • Validation techniques employed for market sizing
              • 13.8 Data synthesis
                • Data synthesis
              • 13.9 360 degree market analysis
                • 360 degree market analysis
              • 13.10 List of abbreviations
                • List of abbreviations

              Research Methodology

              Technavio presents a detailed picture of the market by way of study, synthesis, and summation of data from multiple sources. The analysts have presented the various facets of the market with a particular focus on identifying the key industry influencers. The data thus presented is comprehensive, reliable, and the result of extensive research, both primary and secondary.

              INFORMATION SOURCES

              Primary sources

              • Manufacturers and suppliers
              • Channel partners
              • Industry experts
              • Strategic decision makers

              Secondary sources

              • Industry journals and periodicals
              • Government data
              • Financial reports of key industry players
              • Historical data
              • Press releases

              DATA ANALYSIS

              Data Synthesis

              • Collation of data
              • Estimation of key figures
              • Analysis of derived insights

              Data Validation

              • Triangulation with data models
              • Reference against proprietary databases
              • Corroboration with industry experts

              REPORT WRITING

              Qualitative

              • Market drivers
              • Market challenges
              • Market trends
              • Five forces analysis

              Quantitative

              • Market size and forecast
              • Market segmentation
              • Geographical insights
              • Competitive landscape

              Interested in this report?

              Get your sample now to see our research methodology and insights!

              Download Now

              Frequently Asked Questions

              Curved Television market growth will increase by $ 12721.8 mn during 2024-2028 .

              The Curved Television market is expected to grow at a CAGR of 29.08% during 2024-2028 .

              Curved Television market is segmented by Technology( HD, UHD) Display Size( Up to 43 inches, 48-50 inches, 55-64 inches, Greater than 65 inches)

              Changhong, CloudWalker Streaming Technologies Pvt. Ltd., Haier Smart Home Co. Ltd., Hisense International Co. Ltd., JVCKENWOOD Corp., Koninklijke Philips N.V., LG Electronics Inc., Loewe Technology GmbH, Nimble Holdings Co. Ltd., Panasonic Holdings Corp., PLR IP Holdings LLC, Samsung Electronics Co. Ltd., Sceptre Inc., Sharp Corp., Skyworth Group Ltd., Sony Group Corp., Stanlee India Enterprises Pvt. Ltd., TCL Electronics Holdings Ltd., Vu Television, Xiaomi Communications Co. Ltd. are a few of the key vendors in the Curved Television market.

              APAC will register the highest growth rate of 36% among the other regions. Therefore, the Curved Television market in APAC is expected to garner significant business opportunities for the vendors during the forecast period.

              China, US, South Korea, India, Germany

              • Increasing demand for augmented experienceTelevision is old technology; however is the driving factor this market.
              • the continuous demand for advanced technology to experience optimum quality in viewing content is driving the growth of curved TV during the forecast period. Augmented reality (AR) is one of the most anticipated technological development during the forecast period. Various big vendors such as Apple and Google are driving AR development and taking the necessary steps toward this change. To experience AR is the driving factor this market.
              • the 3D visualization of pictures shown on curved TVs is a must. The curved TVs used are not fully efficient for such technology (holographic video). However is the driving factor this market.
              • some companies is the driving factor this market.
              • such as Microsoft is the driving factor this market.
              • are developing holographic production. Such factors are expected to drive the growth of the global curved TV market during the forecast period. is the driving factor this market.

              The Curved Television market vendors should focus on grabbing business opportunities from the HD segment as it accounted for the largest market share in the base year.