Malaysia Data Center Market Size 2026-2030
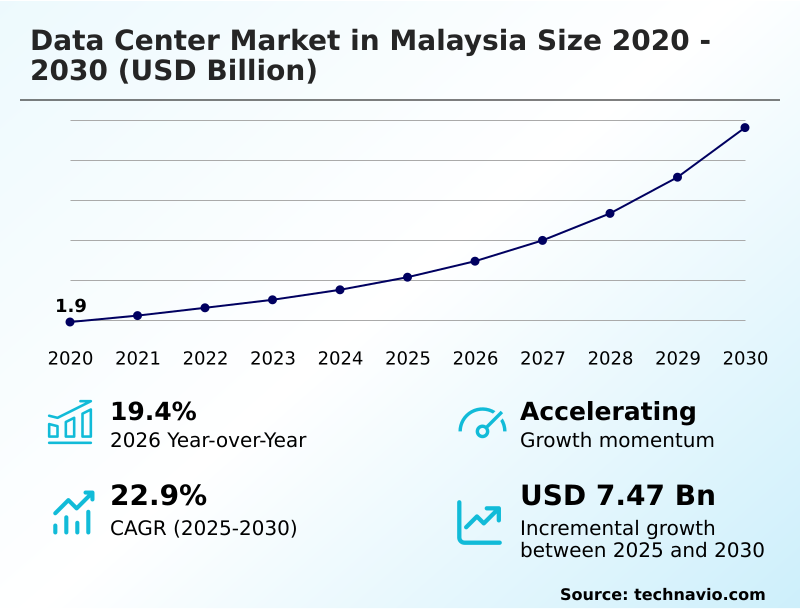
The malaysia data center market size is valued to increase by USD 7.47 billion, at a CAGR of 22.9% from 2025 to 2030. Supportive government policies and streamlined investment framework will drive the malaysia data center market.
Major Market Trends & Insights
- By Type - Data center servers segment was valued at USD 1.37 billion in 2024
- By End-user - BFSI segment accounted for the largest market revenue share in 2024
Market Size & Forecast
- Market Opportunities: USD 9.71 billion
- Market Future Opportunities: USD 7.47 billion
- CAGR from 2025 to 2030 : 22.9%
Market Summary
- The data center market in Malaysia is undergoing a period of significant expansion, solidifying its position as a primary hub for digital infrastructure in Southeast Asia. This growth is driven by a confluence of favorable factors, including proactive government support and the nation's strategic geographical location.
- The increasing global demand for cloud computing, AI, and big data analytics is a major catalyst. As more enterprises transition to the cloud, the need for robust, scalable, and secure data center infrastructure has become paramount, spurring investments in colocation interconnection services.
- For instance, a financial services firm can leverage this infrastructure to ensure data sovereignty compliance while processing millions of transactions, benefiting from cloud on-ramp connectivity for its hybrid multi-cloud architectures. This environment supports the development of AI-ready data center design with advanced liquid cooling technologies.
- This synergy between technological adoption and infrastructure development creates a virtuous cycle, fueling further innovation in data-intensive technology workloads and driving demand for more sophisticated capabilities. The focus on green data center development and sustainable data center operations is also shaping the market's future, aligning with global environmental social governance criteria and enhancing the region's long-term viability.
What will be the Size of the Malaysia Data Center Market during the forecast period?
Get Key Insights on Market Forecast (PDF) Get Free Sample
How is the Malaysia Data Center Market Segmented?
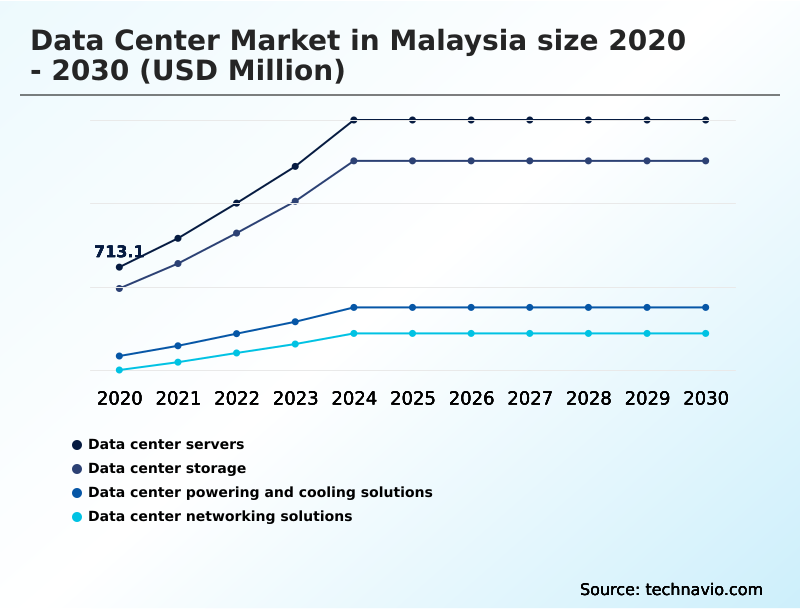
The malaysia data center industry research report provides comprehensive data (region-wise segment analysis), with forecasts and estimates in "USD million" for the period 2026-2030, as well as historical data from 2020-2024 for the following segments.
- Type
- Data center servers
- Data center storage
- Data center powering and cooling solutions
- Data center networking solutions
- End-user
- BFSI
- IT and telecom
- E-commerce
- Government
- Others
- Environment
- Hyperscale
- Colocation
- Edge
- Others
- Variant
- Tier 3
- Tier 1 and Tier 2
- Tier 4
- Geography
- APAC
By Type Insights
The data center servers segment is estimated to witness significant growth during the forecast period.
The data center market is segmented by the evolving needs of enterprise it infrastructure modernization, driving adoption of hybrid multi-cloud architectures.
This approach helps enterprises balance on-premise control with public cloud flexibility, leading to significant data backhaul traffic reduction of up to 20%. Demand is high for advanced software-defined storage solutions, including scalable object storage for unstructured data.
Security is addressed through network micro-segmentation, which isolates workloads to limit lateral threat movement.
To meet stringent uptime requirements and adhere to environmental social governance criteria, organizations are investing in platforms offering 2n+1 fully redundant infrastructure and integrated disaster recovery as a service, ensuring business continuity and regulatory alignment.
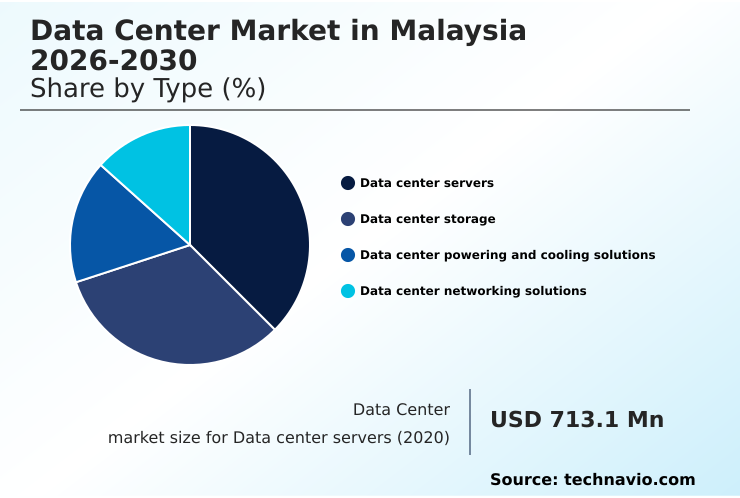
The Data center servers segment was valued at USD 1.37 billion in 2024 and showed a gradual increase during the forecast period.
Market Dynamics
Our researchers analyzed the data with 2025 as the base year, along with the key drivers, trends, and challenges. A holistic analysis of drivers will help companies refine their marketing strategies to gain a competitive advantage.
- Strategic planning within the data center market in Malaysia is increasingly centered on balancing performance with sustainability. The discussion around tier 4 data center availability is becoming more prominent as mission-critical applications demand near-perfect uptime, which is especially relevant for financial institutions and sovereign cloud deployments.
- Simultaneously, addressing the hyperscale data center power requirements has placed data center sustainability reporting metrics at the forefront of operational strategy. Companies are now evaluated on their ability to manage energy consumption effectively. For emerging use cases, edge computing for iot applications offers a solution to latency challenges, processing data closer to the source and reducing network strain.
- This is particularly vital in smart manufacturing and logistics, where real-time decisions are crucial. Moreover, the rise of artificial intelligence workloads necessitates ai workload advanced cooling solutions, moving beyond traditional air cooling to more efficient liquid-based systems.
- A comparative analysis shows that facilities adopting such advanced cooling methods can support server rack densities that are over 50% higher than those using conventional systems, directly impacting capital efficiency and physical footprint. These intersecting demands are shaping a new generation of data centers optimized for specific, high-value applications.
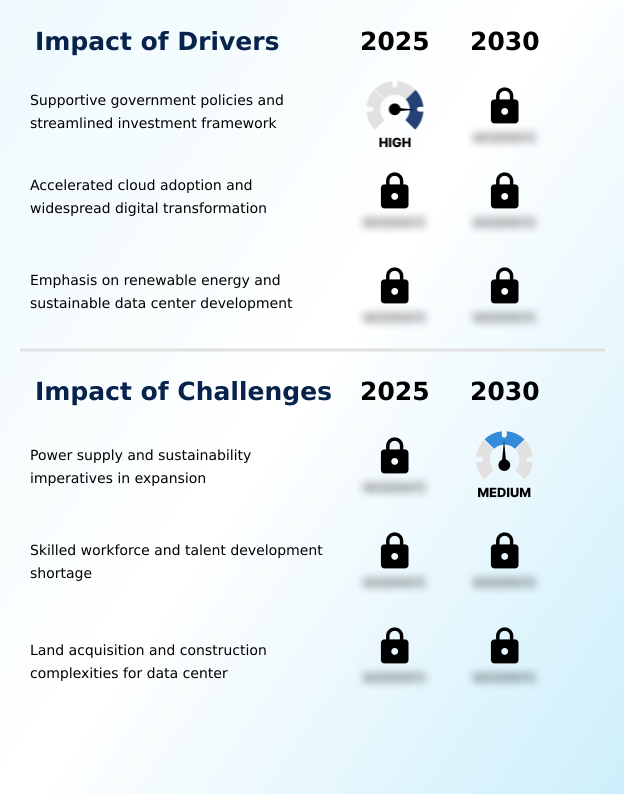
What are the key market drivers leading to the rise in the adoption of Malaysia Data Center Industry?
- Supportive government policies and a streamlined investment framework are key drivers stimulating significant growth and attracting investment into the market.
- Growth is strongly propelled by supportive government policies, including the data center investment framework and digital economy blueprint support. These digital transformation initiatives accelerate it infrastructure workload migration to third-party facilities.
- The government's national cloud computing policy further solidifies demand, encouraging enterprises to leverage colocation interconnection services and extensive cloud on-ramp connectivity. This environment ensures data sovereignty compliance and meets strict data residency requirements for regulated industries.
- Consequently, there is heightened investment in facilities offering tier 3 fault tolerance, which provides the N+1 redundancy needed for business continuity. Adoption of these services has enabled businesses to improve application availability by over 25% compared to legacy on-premise setups.
What are the market trends shaping the Malaysia Data Center Industry?
- The proliferation of artificial intelligence and the expansion of hyperscale cloud services are key trends. These developments are fundamentally reshaping infrastructure demands across the market.
- A defining trend is the proliferation of ai-ready data center design to support data-intensive technology workloads and enable ai-driven service scalability. This has led to a significant increase in rack power density, compelling a shift towards advanced liquid cooling technologies. Facilities are now engineered as high-performance computing infrastructure capable of handling complex analytics.
- Concurrently, the expansion of hyperscale cloud infrastructure is being complemented by a growing focus on edge computing architecture. This distributed model addresses the need for lower real-time data processing latency, with deployments showing up to a 40% reduction in data round-trip times for critical applications.
- The industry's path forward is also shaped by green data center development, integrating sustainability into core design principles.
What challenges does the Malaysia Data Center Industry face during its growth?
- Ensuring a stable and sustainable power supply to support rapid expansion presents a key challenge to the market's continued growth and operational reliability.
- A primary challenge is ensuring power grid infrastructure stability to support rapid expansion while advancing sustainable data center operations. Operators face pressure to improve power usage effectiveness (PUE), with top-tier facilities achieving PUE ratios below 1.4. This requires significant investment in uninterruptible power supply systems and integrated battery energy storage systems.
- Another constraint is the need for a robust skilled workforce talent pipeline to manage complex operations and maintain data center operational efficiency. On the technology front, managing high volumes of east-west traffic management inside the data center and ensuring it infrastructure security compliance are critical. The adoption of high-performance nvme-based flash storage also adds to power and cooling complexities.
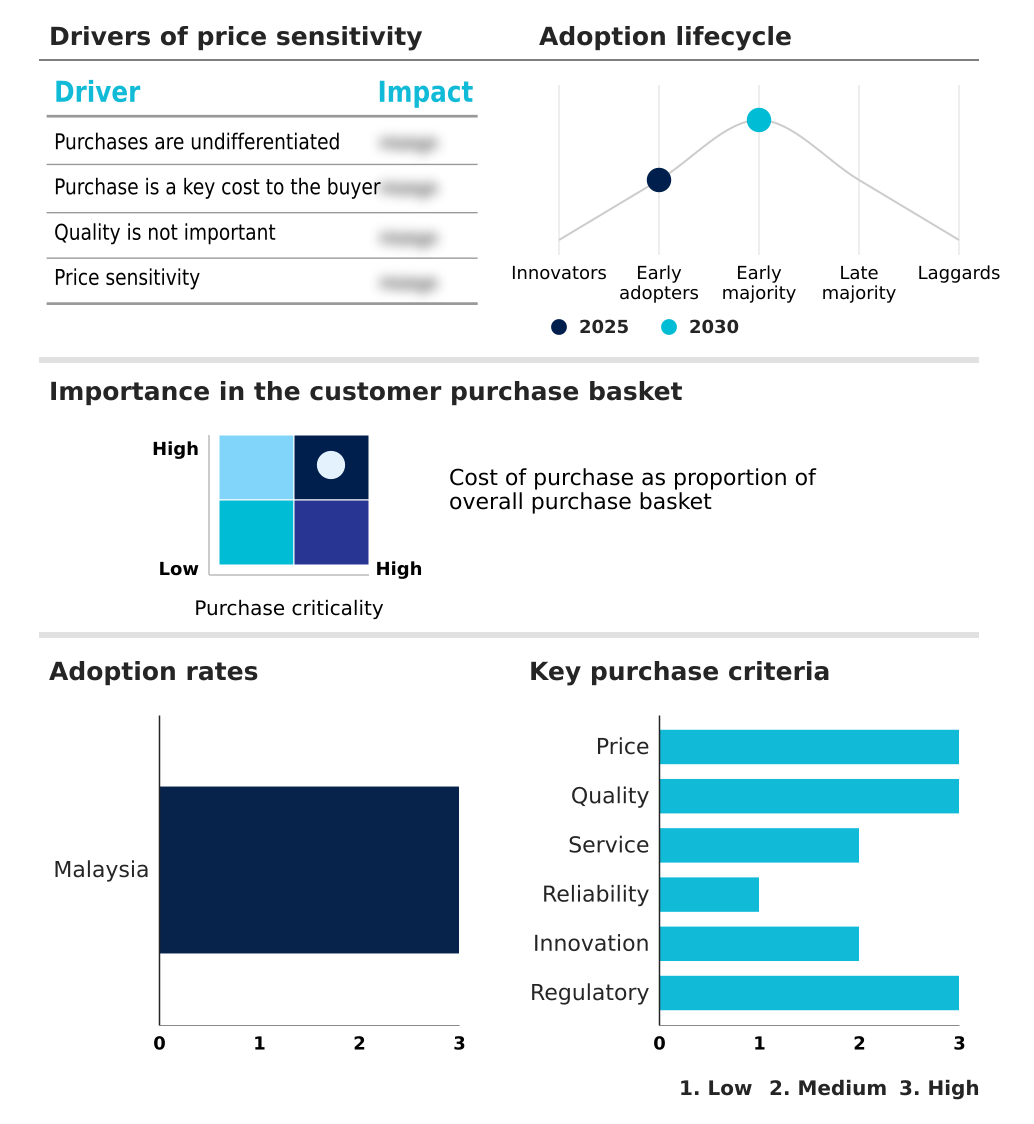
Exclusive Technavio Analysis on Customer Landscape
The malaysia data center market forecasting report includes the adoption lifecycle of the market, covering from the innovator’s stage to the laggard’s stage. It focuses on adoption rates in different regions based on penetration. Furthermore, the malaysia data center market report also includes key purchase criteria and drivers of price sensitivity to help companies evaluate and develop their market growth analysis strategies.
Customer Landscape of Malaysia Data Center Industry
Competitive Landscape
Companies are implementing various strategies, such as strategic alliances, malaysia data center market forecast, partnerships, mergers and acquisitions, geographical expansion, and product/service launches, to enhance their presence in the industry.
Amazon Web Services Inc. - Key offerings focus on delivering scalable, secure, and globally connected data center solutions, including colocation, hyperscale cloud infrastructure, and comprehensive IT services for enterprise modernization.
The industry research and growth report includes detailed analyses of the competitive landscape of the market and information about key companies, including:
- Amazon Web Services Inc.
- Bridge Data Centres
- Cisco Systems Inc.
- DXC Technology Co.
- Equinix Inc.
- GDS Holdings Ltd.
- Google LLC
- Huawei Technologies Co. Ltd.
- IBM Corp.
- Keppel Data Centres Pte. Ltd.
- Legrand SA
- Microsoft Corp.
- NEC Corp.
- Nippon Telegh and Teleph Corp.
- Vertiv Holdings Co.
Qualitative and quantitative analysis of companies has been conducted to help clients understand the wider business environment as well as the strengths and weaknesses of key industry players. Data is qualitatively analyzed to categorize companies as pure play, category-focused, industry-focused, and diversified; it is quantitatively analyzed to categorize companies as dominant, leading, strong, tentative, and weak.
Recent Development and News in Malaysia data center market
- In May 2025, Microsoft launched its Malaysia West Cloud region, a strategic move to provide in-country data residency, enhanced security, and low-latency services to accelerate national digital transformation.
- In May 2025, Google expanded its commitment to the region with a $236 million investment, partnering with Gamuda DC Infrastructure to develop a new hyperscale facility to meet growing cloud and AI demands.
- In July 2025, the Malaysian government announced the upcoming launch of a new Data Centre Framework, designed to streamline policies and designate the Malaysian Investment Development Authority as the central agency for project approvals.
- In December 2025, TotalEnergies and Google solidified a 21-year Power Purchase Agreement to supply Google's Malaysian data center operations with renewable energy from a newly developed solar plant.
Dive into Technavio’s robust research methodology, blending expert interviews, extensive data synthesis, and validated models for unparalleled Malaysia Data Center Market insights. See full methodology.
| Market Scope | |
|---|---|
| Page number | 227 |
| Base year | 2025 |
| Historic period | 2020-2024 |
| Forecast period | 2026-2030 |
| Growth momentum & CAGR | Accelerate at a CAGR of 22.9% |
| Market growth 2026-2030 | USD 7474.1 million |
| Market structure | Fragmented |
| YoY growth 2025-2026(%) | 19.4% |
| Key countries | Malaysia |
| Competitive landscape | Leading Companies, Market Positioning of Companies, Competitive Strategies, and Industry Risks |
Research Analyst Overview
- The data center market in Malaysia reflects a dynamic ecosystem where infrastructure is rapidly evolving to meet next-generation demands. The push for ai-ready data center design is compelling operators to adopt liquid cooling technologies to manage the high rack power density of modern servers.
- This shift is part of a broader move toward hyperscale cloud infrastructure and distributed edge computing architecture. At a facility level, decisions around implementing software-defined networking and network functions virtualization are critical for boardroom strategy, directly impacting agility and cost. We've seen deployments of hyper-converged infrastructure lead to a 20% reduction in provisioning times for new services.
- Furthermore, the integration of high-density server racks and modular power distribution units with uninterruptible power supply systems is crucial for reliability. The focus on power usage effectiveness and east-west traffic management within facilities using nvme-based flash storage highlights a commitment to both performance and efficiency.
- For enterprises, ensuring data sovereignty compliance and data residency requirements while utilizing colocation interconnection services, cloud on-ramp connectivity, and robust disaster recovery as a service is paramount.
- Security is addressed through network micro-segmentation alongside fault-tolerant designs like tier 3 fault tolerance and 2n+1 fully redundant infrastructure, while data management leverages software-defined storage solutions and object storage for unstructured data, all supported by battery energy storage systems.
What are the Key Data Covered in this Malaysia Data Center Market Research and Growth Report?
-
What is the expected growth of the Malaysia Data Center Market between 2026 and 2030?
-
USD 7.47 billion, at a CAGR of 22.9%
-
-
What segmentation does the market report cover?
-
The report is segmented by Type (Data center servers, Data center storage, Data center powering and cooling solutions, and Data center networking solutions), End-user (BFSI, IT and telecom, E-commerce, Government, and Others), Environment (Hyperscale, Colocation, Edge, and Others), Variant (Tier 3, Tier 1 and Tier 2, and Tier 4) and Geography (APAC)
-
-
Which regions are analyzed in the report?
-
APAC
-
-
What are the key growth drivers and market challenges?
-
Supportive government policies and streamlined investment framework, Power supply and sustainability imperatives in expansion
-
-
Who are the major players in the Malaysia Data Center Market?
-
Amazon Web Services Inc., Bridge Data Centres, Cisco Systems Inc., DXC Technology Co., Equinix Inc., GDS Holdings Ltd., Google LLC, Huawei Technologies Co. Ltd., IBM Corp., Keppel Data Centres Pte. Ltd., Legrand SA, Microsoft Corp., NEC Corp., Nippon Telegh and Teleph Corp. and Vertiv Holdings Co.
-
Market Research Insights
- The data center market in Malaysia is defined by rapid digital transformation initiatives and a widespread it infrastructure workload migration to more agile platforms. The government's national cloud computing policy is a significant catalyst, encouraging enterprises to adopt hybrid multi-cloud architectures. This shift supports data-intensive technology workloads and drives demand for high-performance computing infrastructure.
- Organizations leveraging modern facilities report up to a 25% improvement in data center operational efficiency and a 15% reduction in latency for mission-critical application hosting. The emphasis on a skilled workforce talent pipeline is crucial for managing this complex ecosystem, ensuring that sustainable data center operations and it infrastructure security compliance standards are met.
- This dynamic environment fosters innovation in data processing and storage capabilities and low-latency network connectivity.
We can help! Our analysts can customize this malaysia data center market research report to meet your requirements.
 RIA -
RIA - 
