Defoamers Market Analysis, Size, and Forecast 2025-2029: North America (US and Canada), Europe (France, Germany, Italy, and UK), Middle East and Africa (Egypt, KSA, Oman, and UAE), APAC (China, India, and Japan), South America (Argentina and Brazil), and Rest of World (ROW)

Defoamers Market Analysis, Size, and Forecast 2025-2029:
North America (US and Canada), Europe (France, Germany, Italy, and UK), Middle East and Africa (Egypt, KSA, Oman, and UAE), APAC (China, India, and Japan), South America (Argentina and Brazil), and Rest of World (ROW)

Published: Mar 2025 223 Pages SKU: IRTNTR70460

Market Overview at a Glance

$2.16 B
Market Opportunity
4.6%
CAGR
4.4
YoY growth 2024-2025(%)

Defoamers Market Size 2025-2029

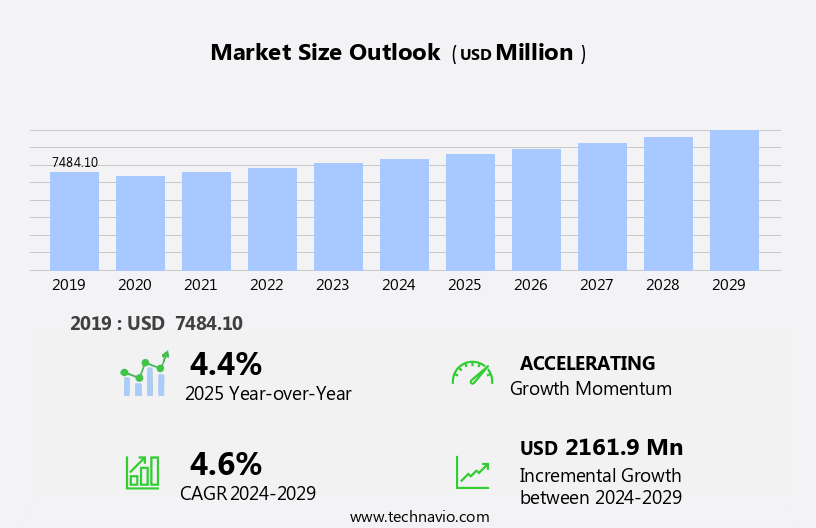
The defoamers market size is forecast to increase by USD 2.16 billion, at a CAGR of 4.6% between 2024 and 2029. The market is experiencing significant growth, driven primarily by the increasing adoption of water-based defoamers over their solvent-based counterparts. This shift is a response to the growing demand for eco-friendly coatings and additives, as companies prioritize sustainability in their operations.

Major Market Trends & Insights

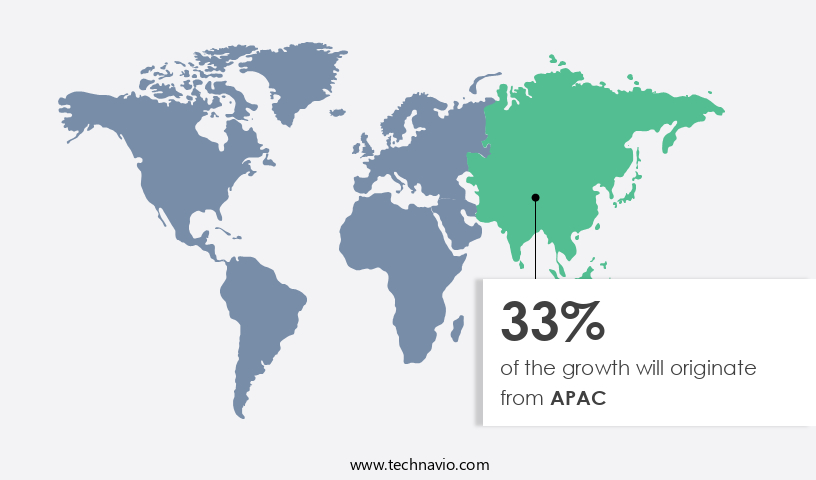
  • APAC  dominated the market and contributed 33% to the growth during the forecast period.
  • The market is expected to grow significantly in North America region as well over the forecast period.
  • Based on the Type, the Water-based segment led the market and was valued at USD 3.71 billion of the global revenue in 2023.
  • Based on the Application, the Architectural segment accounted for the largest market revenue share in 2023.

Market Size & Forecast

  • Market Opportunities: USD 42.17 Million
  • Future Opportunities: USD 2.16 Billion
  • CAGR (2024-2029): 4.6%
  • APAC: Largest market in 2023

The market continues to evolve in various sectors. However, market expansion is not without challenges. Stringent regulations concerning heavy and toxic metals pose a significant obstacle, necessitating the development of defoamers that meet these requirements. Companies seeking to capitalize on market opportunities must navigate these regulations effectively, while also addressing the ongoing demand for high-performance, cost-effective defoaming solutions. The market is anticipated to expand due to the growing demand for water-based defoamers in various industries, including construction and paints & coatings. The market is characterized by a growing preference for eco-friendly products, stringent regulations, and the need for innovative, compliant defoamer solutions. Companies that can successfully address these challenges will be well-positioned to capitalize on the market's potential for growth.

What will be the Size of the Defoamers Market during the forecast period?

Defoamers Market Size

Explore in-depth regional segment analysis with market size data - historical 2019-2023 and forecasts 2025-2029 - in the full report.  
Request Free Sample

The market continues to evolve, driven by the diverse demands of various sectors. Fatty acid defoamers, for instance, remain a popular choice in paint and coatings due to their effectiveness in reducing foam formation during application. Zeta potential plays a crucial role in determining the efficiency of these defoamers, influencing their ability to adhere to surfaces and optimize foam half-life. In the industrial sector, the application of defoamers extends to oil & gas production, where they help maintain stable foam conditions during processing. Polyether defoamers and fluorosilicone defoamers are commonly used in this context due to their high temperature stability and resistance to harsh conditions.

Cosmetic applications require defoamers that meet stringent regulatory compliance and offer excellent compatibility with formulations. Cosmetic defoamers, such as those based on zeta potential and silicone, ensure consistent product quality and enhance the overall user experience. Food processing industries rely on food grade defoamers to prevent foam formation in various applications, including water-based systems and food emulsions. The importance of maintaining foam density and stability is paramount to ensure efficient production and product quality. The market for defoamers is marked by continuous innovation and development, with ongoing research focusing on improving de-foaming efficiency, rheological properties, and chemical composition. This includes the development of high-performance defoamers, such as those based on siloxanes and polymeric materials, which offer enhanced stability and compatibility across a wide range of applications.

Regulatory compliance, quality control, and performance testing remain critical factors influencing market dynamics. As such, defoamer manufacturers must continually adapt to meet evolving industry standards and customer demands, ensuring their products deliver optimal results in various applications.

How is this Defoamers Industry segmented?

The defoamers industry research report provides comprehensive data (region-wise segment analysis), with forecasts and estimates in "USD million" for the period 2025-2029, as well as historical data from 2019-2023 for the following segments.

  • Type
    • Water-based
    • Silicone-based
    • Mineral-oil based
    • Others
  • Application
    • Architectural
    • Industrial
    • Wood and furniture
    • Automotive
    • Others
  • End-User
    • Industrial
    • Commercial
    • Institutional
  • Form
    • Liquid
    • Powder
  • Geography
    • North America
      • US
      • Canada
    • Europe
      • France
      • Germany
      • Italy
      • UK
    • Middle East and Africa
      • Egypt
      • KSA
      • Oman
      • UAE
    • APAC
      • China
      • India
      • Japan
    • South America
      • Argentina
      • Brazil
    • Rest of World (ROW)

By Type Insights

The water-based segment is estimated to witness significant growth during the forecast period. The segment was valued at USD 3.71 billion in 2023. It continued to the largest segment at a CAGR of 3.81%.

The market encompasses a range of products used to eliminate or reduce foam formation in various industries. Low temperature defoamers, formulated to function effectively in cold conditions, are essential in applications such as wastewater treatment and oil & gas production. Surface tension and rheology modifiers play a crucial role in optimizing defoamer performance. Proper storage conditions are necessary to maintain defoamer efficacy and ensure de-foaming efficiency. Industrial defoamers, including foam suppressants, antifoam agents, and foam inhibitors, are integral to numerous manufacturing processes in industries like chemical processing and food processing. Regulatory compliance and quality control are paramount in ensuring the safety and effectiveness of these defoamers.

Wetting agents, a type of de-foaming agent, are used to improve the spreading and wetting properties of liquids. The chemical composition of defoamers varies, with offerings such as acrylic defoamers, siloxane defoamers, silicone defoamers, and fatty acid defoamers catering to diverse application needs. Zeta potential and droplet size distribution are essential rheological properties that impact defoamer performance. Paint & coatings, adhesives & sealants, and pharmaceuticals are among the industries that rely on defoamers for foam control. Performance testing, including foam half-life and drainage rate, is crucial in evaluating defoamer effectiveness. Application methods, such as spraying, injection, or addition to the process stream, influence the choice of defoamer formulation.

Foam stabilizers and oil-based defoamers are alternative options for specific applications. In the evolving market landscape, eco-friendly defoamers, such as water-based and blended additives, are gaining popularity due to their low environmental impact and VOC content. These trends reflect the industry's commitment to sustainability and regulatory compliance.

Defoamers Market Size

Request Free Sample

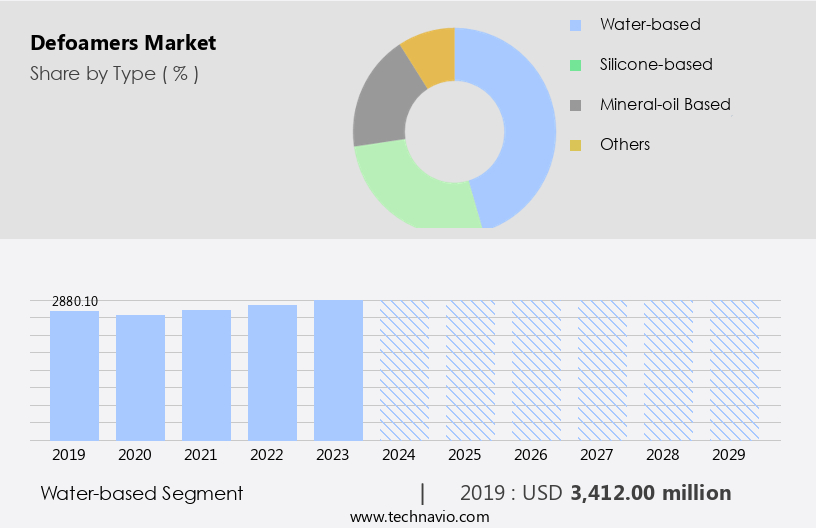
The Water-based segment was valued at USD 3.41 billion in 2019 and showed a gradual increase during the forecast period.

Regional Analysis

APAC is estimated to contribute 33% to the growth of the global market during the forecast period. Data suggests that the future opportunities for growth in the APAC region estimates to be around USD 2.85 billion. Technavio's analysts have elaborately explained the regional trends and drivers that shape the market during the forecast period.

Defoamers Market Share by Geography

 Request Free Sample

The market encompasses a range of products, including low temperature defoamers, surface tension agents, rheology modifiers, and foam control agents. These defoamers are utilized in various industries and applications, such as oil & gas, industrial processes, wastewater treatment, and manufacturing. The market is driven by the need to improve foam stability, reduce surface tension, and enhance rheological properties. De-foaming efficiency is a crucial factor in determining the effectiveness of defoamers. Storage conditions also play a significant role in maintaining the performance of defoamers. Viscosity modifiers and droplet size distribution are essential considerations in the selection and application of defoamers. Acrylic defoamers, siloxane defoamers, and silicone defoamers are commonly used types of defoamers.

Industrial defoamers, foam suppressants, antifoam agents, and de-foaming agents are employed in diverse industries to manage foam generation and improve process efficiency. Regulatory compliance and quality control are essential aspects of the market, ensuring the safety and efficacy of these products. The market for defoamers is expanding in response to the increasing demand from various industries. For instance, the paint & coatings sector relies on defoamers to improve the flow and leveling of coatings, while food processing requires defoamers to prevent foam formation during production. Water-based defoamers and solvent-based defoamers cater to the specific needs of these industries. In the oil & gas industry, defoamers are used to enhance the performance of drilling fluids and improve the efficiency of separation processes.

In the chemical processing sector, defoamers are employed to manage foam generation during manufacturing processes, ensuring optimal production and reducing downtime. Polymeric defoamers, polymer additives, and application methods are key areas of research and development in the market. Performance testing, foam inhibitors, and drainage rate are essential factors in evaluating the effectiveness of defoamers. The market for defoamers is expected to grow significantly due to the increasing demand for efficient and effective foam control agents in various industries.

Market Dynamics

The Defoamers Market is expanding, driven by demand for silicone defoamers and non-silicone defoamers in diverse applications like defoamers for wastewater treatment and food processing defoamers. Water-based defoamers and sustainable defoamer solutions cater to eco-conscious industries, while paints and coatings defoamers enhance product quality. The industrial defoamers market and food and beverage defoamers segment lead growth, supported by bio-based defoamers and eco-friendly defoamer formulations. Food-grade defoamers ensure safety in beverage production. Silicone defoamers for wastewater treatment, eco-friendly defoamers for food processing, non-silicone defoamers for paints and coatings, bio-based defoamers for agriculture, sustainable defoamer solutions for textiles, cost-effective defoamers for pulp and paper, and environmentally friendly defoamers 2025 drive market visibility and innovation.

Our researchers analyzed the data with 2024 as the base year, along with the key drivers, trends, and challenges. A holistic analysis of drivers will help companies refine their marketing strategies to gain a competitive advantage.

What are the key market drivers leading to the rise in the adoption of Defoamers Industry?

  • The market's growth is primarily attributed to the rising adoption of water-based defoamers in place of solvent-based alternatives. This shift is driven by various factors, including increased environmental regulations, health and safety concerns, and the growing demand for eco-friendly products. Water-based defoamers offer several advantages, such as lower toxicity, easier application, and reduced environmental impact, making them a preferred choice for many industries. Consequently, the market for defoamers is expected to expand significantly as more companies transition to these environmentally friendly options. 
  • In the water-based formulations of the paints and coatings industry, defoamers play a crucial role in preventing the formation of foam during manufacturing processes. With the industry's shift towards waterborne formulations due to environmental concerns and regulatory compliance, the demand for defoamers, particularly low-temperature defoamers, is on the rise. These defoamers help maintain the desired surface tension and rheological properties, ensuring efficient de-foaming and stability of the formulation. Rheology modifiers and viscosity modifiers are often used in conjunction with defoamers to optimize the formulation's viscosity and droplet size distribution. Proper storage conditions are essential to preserve the de-foaming efficiency and foam stability of these water-based formulations.
  • Wastewater treatment applications of defoamers are another significant market segment, where they help improve the efficiency of the treatment process by reducing foam formation and improving the contact angle between the water and the solid surfaces. Acrylic defoamers are commonly used due to their effectiveness and compatibility with a wide range of applications. The increasing focus on reducing VOC emissions in the paints and coatings industry, driven by regulatory requirements and environmental concerns, is expected to accelerate the adoption of waterborne defoamers. The industry's transition towards water-based formulations will continue during the forecast period, with Europe leading the way due to stringent VOC regulations.

What are the market trends shaping the Defoamers Industry?

  • The adoption of eco-friendly coatings and additives is an emerging trend in the market. Professionals predict an increasing demand for sustainable solutions in the coatings industry.
  • In the oil & gas and industrial sectors, the use of defoamers as foam suppressants, antifroth agents, and de-foaming agents is essential for various applications. Regulatory compliance and quality control are paramount in these industries, making the selection of appropriate defoamers crucial. Wetting agents, chemical composition, shelf life, and performance are key factors in choosing the right defoamer. Siloxane defoamers and silicone defoamers are popular choices due to their effectiveness and stability. Manufacturers are increasingly focusing on producing eco-friendly defoamers to meet the growing demand for green initiatives.
  • Water-based defoamers, such as those used in paints and coatings, are gaining popularity due to their emission-free properties. These defoamers are used in various industries, including adhesives and sealants, to ensure the production of high-quality, environmentally-friendly products. Ensuring the technical demands are met, manufacturers are developing encapsulated and stabilized defoamers for use in water-based coating systems and powder coatings.

What challenges does the Defoamers Industry face during its growth?

  • The strict regulations governing the use of heavy and toxic metals pose a significant challenge to the industry's growth. Adhering to these stringent guidelines adds to the operational costs and complexities, potentially hindering the industry's expansion. 
  • Defoamers, specifically fatty acid defoamers and polyether defoamers, are commonly used in various industries such as paint & coatings, cosmetics, food processing, and water-based systems to control and prevent the formation of foam. However, the use of these defoamers can pose environmental and health concerns. For instance, defoamers like fluorosilicone and silicone-based defoamers release volatile organic compounds (VOCs) and hazardous air pollutants (HAPs) during their production and application. Additionally, zeta potential and foam density can impact the effectiveness of defoamers. To address these concerns, regulatory authorities have imposed stringent regulations on the use of toxic compounds in defoamers.
  • For example, the product labeling must disclose the critical ingredients and their quantities, as per the Bureau of International Standards. Furthermore, high temperature defoamers and antifoaming agents are increasingly being used as alternatives due to their lower environmental impact and improved performance. Food grade defoamers are also gaining popularity in the food processing industry due to their safety and compatibility with food products. In summary, the defoamer market faces challenges related to environmental and health concerns due to the use of toxic compounds in defoamers. Regulatory authorities have responded by imposing regulations on product labeling and promoting the use of alternative defoamers with lower environmental impact and improved performance.

Exclusive Customer Landscape

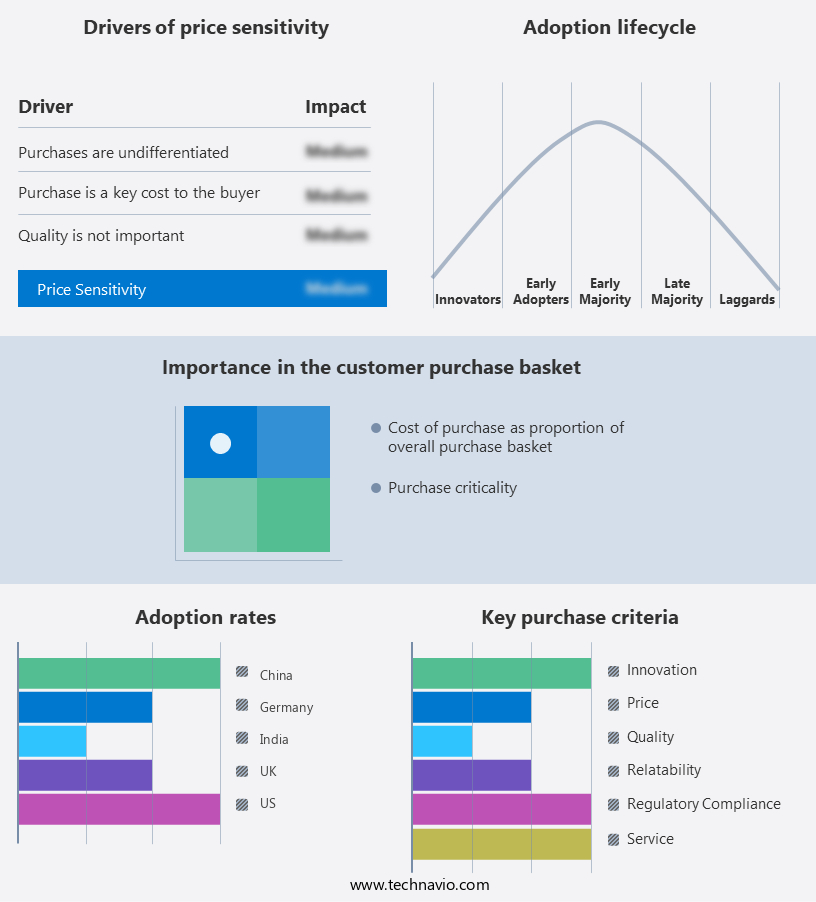
The defoamers market forecasting report includes the adoption lifecycle of the market, covering from the innovator's stage to the laggard's stage. It focuses on adoption rates in different regions based on penetration. Furthermore, the defoamers market report also includes key purchase criteria and drivers of price sensitivity to help companies evaluate and develop their market growth analysis strategies.

Defoamers Market Share by Geography

 Customer Landscape

Key Companies & Market Insights

Companies are implementing various strategies, such as strategic alliances, defoamers market forecast, partnerships, mergers and acquisitions, geographical expansion, and product/service launches, to enhance their presence in the industry.

Airedale Chemical Co. Ltd. - The company specializes in providing non-silicone based defoamers, including Air foam NSA antifoam, for effective textile defoaming and polyester dyeing processes. 

The industry research and growth report includes detailed analyses of the competitive landscape of the market and information about key companies, including:

  • Airedale Chemical Co. Ltd.
  • Ashland Inc.
  • Baker Hughes Co.
  • BASF SE
  • Buckman Laboratories lnternational Inc.
  • Clariant International Ltd.
  • Ecolab Inc.
  • Elementis Plc
  • Elkem ASA
  • Evonik Industries AG
  • Henkel AG and Co. KGaA
  • Huntsman Corp.
  • Kemira Oyj
  • Momentive Performance Materials
  • Quaker Houghton
  • Resil Chemicals Pvt. Ltd.
  • Shin Etsu Chemical Co. Ltd.
  • Supreme Silicones India Pvt Ltd.
  • The Dow Chemical Co.
  • Wacker Chemie AG

Qualitative and quantitative analysis of companies has been conducted to help clients understand the wider business environment as well as the strengths and weaknesses of key industry players. Data is qualitatively analyzed to categorize companies as pure play, category-focused, industry-focused, and diversified; it is quantitatively analyzed to categorize companies as dominant, leading, strong, tentative, and weak.

Recent Development and News in Defoamers Market

  • In January 2024, BASF SE, a leading chemical producer, announced the launch of its new defoamer product, "Neopar F 120 W," designed for use in water treatment applications. This innovation expanded BASF's defoamer portfolio and catered to the growing demand for sustainable water treatment solutions (BASF press release).
  • In March 2024, Clariant International AG and Wacker Chemicals AG entered into a strategic partnership to jointly develop and market defoamer products based on Wacker's silicone technology. This collaboration aimed to leverage both companies' expertise and broaden their market reach in the defoamers industry (Clariant press release).
  • In May 2024, Arkema SA, a major specialty chemicals company, completed the acquisition of the defoamers business of Ashland Global Holdings Inc. This deal expanded Arkema's footprint in the market and added Ashland's innovative defoamer technologies to its portfolio (Arkema press release).
  • In February 2025, the European Chemicals Agency (ECHA) approved the renewal of Dow Inc.'s authorization for its defoamer product, Dowicil 201. This approval ensured the continued availability of the product in the European market and demonstrated Dow's commitment to meeting regulatory requirements (Dow press release).

Research Analyst Overview

  • The market encompasses a range of products, including acrylic polymers, nonionic surfactants, sorbitan esters, and cationic surfactants, among others. Product lifecycle management is crucial in this industry, with propylene oxide and ethylene oxide used in the production of various defoamers. Particle size and separation efficiency are essential factors in ensuring optimal foam cell structure and emulsion stability. Nonionic surfactants, such as alkyl phenols and alkyl glycosides, offer synergistic effects in defoaming applications. Occupational safety and health & safety are paramount, with an increasing focus on customer loyalty and customization options. Regulatory affairs and environmental certifications are also significant trends, as companies seek to minimize the environmental impact of their products.
  • Marketing strategies and distribution networks play a vital role in the market, with brand building and sales channels essential for competitive advantages. Anionic surfactants, fluorinated siloxanes, and mineral oils are among the raw materials used in defoamer production. Pricing strategies and technical support are critical in maintaining customer needs and ensuring interfacial tension is optimized. Cationic surfactants and silicone polymers offer unique benefits in defoaming applications, while fatty acids and bubble size impact dispersion stability. Phase separation is a common challenge in the industry, requiring continuous innovation and technical expertise. Overall, the market is dynamic, with ongoing research and development efforts aimed at improving product performance and addressing evolving customer needs.

Dive into Technavio's robust research methodology, blending expert interviews, extensive data synthesis, and validated models for unparalleled Defoamers Market insights. See full methodology.

Market Scope

Report Coverage

Details

Page number

223

Base year

2024

Historic period

2019-2023

Forecast period

2025-2029

Growth momentum & CAGR

Accelerate at a CAGR of 4.6%

Market growth 2025-2029

USD 2161.9 million

Market structure

Fragmented

YoY growth 2024-2025(%)

4.4

Key countries

US, Canada, Germany, UK, Italy, France, China, India, Japan, Brazil, Egypt, UAE, Oman, Argentina, KSA, UAE, Brazil, and Rest of World (ROW)

Competitive landscape

Leading Companies, Market Positioning of Companies, Competitive Strategies, and Industry Risks

Request Free Sample

What are the Key Data Covered in this Defoamers Market Research and Growth Report?

  • CAGR of the Defoamers industry during the forecast period
  • Detailed information on factors that will drive the growth and forecasting between 2025 and 2029
  • Precise estimation of the size of the market and its contribution of the industry in focus to the parent market
  • Accurate predictions about upcoming growth and trends and changes in consumer behaviour
  • Growth of the market across APAC, North America, Europe, Middle East and Africa, and South America
  • Thorough analysis of the market's competitive landscape and detailed information about companies
  • Comprehensive analysis of factors that will challenge the defoamers market growth of industry companies

We can help! Our analysts can customize this defoamers market research report to meet your requirements.

Get in touch

1 Executive Summary

  • 1.1 Market overview
    • Executive Summary - Chart on Market Overview
    • Executive Summary - Data Table on Market Overview
    • Executive Summary - Chart on Global Market Characteristics
    • Executive Summary - Chart on Market by Geography
    • Executive Summary - Chart on Market Segmentation by Type
    • Executive Summary - Chart on Market Segmentation by Application
    • Executive Summary - Chart on Incremental Growth
    • Executive Summary - Data Table on Incremental Growth
    • Executive Summary - Chart on Company Market Positioning

2 Technavio Analysis

  • 2.1 Analysis of price sensitivity, lifecycle, customer purchase basket, adoption rates, and purchase criteria
    • Analysis of price sensitivity, lifecycle, customer purchase basket, adoption rates, and purchase criteria
  • 2.2 Criticality of inputs and Factors of differentiation
    • Overview on criticality of inputs and factors of differentiation
  • 2.3 Factors of disruption
    • Overview on factors of disruption
  • 2.4 Impact of drivers and challenges
    • Impact of drivers and challenges in 2024 and 2029

3 Market Landscape

  • 3.1 Market ecosystem
    • Parent Market
    • Data Table on - Parent Market
  • 3.2 Market characteristics
    • Market characteristics analysis
  • 3.3 Value chain analysis
    • Value chain analysis

4 Market Sizing

  • 4.1 Market definition
    • Offerings of companies included in the market definition
  • 4.2 Market segment analysis
    • Market segments
  • 4.3 Market size 2024
    • 4.4 Market outlook: Forecast for 2024-2029
      • Chart on Global - Market size and forecast 2024-2029 ($ million)
      • Data Table on Global - Market size and forecast 2024-2029 ($ million)
      • Chart on Global Market: Year-over-year growth 2024-2029 (%)
      • Data Table on Global Market: Year-over-year growth 2024-2029 (%)

    5 Historic Market Size

    • 5.1 Global Defoamers Market 2019 - 2023
      • Historic Market Size - Data Table on Global Defoamers Market 2019 - 2023 ($ million)
    • 5.2 Type segment analysis 2019 - 2023
      • Historic Market Size - Type Segment 2019 - 2023 ($ million)
    • 5.3 Application segment analysis 2019 - 2023
      • Historic Market Size - Application Segment 2019 - 2023 ($ million)
    • 5.4 Geography segment analysis 2019 - 2023
      • Historic Market Size - Geography Segment 2019 - 2023 ($ million)
    • 5.5 Country segment analysis 2019 - 2023
      • Historic Market Size - Country Segment 2019 - 2023 ($ million)

    6 Qualitative Analysis

    • 6.1 Impact of AI on the global defoamers market

      7 Five Forces Analysis

      • 7.1 Five forces summary
        • Five forces analysis - Comparison between 2024 and 2029
      • 7.2 Bargaining power of buyers
        • Bargaining power of buyers - Impact of key factors 2024 and 2029
      • 7.3 Bargaining power of suppliers
        • Bargaining power of suppliers - Impact of key factors in 2024 and 2029
      • 7.4 Threat of new entrants
        • Threat of new entrants - Impact of key factors in 2024 and 2029
      • 7.5 Threat of substitutes
        • Threat of substitutes - Impact of key factors in 2024 and 2029
      • 7.6 Threat of rivalry
        • Threat of rivalry - Impact of key factors in 2024 and 2029
      • 7.7 Market condition
        • Chart on Market condition - Five forces 2024 and 2029

      8 Market Segmentation by Type

      • 8.1 Market segments
        • Chart on Type - Market share (2024-2029) (%)
        • Data Table on Type - Market share (2024-2029) (%)
      • 8.2 Comparison by Type
        • Chart on Comparison by Type
        • Data Table on Comparison by Type
      • 8.3 Water-based - Market size and forecast (2024-2029)
        • Chart on Water-based - Market size and forecast (2024-2029) ($ million)
        • Data Table on Water-based - Market size and forecast (2024-2029) ($ million)
        • Chart on Water-based - Year-over-year growth (2024-2029) (%)
        • Data Table on Water-based - Year-over-year growth (2024-2029) (%)
      • 8.4 Silicone-based - Market size and forecast (2024-2029)
        • Chart on Silicone-based - Market size and forecast (2024-2029) ($ million)
        • Data Table on Silicone-based - Market size and forecast (2024-2029) ($ million)
        • Chart on Silicone-based - Year-over-year growth (2024-2029) (%)
        • Data Table on Silicone-based - Year-over-year growth (2024-2029) (%)
      • 8.5 Mineral-oil based - Market size and forecast (2024-2029)
        • Chart on Mineral-oil based - Market size and forecast (2024-2029) ($ million)
        • Data Table on Mineral-oil based - Market size and forecast (2024-2029) ($ million)
        • Chart on Mineral-oil based - Year-over-year growth (2024-2029) (%)
        • Data Table on Mineral-oil based - Year-over-year growth (2024-2029) (%)
      • 8.6 Others - Market size and forecast (2024-2029)
        • Chart on Others - Market size and forecast (2024-2029) ($ million)
        • Data Table on Others - Market size and forecast (2024-2029) ($ million)
        • Chart on Others - Year-over-year growth (2024-2029) (%)
        • Data Table on Others - Year-over-year growth (2024-2029) (%)
      • 8.7 Market opportunity by Type
        • Market opportunity by Type ($ million)
        • Data Table on Market opportunity by Type ($ million)

      9 Market Segmentation by Application

      • 9.1 Market segments
        • Chart on Application - Market share (2024-2029) (%)
        • Data Table on Application - Market share (2024-2029) (%)
      • 9.2 Comparison by Application
        • Chart on Comparison by Application
        • Data Table on Comparison by Application
      • 9.3 Architectural - Market size and forecast (2024-2029)
        • Chart on Architectural - Market size and forecast (2024-2029) ($ million)
        • Data Table on Architectural - Market size and forecast (2024-2029) ($ million)
        • Chart on Architectural - Year-over-year growth (2024-2029) (%)
        • Data Table on Architectural - Year-over-year growth (2024-2029) (%)
      • 9.4 Industrial - Market size and forecast (2024-2029)
        • Chart on Industrial - Market size and forecast (2024-2029) ($ million)
        • Data Table on Industrial - Market size and forecast (2024-2029) ($ million)
        • Chart on Industrial - Year-over-year growth (2024-2029) (%)
        • Data Table on Industrial - Year-over-year growth (2024-2029) (%)
      • 9.5 Wood and furniture - Market size and forecast (2024-2029)
        • Chart on Wood and furniture - Market size and forecast (2024-2029) ($ million)
        • Data Table on Wood and furniture - Market size and forecast (2024-2029) ($ million)
        • Chart on Wood and furniture - Year-over-year growth (2024-2029) (%)
        • Data Table on Wood and furniture - Year-over-year growth (2024-2029) (%)
      • 9.6 Automotive - Market size and forecast (2024-2029)
        • Chart on Automotive - Market size and forecast (2024-2029) ($ million)
        • Data Table on Automotive - Market size and forecast (2024-2029) ($ million)
        • Chart on Automotive - Year-over-year growth (2024-2029) (%)
        • Data Table on Automotive - Year-over-year growth (2024-2029) (%)
      • 9.7 Others - Market size and forecast (2024-2029)
        • Chart on Others - Market size and forecast (2024-2029) ($ million)
        • Data Table on Others - Market size and forecast (2024-2029) ($ million)
        • Chart on Others - Year-over-year growth (2024-2029) (%)
        • Data Table on Others - Year-over-year growth (2024-2029) (%)
      • 9.8 Market opportunity by Application
        • Market opportunity by Application ($ million)
        • Data Table on Market opportunity by Application ($ million)

      10 Market Segmentation by End-User

      • 10.1 Market segments
        • Chart on End-User - Market share (2024-2029) (%)
        • Data Table on End-User - Market share (2024-2029) (%)
      • 10.2 Comparison by End-User
        • Chart on Comparison by End-User
        • Data Table on Comparison by End-User
      • 10.3 Industrial - Market size and forecast (2024-2029)
        • Chart on Industrial - Market size and forecast (2024-2029) ($ million)
        • Data Table on Industrial - Market size and forecast (2024-2029) ($ million)
        • Chart on Industrial - Year-over-year growth (2024-2029) (%)
        • Data Table on Industrial - Year-over-year growth (2024-2029) (%)
      • 10.4 Commercial - Market size and forecast (2024-2029)
        • Chart on Commercial - Market size and forecast (2024-2029) ($ million)
        • Data Table on Commercial - Market size and forecast (2024-2029) ($ million)
        • Chart on Commercial - Year-over-year growth (2024-2029) (%)
        • Data Table on Commercial - Year-over-year growth (2024-2029) (%)
      • 10.5 Institutional - Market size and forecast (2024-2029)
        • Chart on Institutional - Market size and forecast (2024-2029) ($ million)
        • Data Table on Institutional - Market size and forecast (2024-2029) ($ million)
        • Chart on Institutional - Year-over-year growth (2024-2029) (%)
        • Data Table on Institutional - Year-over-year growth (2024-2029) (%)
      • 10.6 Market opportunity by End-User
        • Market opportunity by End-User ($ million)
        • Data Table on Market opportunity by End-User ($ million)

      11 Market Segmentation by Form

      • 11.1 Market segments
        • Chart on Form - Market share (2024-2029) (%)
        • Data Table on Form - Market share (2024-2029) (%)
      • 11.2 Comparison by Form
        • Chart on Comparison by Form
        • Data Table on Comparison by Form
      • 11.3 Liquid - Market size and forecast (2024-2029)
        • Chart on Liquid - Market size and forecast (2024-2029) ($ million)
        • Data Table on Liquid - Market size and forecast (2024-2029) ($ million)
        • Chart on Liquid - Year-over-year growth (2024-2029) (%)
        • Data Table on Liquid - Year-over-year growth (2024-2029) (%)
      • 11.4 Powder - Market size and forecast (2024-2029)
        • Chart on Powder - Market size and forecast (2024-2029) ($ million)
        • Data Table on Powder - Market size and forecast (2024-2029) ($ million)
        • Chart on Powder - Year-over-year growth (2024-2029) (%)
        • Data Table on Powder - Year-over-year growth (2024-2029) (%)
      • 11.5 Market opportunity by Form
        • Market opportunity by Form ($ million)
        • Data Table on Market opportunity by Form ($ million)

      12 Customer Landscape

      • 12.1 Customer landscape overview
        • Analysis of price sensitivity, lifecycle, customer purchase basket, adoption rates, and purchase criteria

      13 Geographic Landscape

      • 13.1 Geographic segmentation
        • Chart on Market share by geography 2024-2029 (%)
        • Data Table on Market share by geography 2024-2029 (%)
      • 13.2 Geographic comparison
        • Chart on Geographic comparison
        • Data Table on Geographic comparison
      • 13.3 APAC - Market size and forecast 2024-2029
        • Chart on APAC - Market size and forecast 2024-2029 ($ million)
        • Data Table on APAC - Market size and forecast 2024-2029 ($ million)
        • Chart on APAC - Year-over-year growth 2024-2029 (%)
        • Data Table on APAC - Year-over-year growth 2024-2029 (%)
      • 13.4 North America - Market size and forecast 2024-2029
        • Chart on North America - Market size and forecast 2024-2029 ($ million)
        • Data Table on North America - Market size and forecast 2024-2029 ($ million)
        • Chart on North America - Year-over-year growth 2024-2029 (%)
        • Data Table on North America - Year-over-year growth 2024-2029 (%)
      • 13.5 Europe - Market size and forecast 2024-2029
        • Chart on Europe - Market size and forecast 2024-2029 ($ million)
        • Data Table on Europe - Market size and forecast 2024-2029 ($ million)
        • Chart on Europe - Year-over-year growth 2024-2029 (%)
        • Data Table on Europe - Year-over-year growth 2024-2029 (%)
      • 13.6 Middle East and Africa - Market size and forecast 2024-2029
        • Chart on Middle East and Africa - Market size and forecast 2024-2029 ($ million)
        • Data Table on Middle East and Africa - Market size and forecast 2024-2029 ($ million)
        • Chart on Middle East and Africa - Year-over-year growth 2024-2029 (%)
        • Data Table on Middle East and Africa - Year-over-year growth 2024-2029 (%)
      • 13.7 South America - Market size and forecast 2024-2029
        • Chart on South America - Market size and forecast 2024-2029 ($ million)
        • Data Table on South America - Market size and forecast 2024-2029 ($ million)
        • Chart on South America - Year-over-year growth 2024-2029 (%)
        • Data Table on South America - Year-over-year growth 2024-2029 (%)
      • 13.8 US - Market size and forecast 2024-2029
        • Chart on US - Market size and forecast 2024-2029 ($ million)
        • Data Table on US - Market size and forecast 2024-2029 ($ million)
        • Chart on US - Year-over-year growth 2024-2029 (%)
        • Data Table on US - Year-over-year growth 2024-2029 (%)
      • 13.9 China - Market size and forecast 2024-2029
        • Chart on China - Market size and forecast 2024-2029 ($ million)
        • Data Table on China - Market size and forecast 2024-2029 ($ million)
        • Chart on China - Year-over-year growth 2024-2029 (%)
        • Data Table on China - Year-over-year growth 2024-2029 (%)
      • 13.10 Japan - Market size and forecast 2024-2029
        • Chart on Japan - Market size and forecast 2024-2029 ($ million)
        • Data Table on Japan - Market size and forecast 2024-2029 ($ million)
        • Chart on Japan - Year-over-year growth 2024-2029 (%)
        • Data Table on Japan - Year-over-year growth 2024-2029 (%)
      • 13.11 India - Market size and forecast 2024-2029
        • Chart on India - Market size and forecast 2024-2029 ($ million)
        • Data Table on India - Market size and forecast 2024-2029 ($ million)
        • Chart on India - Year-over-year growth 2024-2029 (%)
        • Data Table on India - Year-over-year growth 2024-2029 (%)
      • 13.12 Canada - Market size and forecast 2024-2029
        • Chart on Canada - Market size and forecast 2024-2029 ($ million)
        • Data Table on Canada - Market size and forecast 2024-2029 ($ million)
        • Chart on Canada - Year-over-year growth 2024-2029 (%)
        • Data Table on Canada - Year-over-year growth 2024-2029 (%)
      • 13.13 South Korea - Market size and forecast 2024-2029
        • Chart on South Korea - Market size and forecast 2024-2029 ($ million)
        • Data Table on South Korea - Market size and forecast 2024-2029 ($ million)
        • Chart on South Korea - Year-over-year growth 2024-2029 (%)
        • Data Table on South Korea - Year-over-year growth 2024-2029 (%)
      • 13.14 Germany - Market size and forecast 2024-2029
        • Chart on Germany - Market size and forecast 2024-2029 ($ million)
        • Data Table on Germany - Market size and forecast 2024-2029 ($ million)
        • Chart on Germany - Year-over-year growth 2024-2029 (%)
        • Data Table on Germany - Year-over-year growth 2024-2029 (%)
      • 13.15 UK - Market size and forecast 2024-2029
        • Chart on UK - Market size and forecast 2024-2029 ($ million)
        • Data Table on UK - Market size and forecast 2024-2029 ($ million)
        • Chart on UK - Year-over-year growth 2024-2029 (%)
        • Data Table on UK - Year-over-year growth 2024-2029 (%)
      • 13.16 France - Market size and forecast 2024-2029
        • Chart on France - Market size and forecast 2024-2029 ($ million)
        • Data Table on France - Market size and forecast 2024-2029 ($ million)
        • Chart on France - Year-over-year growth 2024-2029 (%)
        • Data Table on France - Year-over-year growth 2024-2029 (%)
      • 13.17 Italy - Market size and forecast 2024-2029
        • Chart on Italy - Market size and forecast 2024-2029 ($ million)
        • Data Table on Italy - Market size and forecast 2024-2029 ($ million)
        • Chart on Italy - Year-over-year growth 2024-2029 (%)
        • Data Table on Italy - Year-over-year growth 2024-2029 (%)
      • 13.18 Market opportunity by geography
        • Market opportunity by geography ($ million)
        • Data Tables on Market opportunity by geography ($ million)
      • 13.19 Brazil - Market size and forecast (2024-2029)
        • Chart on Brazil - Market size and forecast (2024-2029) ($ million)
        • Data Table on Brazil - Market size and forecast (2024-2029) ($ million)
        • Chart on Brazil - Year-over-year growth (2024-2029) (%)
        • Data Table on Brazil - Year-over-year growth (2024-2029) (%)
      • 13.20 Egypt - Market size and forecast (2024-2029)
        • Chart on Egypt - Market size and forecast (2024-2029) ($ million)
        • Data Table on Egypt - Market size and forecast (2024-2029) ($ million)
        • Chart on Egypt - Year-over-year growth (2024-2029) (%)
        • Data Table on Egypt - Year-over-year growth (2024-2029) (%)
      • 13.21 UAE - Market size and forecast (2024-2029)
        • Chart on UAE - Market size and forecast (2024-2029) ($ million)
        • Data Table on UAE - Market size and forecast (2024-2029) ($ million)
        • Chart on UAE - Year-over-year growth (2024-2029) (%)
        • Data Table on UAE - Year-over-year growth (2024-2029) (%)
      • 13.22 Oman - Market size and forecast (2024-2029)
        • Chart on Oman - Market size and forecast (2024-2029) ($ million)
        • Data Table on Oman - Market size and forecast (2024-2029) ($ million)
        • Chart on Oman - Year-over-year growth (2024-2029) (%)
        • Data Table on Oman - Year-over-year growth (2024-2029) (%)
      • 13.23 Argentina - Market size and forecast (2024-2029)
        • Chart on Argentina - Market size and forecast (2024-2029) ($ million)
        • Data Table on Argentina - Market size and forecast (2024-2029) ($ million)
        • Chart on Argentina - Year-over-year growth (2024-2029) (%)
        • Data Table on Argentina - Year-over-year growth (2024-2029) (%)
      • 13.24 KSA - Market size and forecast (2024-2029)
        • Chart on KSA - Market size and forecast (2024-2029) ($ million)
        • Data Table on KSA - Market size and forecast (2024-2029) ($ million)
        • Chart on KSA - Year-over-year growth (2024-2029) (%)
        • Data Table on KSA - Year-over-year growth (2024-2029) (%)
      • 13.25 Rest of World (ROW) - Market size and forecast (2024-2029)
        • Chart on Rest of World (ROW) - Market size and forecast (2024-2029) ($ million)
        • Data Table on Rest of World (ROW) - Market size and forecast (2024-2029) ($ million)
        • Chart on Rest of World (ROW) - Year-over-year growth (2024-2029) (%)
        • Data Table on Rest of World (ROW) - Year-over-year growth (2024-2029) (%)

      14 Drivers, Challenges, and Opportunity/Restraints

      • 14.1 Market drivers
        • 14.2 Market challenges
          • 14.3 Impact of drivers and challenges
            • Impact of drivers and challenges in 2024 and 2029
          • 14.4 Market opportunities/restraints

            15 Competitive Landscape

            • 15.1 Overview
              • 15.2 Competitive Landscape
                • Overview on criticality of inputs and factors of differentiation
              • 15.3 Landscape disruption
                • Overview on factors of disruption
              • 15.4 Industry risks
                • Impact of key risks on business

              16 Competitive Analysis

              • 16.1 Companies profiled
                • Companies covered
              • 16.2 Company ranking index
                • Company ranking index
              • 16.3 Market positioning of companies
                • Matrix on companies position and classification
              • 16.4 Airedale Chemical Co. Ltd.
                • Airedale Chemical Co. Ltd. - Overview
                • Airedale Chemical Co. Ltd. - Product / Service
                • Airedale Chemical Co. Ltd. - Key offerings
                • SWOT
              • 16.5 Baker Hughes Co.
                • Baker Hughes Co. - Overview
                • Baker Hughes Co. - Business segments
                • Baker Hughes Co. - Key news
                • Baker Hughes Co. - Key offerings
                • Baker Hughes Co. - Segment focus
                • SWOT
              • 16.6 BASF SE
                • BASF SE - Overview
                • BASF SE - Business segments
                • BASF SE - Key news
                • BASF SE - Key offerings
                • BASF SE - Segment focus
                • SWOT
              • 16.7 Buckman Laboratories lnternational Inc.
                • Buckman Laboratories lnternational Inc. - Overview
                • Buckman Laboratories lnternational Inc. - Product / Service
                • Buckman Laboratories lnternational Inc. - Key offerings
                • SWOT
              • 16.8 Clariant International Ltd.
                • Clariant International Ltd. - Overview
                • Clariant International Ltd. - Business segments
                • Clariant International Ltd. - Key news
                • Clariant International Ltd. - Key offerings
                • Clariant International Ltd. - Segment focus
                • SWOT
              • 16.9 Elementis Plc
                • Elementis Plc - Overview
                • Elementis Plc - Business segments
                • Elementis Plc - Key news
                • Elementis Plc - Key offerings
                • Elementis Plc - Segment focus
                • SWOT
              • 16.10 Elkem ASA
                • Elkem ASA - Overview
                • Elkem ASA - Business segments
                • Elkem ASA - Key offerings
                • Elkem ASA - Segment focus
                • SWOT
              • 16.11 Evonik Industries AG
                • Evonik Industries AG - Overview
                • Evonik Industries AG - Business segments
                • Evonik Industries AG - Key news
                • Evonik Industries AG - Key offerings
                • Evonik Industries AG - Segment focus
                • SWOT
              • 16.12 Henkel AG and Co. KGaA
                • Henkel AG and Co. KGaA - Overview
                • Henkel AG and Co. KGaA - Business segments
                • Henkel AG and Co. KGaA - Key news
                • Henkel AG and Co. KGaA - Key offerings
                • Henkel AG and Co. KGaA - Segment focus
                • SWOT
              • 16.13 Huntsman Corp.
                • Huntsman Corp. - Overview
                • Huntsman Corp. - Business segments
                • Huntsman Corp. - Key news
                • Huntsman Corp. - Key offerings
                • Huntsman Corp. - Segment focus
                • SWOT
              • 16.14 Kemira Oyj
                • Kemira Oyj - Overview
                • Kemira Oyj - Business segments
                • Kemira Oyj - Key offerings
                • Kemira Oyj - Segment focus
                • SWOT
              • 16.15 Momentive Performance Materials
                • Momentive Performance Materials - Overview
                • Momentive Performance Materials - Product / Service
                • Momentive Performance Materials - Key offerings
                • SWOT
              • 16.16 Quaker Houghton
                • Quaker Houghton - Overview
                • Quaker Houghton - Business segments
                • Quaker Houghton - Key offerings
                • Quaker Houghton - Segment focus
                • SWOT
              • 16.17 The Dow Chemical Co.
                • The Dow Chemical Co. - Overview
                • The Dow Chemical Co. - Business segments
                • The Dow Chemical Co. - Key news
                • The Dow Chemical Co. - Key offerings
                • The Dow Chemical Co. - Segment focus
                • SWOT
              • 16.18 Wacker Chemie AG
                • Wacker Chemie AG - Overview
                • Wacker Chemie AG - Business segments
                • Wacker Chemie AG - Key news
                • Wacker Chemie AG - Key offerings
                • Wacker Chemie AG - Segment focus
                • SWOT

              17 Appendix

              • 17.1 Scope of the report
                • 17.2 Inclusions and exclusions checklist
                  • Inclusions checklist
                  • Exclusions checklist
                • 17.3 Currency conversion rates for US$
                  • Currency conversion rates for US$
                • 17.4 Research methodology
                  • Research methodology
                • 17.5 Data procurement
                  • Information sources
                • 17.6 Data validation
                  • Data validation
                • 17.7 Validation techniques employed for market sizing
                  • Validation techniques employed for market sizing
                • 17.8 Data synthesis
                  • Data synthesis
                • 17.9 360 degree market analysis
                  • 360 degree market analysis
                • 17.10 List of abbreviations
                  • List of abbreviations

                Research Methodology

                Technavio presents a detailed picture of the market by way of study, synthesis, and summation of data from multiple sources. The analysts have presented the various facets of the market with a particular focus on identifying the key industry influencers. The data thus presented is comprehensive, reliable, and the result of extensive research, both primary and secondary.

                INFORMATION SOURCES

                Primary sources

                • Manufacturers and suppliers
                • Channel partners
                • Industry experts
                • Strategic decision makers

                Secondary sources

                • Industry journals and periodicals
                • Government data
                • Financial reports of key industry players
                • Historical data
                • Press releases

                DATA ANALYSIS

                Data Synthesis

                • Collation of data
                • Estimation of key figures
                • Analysis of derived insights

                Data Validation

                • Triangulation with data models
                • Reference against proprietary databases
                • Corroboration with industry experts

                REPORT WRITING

                Qualitative

                • Market drivers
                • Market challenges
                • Market trends
                • Five forces analysis

                Quantitative

                • Market size and forecast
                • Market segmentation
                • Geographical insights
                • Competitive landscape

                Interested in this report?

                Get your sample now to see our research methodology and insights!

                Download Now

                Frequently Asked Questions

                Defoamers market growth will increase by $ 2161.9 mn during 2025-2029 .

                The Defoamers market is expected to grow at a CAGR of 4.6% during 2025-2029 .

                Defoamers market is segmented by Type( Water-based, Silicone-based, Mineral-oil based, Others) Application( Architectural, Industrial, Wood and furniture, Automotive, Others)

                Airedale Chemical Co. Ltd., Ashland Inc., Baker Hughes Co., BASF SE, Buckman Laboratories lnternational Inc., Clariant International Ltd., Ecolab Inc., Elementis Plc, Elkem ASA, Evonik Industries AG, Henkel AG and Co. KGaA, Huntsman Corp., Kemira Oyj, Momentive Performance Materials, Quaker Houghton, Resil Chemicals Pvt. Ltd., Shin Etsu Chemical Co. Ltd., Supreme Silicones India Pvt Ltd., The Dow Chemical Co., Wacker Chemie AG are a few of the key vendors in the Defoamers market.

                APAC will register the highest growth rate of 33% among the other regions. Therefore, the Defoamers market in APAC is expected to garner significant business opportunities for the vendors during the forecast period.

                US, Canada, Germany, UK, Italy, France, China, India, Japan, Brazil, Egypt, UAE, Oman, Argentina, KSA, UAE, Brazil, Rest of World (ROW)

                • Increasing adoption of water-based defoamers over solvent-based defoamersIn water-based formulations is the driving factor this market.
                • water replaces organic solvents. This results in a reduction of solvent-based VOC emissions is the driving factor this market.
                • which ultimately reduces the adverse effects of defoamers on the environment. Initially is the driving factor this market.
                • only 20% of the overall paints and coatings applications used waterborne defoamers.The paints and coatings industry are expected to experience a complete transition from solvent-based formulations to water-based formulations during the forecast period. This shift will primarily be seen in Europe as automobile manufacturers are under obligation to meet the European Unions VOC guidelines framed in 2007. For instance is the driving factor this market.
                • in March 2025 is the driving factor this market.
                • the European Commission unveiled an action plan aimed at enhancing the European car industrys access to essential strategic technologies is the driving factor this market.
                • such as batteries is the driving factor this market.
                • software is the driving factor this market.
                • and autonomous driving is the driving factor this market.
                • while also reducing regulatory obstacles. The adoption of water-based formulations will also increase in South Korea and Japan as automobile manufacturers are focusing on developing eco-friendly is the driving factor this market.
                • defoamer-based paints and coatings.There is an ongoing shift toward formulations with a low VOC content to reduce the level of harmful emissions into the environment. The demand for water-based formulation in defoamers will continue to rise is the driving factor this market.
                • owing to the growing importance of reducing solvent-based VOC emissions. Such factors are expected to drive the growth of the global defoamers market during the forecast period. is the driving factor this market.

                The Defoamers market vendors should focus on grabbing business opportunities from the Water-based segment as it accounted for the largest market share in the base year.