Dental Surgical Equipment Market Analysis, Size, and Forecast 2025-2029: North America (US, Canada, and Mexico), Europe (Germany, UK, and France), APAC (China, Japan, and India), South America (Brazil and Argentina), Middle East and Africa (Saudi Arabia, UAE, and South Africa), Asia, Rest of World (ROW)

Dental Surgical Equipment Market Analysis, Size, and Forecast 2025-2029:
North America (US, Canada, and Mexico), Europe (Germany, UK, and France), APAC (China, Japan, and India), South America (Brazil and Argentina), Middle East and Africa (Saudi Arabia, UAE, and South Africa), Asia, Rest of World (ROW)

Published: Dec 2025 293 Pages SKU: IRTNTR44110

Market Overview at a Glance

$2.74 B
Market Opportunity
8.4%
CAGR 2024 - 2029
40.7%
North America Growth
$4.73 B
Dental systems and equipment segment 2023

Dental Surgical Equipment Market Size 2025-2029

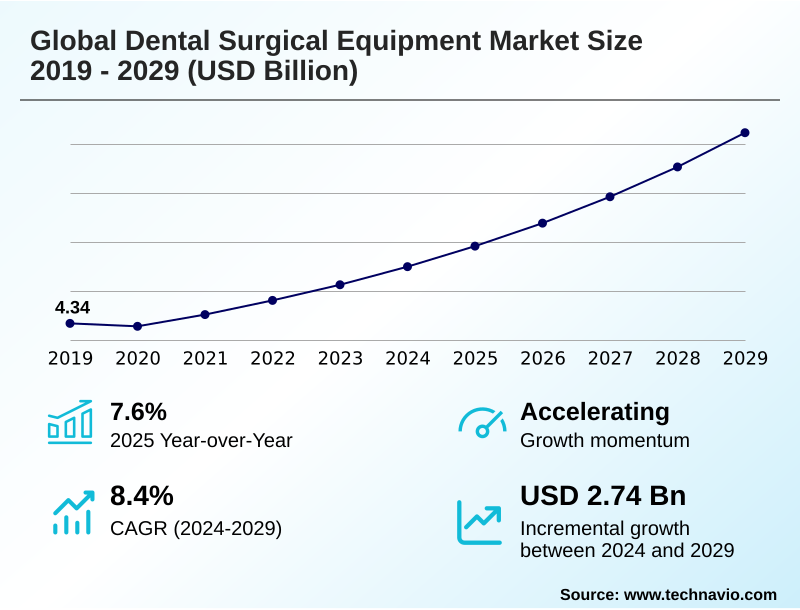
The dental surgical equipment market size is valued to increase by USD 2.74 billion, at a CAGR of 8.4% from 2024 to 2029. Increasing prevalence of dental diseases and related risk factors will drive the dental surgical equipment market.

Major Market Trends & Insights

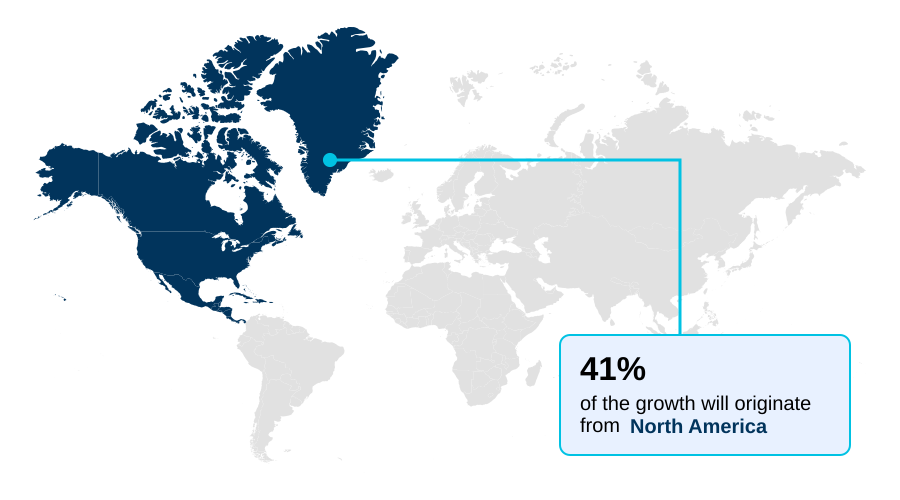
  • North America dominated the market and accounted for a 40.7% growth during the forecast period.
  • By Product - Dental systems and equipment segment was valued at USD 4.73 billion in 2023
  • By End-user - Clinics segment accounted for the largest market revenue share in 2023

Market Size & Forecast

  • Market Opportunities: USD 3.89 billion
  • Market Future Opportunities: USD 2.74 billion
  • CAGR from 2024 to 2029 : 8.4%

Market Summary

  • The dental surgical equipment market is defined by a continuous drive toward procedural precision and enhanced patient outcomes. A core driver is the rising incidence of oral diseases, which necessitates sophisticated interventions from restorative dentistry workflows to complex maxillofacial reconstructive surgery.
  • This demand is met by rapid technological evolution, particularly in digital dentistry integration, where tools like cone beam computed tomography and intraoral scanners are becoming standard for evidence-based treatment planning. These systems facilitate minimally invasive dentistry and enable the use of advanced biomaterials for bone grafting.
  • A significant trend is the adoption of chairside fabrication, where a clinic can design, mill, and place a permanent restoration in a single visit, drastically improving clinical workflow efficiency. However, the high capital equipment investment required for technologies such as robotic-assisted implant surgery and dental operating microscopes presents a considerable challenge.
  • Many practices must balance the clear benefits of enhanced diagnostic accuracy and procedural predictability against significant dental clinic overhead management, influencing procurement decisions between new and refurbished dental equipment market options.

What will be the Size of the Dental Surgical Equipment Market during the forecast period?

Get Key Insights on Market Forecast (PDF) Request Free Sample

How is the Dental Surgical Equipment Market Segmented?

The dental surgical equipment industry research report provides comprehensive data (region-wise segment analysis), with forecasts and estimates in "USD million" for the period 2025-2029, as well as historical data from 2019-2023 for the following segments.

  • Product
    • Dental systems and equipment
    • Dental lasers
  • End-user
    • Clinics
    • Hospitals
  • Therapeutic area
    • Restorative dentistry
    • Orthodontics
    • Endodontics
    • Prosthodontics
    • Others
  • Geography
    • North America
      • US
      • Canada
      • Mexico
    • Europe
      • Germany
      • UK
      • France
    • Asia
    • Rest of World (ROW)

By Product Insights

The dental systems and equipment segment is estimated to witness significant growth during the forecast period.

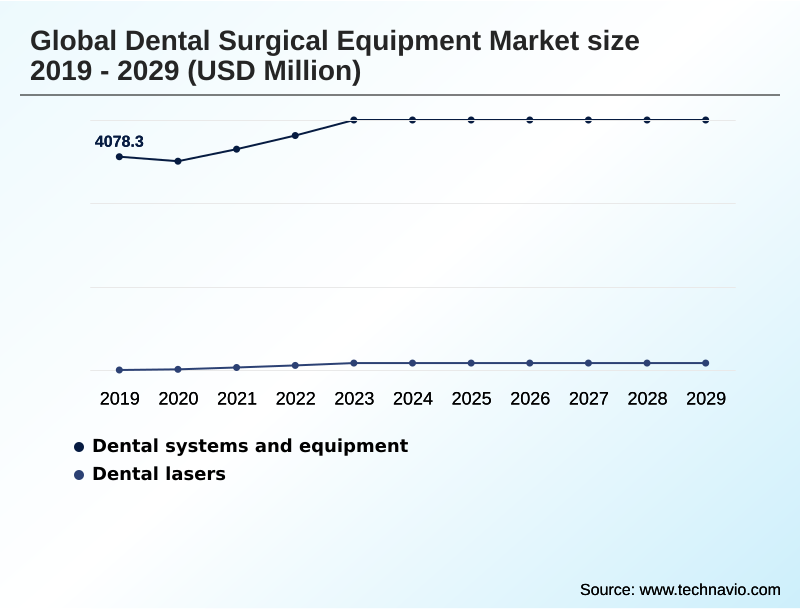
The dental surgical equipment market is segmented by product into dental systems and equipment, and dental lasers.

The dental systems and equipment segment, which includes advanced cad/cam dental systems and chairside dental milling units, is driven by the pursuit of clinical workflow efficiency.

Innovations in this area focus on integrating digital impression systems with fabrication processes, achieving over 99% dimensional stability in 3d printed surgical guides. This allows for the creation of patient-specific implants and enhances restorative dentistry workflows.

The segment also covers foundational equipment where dental practice ergonomics are critical.

Meanwhile, the dental lasers segment, encompassing both soft tissue lasers and all-tissue dental lasers, is expanding due to its applications in minimally invasive dentistry, offering significant advantages in periodontal regenerative procedures and reducing post-operative recovery improvement.

Request Free Sample

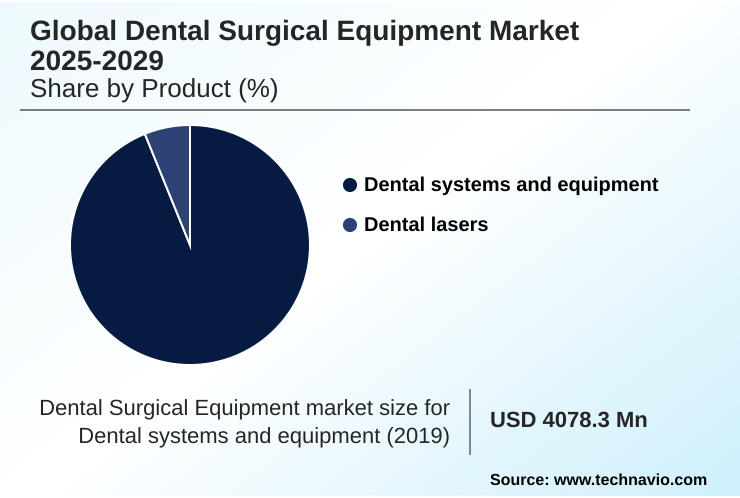
The Dental systems and equipment segment was valued at USD 4.73 billion in 2023 and showed a gradual increase during the forecast period.

Request Free Sample

Regional Analysis

North America is estimated to contribute 40.7% to the growth of the global market during the forecast period.Technavio’s analysts have elaborately explained the regional trends and drivers that shape the market during the forecast period.

See How Dental Surgical Equipment Market Demand is Rising in North America Request Free Sample

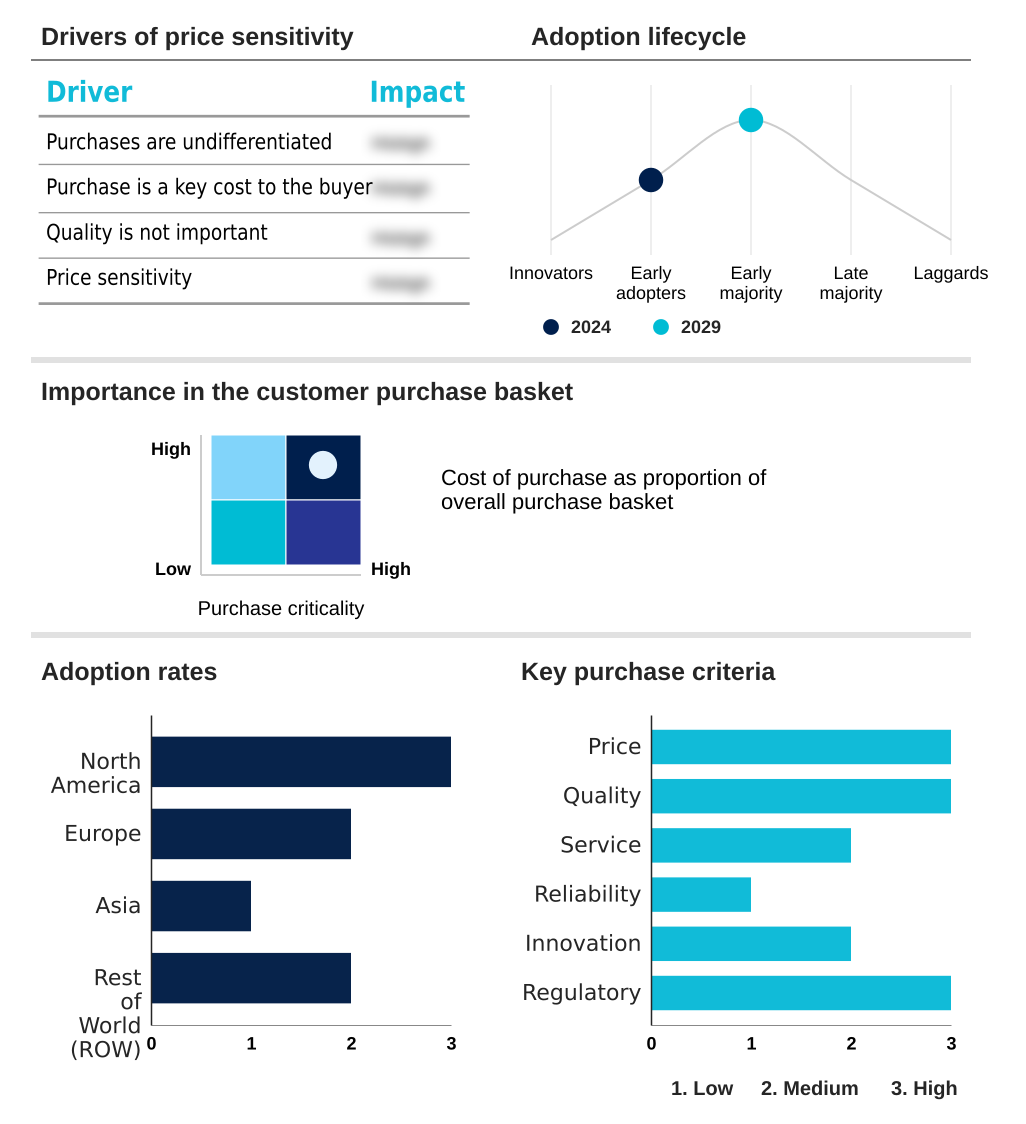
The geographic landscape of the market is characterized by varied adoption rates and investment priorities.

North America accounts for over 40% of the market's incremental growth, driven by high healthcare expenditure and the widespread adoption of digital dentistry integration, with advanced digital workflows reducing prosthetic turnaround times by more than 50% in many clinics.

Europe follows, with a strong emphasis on high-quality engineering and procedural predictability, particularly in its well-established private dental practice economics.

The Asia region presents a dynamic environment where rising healthcare investment fuels demand for a broad range of technologies, from foundational dental autoclaves to advanced endodontic motors.

In the Rest of World, which includes burgeoning markets in South America and the Middle East, the focus is often on capital equipment investment that balances cost with performance, influencing dental service organization procurement strategies.

Market Dynamics

Our researchers analyzed the data with 2024 as the base year, along with the key drivers, trends, and challenges. A holistic analysis of drivers will help companies refine their marketing strategies to gain a competitive advantage.

  • Strategic decision-making in the dental surgical equipment market is increasingly complex, shaped by a confluence of technological, economic, and clinical factors. A key consideration for many practices is the total cost of dental implant surgery equipment, which extends beyond the initial purchase to include ongoing maintenance costs for CAD CAM systems and the need for specialized dental professional training programs.
  • The benefits of using dental lasers for soft tissue management with lasers are well-documented, yet their adoption is weighed against the initial investment. Similarly, comparing intraoral scanner accuracy levels is a critical step in procurement, as this directly impacts the efficacy of a digital workflow for crown fabrication.
  • The return on investment (roi) on chairside milling systems is a major discussion point, balancing convenience against cost. In endodontics, the endodontic success rate with microscopes is driving their integration into practice. The industry also sees innovation in foundational areas, with ongoing improvements in the ergonomics of dental operator stools and advances in dental suction systems.
  • Technology such as cbct radiation dose reduction techniques and navigational systems in implantology are changing standards of care. Simultaneously, challenges in digital impression taking persist, while trends in dental local anesthesia delivery continue to evolve. The rise of 3d printing for orthodontic aligners and new material selection for 3d printed crowns highlight the shift toward customized, patient-centric solutions.

What are the key market drivers leading to the rise in the adoption of Dental Surgical Equipment Industry?

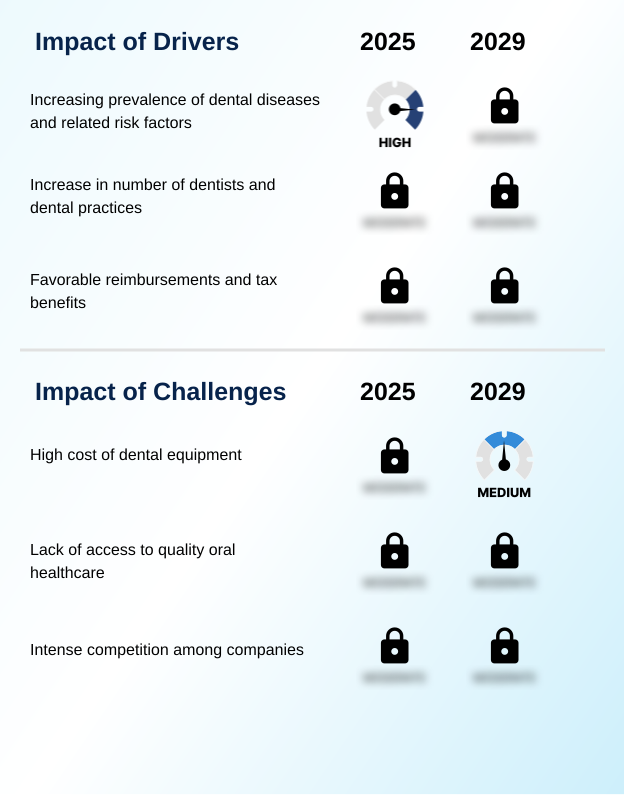
  • The increasing prevalence of dental diseases and their associated risk factors is a key driver fueling market growth.

  • Market growth is fundamentally driven by the high global prevalence of oral diseases and an expanding geriatric population.
  • Data indicates that approximately three out of every 10 individuals aged 65-74 have complete tooth loss, creating sustained demand for prosthodontic rehabilitation and dental implant motors.
  • Additionally, with an average of seven in 10 schoolchildren experiencing tooth decay, the need for restorative dentistry workflows is constant. This clinical demand is supported by favorable reimbursement policies and an increasing number of dental professionals worldwide.
  • This expansion of the dental workforce, coupled with greater public awareness, fuels capital equipment investment in technologies that support both foundational procedures and complex interventions like maxillofacial reconstructive surgery and endodontic retreatment protocols.

What are the market trends shaping the Dental Surgical Equipment Industry?

  • Technological advances and a consistent stream of new product launches are prominent trends shaping the market. These innovations are enhancing procedural efficiency and expanding treatment capabilities.

  • Key trends are reshaping the market, driven by innovations that enhance precision and efficiency. The adoption of 3D printing technologies is accelerating, with new systems reducing material consumption by up to 85% compared to traditional subtractive manufacturing. This technology is central to producing patient-matched medical devices and surgical guides.
  • Another significant development is the integration of robotic-assisted implant surgery, which improves procedural predictability. Furthermore, advancements in intraoral scanners and digital smile design software are streamlining prosthodontic rehabilitation and same-day restorations.
  • Strategic mergers and acquisitions are also prevalent, enabling companies to consolidate technologies like photobiomodulation therapy and expand their global footprint, thereby influencing private dental practice economics and fostering a more competitive landscape focused on integrated digital solutions.

What challenges does the Dental Surgical Equipment Industry face during its growth?

  • The high cost associated with advanced dental equipment poses a significant challenge to market adoption and industry growth.

  • The primary challenge facing the market is the substantial cost of advanced equipment, which constrains adoption, particularly for smaller clinics. The investment required for a high-end chairside milling unit can be more than ten times that of a basic clinical setup, a significant hurdle when practice overheads already average around 75%.
  • This economic pressure makes dental clinic overhead management a critical concern and drives a segment of the market toward the refurbished dental equipment market as a cost-effective alternative. Furthermore, disparities in access to care and limited dental insurance reimbursement codes in many regions restrict the patient base for advanced procedures.
  • Intense competition also pressures margins, compelling companies to innovate while managing costs across their supply chains for items ranging from surgical handpieces to obturation systems.

Exclusive Technavio Analysis on Customer Landscape

The dental surgical equipment market forecasting report includes the adoption lifecycle of the market, covering from the innovator’s stage to the laggard’s stage. It focuses on adoption rates in different regions based on penetration. Furthermore, the dental surgical equipment market report also includes key purchase criteria and drivers of price sensitivity to help companies evaluate and develop their market growth analysis strategies.

Customer Landscape of Dental Surgical Equipment Industry

Competitive Landscape

Companies are implementing various strategies, such as strategic alliances, dental surgical equipment market forecast, partnerships, mergers and acquisitions, geographical expansion, and product/service launches, to enhance their presence in the industry.

3Shape AS - Key offerings include advanced intraoral scanners, lab scanners, CBCT systems, and integrated CAD/CAM solutions for comprehensive digital dentistry workflows.

The industry research and growth report includes detailed analyses of the competitive landscape of the market and information about key companies, including:

  • 3Shape AS
  • A dec Inc.
  • Alliage SA
  • AMD Lasers Inc.
  • BIOLASE Inc.
  • Carestream Dental LLC
  • Coltene Whaledent AG
  • DENTAURUM GmbH
  • Dentsply Sirona Inc.
  • Envista Holdings Corp.
  • GC Corp.
  • Henry Schein Inc.
  • Institut Straumann AG
  • Ivoclar Vivadent AG
  • Midmark Corp.
  • Patterson Dental
  • Planmeca Oy
  • Septodont Holding
  • Ultradent Products Inc.
  • ZimVie Inc.

Qualitative and quantitative analysis of companies has been conducted to help clients understand the wider business environment as well as the strengths and weaknesses of key industry players. Data is qualitatively analyzed to categorize companies as pure play, category-focused, industry-focused, and diversified; it is quantitatively analyzed to categorize companies as dominant, leading, strong, tentative, and weak.

Recent Development and News in Dental surgical equipment market

  • In September, 2024, Dentsply Sirona introduced Primescan 2, a cloud-native intraoral scanning solution designed to streamline restorative workflows by enabling wireless scanning directly to cloud platforms, significantly reducing turnaround times.
  • In August, 2024, Case Western Reserve University School of Dental Medicine completed a $2.6 million renovation of its simulation clinic, which included a $350,000 investment in Bien-Air Optima MX2 electric motor systems and other state-of-the-art dental technology.
  • In February, 2025, Oral Care announced a strategic partnership with De Tandartsengroep to enhance its operational capabilities and expand its service portfolio by integrating advanced dental technologies across its network.
  • In May, 2025, the Straumann Group is expected to complete the full acquisition of maxon dental GmbH, a move aimed at strengthening its portfolio in dental biomaterials and regenerative solutions.

Dive into Technavio’s robust research methodology, blending expert interviews, extensive data synthesis, and validated models for unparalleled Dental Surgical Equipment Market insights. See full methodology.

Market Scope
Page number 293
Base year 2024
Historic period 2019-2023
Forecast period 2025-2029
Growth momentum & CAGR Accelerate at a CAGR of 8.4%
Market growth 2025-2029 USD 2735.9 million
Market structure Fragmented
YoY growth 2024-2025(%) 7.6%
Key countries US, Canada, Mexico, Germany, UK, France, Italy, Spain, The Netherlands, China, Japan, India, South Korea, Indonesia, Thailand, Brazil, Saudi Arabia, UAE, South Africa, Argentina, Turkey, Egypt and Nigeria
Competitive landscape Leading Companies, Market Positioning of Companies, Competitive Strategies, and Industry Risks

Request Free Sample

Research Analyst Overview

  • The dental surgical equipment market is advancing through the integration of sophisticated digital technologies and precision-engineered systems. Innovations in cad/cam dental systems and chairside dental milling are redefining restorative procedures, while the adoption of cone beam computed tomography and digital impression systems enhances diagnostic capabilities.
  • The market sees continuous development in specialized tools like piezoelectric surgery units and endodontic motors, which offer greater control and predictability. A key metric of this progress is the ability of new-generation 3d printed surgical guides to achieve over 99% dimensional stability, directly impacting the success of computer-guided implant placement.
  • Developments in materials, including zirconia milling blocks and high-performance polymers, complement these hardware advancements. However, the significant upfront cost of technologies like dental operating microscopes and robotic-assisted implant surgery forces a critical evaluation in boardroom budgeting, where the long-term benefits of improved outcomes must be weighed against immediate capital expenditure.
  • This economic reality shapes procurement strategies, influencing decisions around adopting everything from advanced dental implant motors and guided surgery platforms to essential sterilization equipment like dental autoclaves and ultrasonic cleaners.

What are the Key Data Covered in this Dental Surgical Equipment Market Research and Growth Report?

  • What is the expected growth of the Dental Surgical Equipment Market between 2025 and 2029?

    • USD 2.74 billion, at a CAGR of 8.4%

  • What segmentation does the market report cover?

    • The report is segmented by Product (Dental systems and equipment, and Dental lasers), End-user (Clinics, and Hospitals), Therapeutic Area (Restorative dentistry, Orthodontics, Endodontics, Prosthodontics, and Others) and Geography (North America, Europe, Asia, Rest of World (ROW))

  • Which regions are analyzed in the report?

    • North America, Europe, Asia and Rest of World (ROW)

  • What are the key growth drivers and market challenges?

    • Increasing prevalence of dental diseases and related risk factors, High cost of dental equipment

  • Who are the major players in the Dental Surgical Equipment Market?

    • 3Shape AS, A dec Inc., Alliage SA, AMD Lasers Inc., BIOLASE Inc., Carestream Dental LLC, Coltene Whaledent AG, DENTAURUM GmbH, Dentsply Sirona Inc., Envista Holdings Corp., GC Corp., Henry Schein Inc., Institut Straumann AG, Ivoclar Vivadent AG, Midmark Corp., Patterson Dental, Planmeca Oy, Septodont Holding, Ultradent Products Inc. and ZimVie Inc.

Market Research Insights

  • Market dynamics are increasingly shaped by the pursuit of efficiency and improved clinical outcomes, supported by robust data. The adoption of advanced fabrication methods, for instance, reduces material waste by up to 85% compared to traditional machining, directly impacting dental clinic overhead management.
  • Furthermore, the integration of digital workflows has been shown to reduce patient chair time by an average of 25%, a critical factor for private dental practice economics and patient satisfaction. This shift toward digital dentistry integration is a key component of capital equipment investment strategies, particularly for dental service organization procurement.
  • As procedural predictability becomes a primary purchasing criterion, technologies that support evidence-based treatment planning are seeing higher adoption, influencing decisions across the refurbished dental equipment market and for new acquisitions.

We can help! Our analysts can customize this dental surgical equipment market research report to meet your requirements.

Get in touch

1. Executive Summary

1.1 Market overview

Executive Summary - Chart on Market Overview
Executive Summary - Data Table on Market Overview
Executive Summary - Chart on Global Market Characteristics
Executive Summary - Chart on Market by Geography
Executive Summary - Chart on Market Segmentation by Product
Executive Summary - Chart on Market Segmentation by End-user
Executive Summary - Chart on Market Segmentation by Therapeutic Area
Executive Summary - Chart on Incremental Growth
Executive Summary - Data Table on Incremental Growth
Executive Summary - Chart on Company Market Positioning

2. Technavio Analysis

2.1 Analysis of price sensitivity, lifecycle, customer purchase basket, adoption rates, and purchase criteria

2.2 Criticality of inputs and Factors of differentiation

Chart on Overview on criticality of inputs and factors of differentiation

2.3 Factors of disruption

Chart on Overview on factors of disruption

2.4 Impact of drivers and challenges

Chart on Impact of drivers and challenges in 2024 and 2029

3. Market Landscape

3.1 Market ecosystem

Chart on Parent Market
Data Table on - Parent Market

3.2 Market characteristics

Chart on Market characteristics analysis

3.3 Value chain analysis

Chart on Value chain analysis

4. Market Sizing

4.1 Market definition

Data Table on Offerings of companies included in the market definition

4.2 Market segment analysis

Market segments

4.3 Market size 2024

4.4 Market outlook: Forecast for 2024-2029

Chart on Global - Market size and forecast 2024-2029 ($ million)
Data Table on Global - Market size and forecast 2024-2029 ($ million)
Chart on Global Market: Year-over-year growth 2024-2029 (%)
Data Table on Global Market: Year-over-year growth 2024-2029 (%)

5. Historic Market Size

5.1 Global Dental Surgical Equipment Market 2019 - 2023

Historic Market Size - Data Table on Global Dental Surgical Equipment Market 2019 - 2023 ($ million)

5.2 Product segment analysis 2019 - 2023

Historic Market Size - Product Segment 2019 - 2023 ($ million)

5.3 End-user segment analysis 2019 - 2023

Historic Market Size - End-user Segment 2019 - 2023 ($ million)

5.4 Therapeutic Area segment analysis 2019 - 2023

Historic Market Size - Therapeutic Area Segment 2019 - 2023 ($ million)

5.5 Geography segment analysis 2019 - 2023

Historic Market Size - Geography Segment 2019 - 2023 ($ million)

5.6 Country segment analysis 2019 - 2023

Historic Market Size - Country Segment 2019 - 2023 ($ million)

6. Qualitative Analysis

6.1 The AI impact on Global Dental Surgical Equipment Market

7. Five Forces Analysis

7.1 Five forces summary

Five forces analysis - Comparison between 2024 and 2029

7.2 Bargaining power of buyers

Bargaining power of buyers - Impact of key factors 2024 and 2029

7.3 Bargaining power of suppliers

Bargaining power of suppliers - Impact of key factors in 2024 and 2029

7.4 Threat of new entrants

Threat of new entrants - Impact of key factors in 2024 and 2029

7.5 Threat of substitutes

Threat of substitutes - Impact of key factors in 2024 and 2029

7.6 Threat of rivalry

Threat of rivalry - Impact of key factors in 2024 and 2029

7.7 Market condition

Chart on Market condition - Five forces 2024 and 2029

8. Market Segmentation by Product

8.1 Market segments

Chart on Product - Market share 2024-2029 (%)
Data Table on Product - Market share 2024-2029 (%)

8.2 Comparison by Product

Chart on Comparison by Product
Data Table on Comparison by Product

8.3 Dental systems and equipment - Market size and forecast 2024-2029

Chart on Dental systems and equipment - Market size and forecast 2024-2029 ($ million)
Data Table on Dental systems and equipment - Market size and forecast 2024-2029 ($ million)
Chart on Dental systems and equipment - Year-over-year growth 2024-2029 (%)
Data Table on Dental systems and equipment - Year-over-year growth 2024-2029 (%)

8.4 Dental lasers - Market size and forecast 2024-2029

Chart on Dental lasers - Market size and forecast 2024-2029 ($ million)
Data Table on Dental lasers - Market size and forecast 2024-2029 ($ million)
Chart on Dental lasers - Year-over-year growth 2024-2029 (%)
Data Table on Dental lasers - Year-over-year growth 2024-2029 (%)

8.5 Market opportunity by Product

Market opportunity by Product ($ million)
Data Table on Market opportunity by Product ($ million)

9. Market Segmentation by End-user

9.1 Market segments

Chart on End-user - Market share 2024-2029 (%)
Data Table on End-user - Market share 2024-2029 (%)

9.2 Comparison by End-user

Chart on Comparison by End-user
Data Table on Comparison by End-user

9.3 Clinics - Market size and forecast 2024-2029

Chart on Clinics - Market size and forecast 2024-2029 ($ million)
Data Table on Clinics - Market size and forecast 2024-2029 ($ million)
Chart on Clinics - Year-over-year growth 2024-2029 (%)
Data Table on Clinics - Year-over-year growth 2024-2029 (%)

9.4 Hospitals - Market size and forecast 2024-2029

Chart on Hospitals - Market size and forecast 2024-2029 ($ million)
Data Table on Hospitals - Market size and forecast 2024-2029 ($ million)
Chart on Hospitals - Year-over-year growth 2024-2029 (%)
Data Table on Hospitals - Year-over-year growth 2024-2029 (%)

9.5 Market opportunity by End-user

Market opportunity by End-user ($ million)
Data Table on Market opportunity by End-user ($ million)

10. Market Segmentation by Therapeutic Area

10.1 Market segments

Chart on Therapeutic Area - Market share 2024-2029 (%)
Data Table on Therapeutic Area - Market share 2024-2029 (%)

10.2 Comparison by Therapeutic Area

Chart on Comparison by Therapeutic Area
Data Table on Comparison by Therapeutic Area

10.3 Restorative dentistry - Market size and forecast 2024-2029

Chart on Restorative dentistry - Market size and forecast 2024-2029 ($ million)
Data Table on Restorative dentistry - Market size and forecast 2024-2029 ($ million)
Chart on Restorative dentistry - Year-over-year growth 2024-2029 (%)
Data Table on Restorative dentistry - Year-over-year growth 2024-2029 (%)

10.4 Orthodontics - Market size and forecast 2024-2029

Chart on Orthodontics - Market size and forecast 2024-2029 ($ million)
Data Table on Orthodontics - Market size and forecast 2024-2029 ($ million)
Chart on Orthodontics - Year-over-year growth 2024-2029 (%)
Data Table on Orthodontics - Year-over-year growth 2024-2029 (%)

10.5 Endodontics - Market size and forecast 2024-2029

Chart on Endodontics - Market size and forecast 2024-2029 ($ million)
Data Table on Endodontics - Market size and forecast 2024-2029 ($ million)
Chart on Endodontics - Year-over-year growth 2024-2029 (%)
Data Table on Endodontics - Year-over-year growth 2024-2029 (%)

10.6 Prosthodontics - Market size and forecast 2024-2029

Chart on Prosthodontics - Market size and forecast 2024-2029 ($ million)
Data Table on Prosthodontics - Market size and forecast 2024-2029 ($ million)
Chart on Prosthodontics - Year-over-year growth 2024-2029 (%)
Data Table on Prosthodontics - Year-over-year growth 2024-2029 (%)

10.7 Others - Market size and forecast 2024-2029

Chart on Others - Market size and forecast 2024-2029 ($ million)
Data Table on Others - Market size and forecast 2024-2029 ($ million)
Chart on Others - Year-over-year growth 2024-2029 (%)
Data Table on Others - Year-over-year growth 2024-2029 (%)

10.8 Market opportunity by Therapeutic Area

Market opportunity by Therapeutic Area ($ million)
Data Table on Market opportunity by Therapeutic Area ($ million)

11. Customer Landscape

11.1 Customer landscape overview

Analysis of price sensitivity, lifecycle, customer purchase basket, adoption rates, and purchase criteria

12. Geographic Landscape

12.1 Geographic segmentation

Chart on Market share by geography 2024-2029 (%)
Data Table on Market share by geography 2024-2029 (%)

12.2 Geographic comparison

Chart on Geographic comparison
Data Table on Geographic comparison

12.3 North America - Market size and forecast 2024-2029

Chart on North America - Market size and forecast 2024-2029 ($ million)
Data Table on North America - Market size and forecast 2024-2029 ($ million)
Chart on North America - Year-over-year growth 2024-2029 (%)
Data Table on North America - Year-over-year growth 2024-2029 (%)
Chart on Regional Comparison - North America
Data Table on Regional Comparison - North America

12.3.1 US - Market size and forecast 2024-2029

Chart on US - Market size and forecast 2024-2029 ($ million)
Data Table on US - Market size and forecast 2024-2029 ($ million)
Chart on US - Year-over-year growth 2024-2029 (%)
Data Table on US - Year-over-year growth 2024-2029 (%)

12.3.2 Canada - Market size and forecast 2024-2029

Chart on Canada - Market size and forecast 2024-2029 ($ million)
Data Table on Canada - Market size and forecast 2024-2029 ($ million)
Chart on Canada - Year-over-year growth 2024-2029 (%)
Data Table on Canada - Year-over-year growth 2024-2029 (%)

12.3.3 Mexico - Market size and forecast 2024-2029

Chart on Mexico - Market size and forecast 2024-2029 ($ million)
Data Table on Mexico - Market size and forecast 2024-2029 ($ million)
Chart on Mexico - Year-over-year growth 2024-2029 (%)
Data Table on Mexico - Year-over-year growth 2024-2029 (%)

12.4 Europe - Market size and forecast 2024-2029

Chart on Europe - Market size and forecast 2024-2029 ($ million)
Data Table on Europe - Market size and forecast 2024-2029 ($ million)
Chart on Europe - Year-over-year growth 2024-2029 (%)
Data Table on Europe - Year-over-year growth 2024-2029 (%)
Chart on Regional Comparison - Europe
Data Table on Regional Comparison - Europe

12.4.1 Germany - Market size and forecast 2024-2029

Chart on Germany - Market size and forecast 2024-2029 ($ million)
Data Table on Germany - Market size and forecast 2024-2029 ($ million)
Chart on Germany - Year-over-year growth 2024-2029 (%)
Data Table on Germany - Year-over-year growth 2024-2029 (%)

12.4.2 UK - Market size and forecast 2024-2029

Chart on UK - Market size and forecast 2024-2029 ($ million)
Data Table on UK - Market size and forecast 2024-2029 ($ million)
Chart on UK - Year-over-year growth 2024-2029 (%)
Data Table on UK - Year-over-year growth 2024-2029 (%)

12.4.3 France - Market size and forecast 2024-2029

Chart on France - Market size and forecast 2024-2029 ($ million)
Data Table on France - Market size and forecast 2024-2029 ($ million)
Chart on France - Year-over-year growth 2024-2029 (%)
Data Table on France - Year-over-year growth 2024-2029 (%)

12.4.4 Italy - Market size and forecast 2024-2029

Chart on Italy - Market size and forecast 2024-2029 ($ million)
Data Table on Italy - Market size and forecast 2024-2029 ($ million)
Chart on Italy - Year-over-year growth 2024-2029 (%)
Data Table on Italy - Year-over-year growth 2024-2029 (%)

12.4.5 Spain - Market size and forecast 2024-2029

Chart on Spain - Market size and forecast 2024-2029 ($ million)
Data Table on Spain - Market size and forecast 2024-2029 ($ million)
Chart on Spain - Year-over-year growth 2024-2029 (%)
Data Table on Spain - Year-over-year growth 2024-2029 (%)

12.4.6 The Netherlands - Market size and forecast 2024-2029

Chart on The Netherlands - Market size and forecast 2024-2029 ($ million)
Data Table on The Netherlands - Market size and forecast 2024-2029 ($ million)
Chart on The Netherlands - Year-over-year growth 2024-2029 (%)
Data Table on The Netherlands - Year-over-year growth 2024-2029 (%)

12.5 Asia - Market size and forecast 2024-2029

Chart on Asia - Market size and forecast 2024-2029 ($ million)
Data Table on Asia - Market size and forecast 2024-2029 ($ million)
Chart on Asia - Year-over-year growth 2024-2029 (%)
Data Table on Asia - Year-over-year growth 2024-2029 (%)
Chart on Regional Comparison - Asia
Data Table on Regional Comparison - Asia

12.5.1 China - Market size and forecast 2024-2029

Chart on China - Market size and forecast 2024-2029 ($ million)
Data Table on China - Market size and forecast 2024-2029 ($ million)
Chart on China - Year-over-year growth 2024-2029 (%)
Data Table on China - Year-over-year growth 2024-2029 (%)

12.5.2 Japan - Market size and forecast 2024-2029

Chart on Japan - Market size and forecast 2024-2029 ($ million)
Data Table on Japan - Market size and forecast 2024-2029 ($ million)
Chart on Japan - Year-over-year growth 2024-2029 (%)
Data Table on Japan - Year-over-year growth 2024-2029 (%)

12.5.3 India - Market size and forecast 2024-2029

Chart on India - Market size and forecast 2024-2029 ($ million)
Data Table on India - Market size and forecast 2024-2029 ($ million)
Chart on India - Year-over-year growth 2024-2029 (%)
Data Table on India - Year-over-year growth 2024-2029 (%)

12.5.4 South Korea - Market size and forecast 2024-2029

Chart on South Korea - Market size and forecast 2024-2029 ($ million)
Data Table on South Korea - Market size and forecast 2024-2029 ($ million)
Chart on South Korea - Year-over-year growth 2024-2029 (%)
Data Table on South Korea - Year-over-year growth 2024-2029 (%)

12.5.5 Indonesia - Market size and forecast 2024-2029

Chart on Indonesia - Market size and forecast 2024-2029 ($ million)
Data Table on Indonesia - Market size and forecast 2024-2029 ($ million)
Chart on Indonesia - Year-over-year growth 2024-2029 (%)
Data Table on Indonesia - Year-over-year growth 2024-2029 (%)

12.5.6 Thailand - Market size and forecast 2024-2029

Chart on Thailand - Market size and forecast 2024-2029 ($ million)
Data Table on Thailand - Market size and forecast 2024-2029 ($ million)
Chart on Thailand - Year-over-year growth 2024-2029 (%)
Data Table on Thailand - Year-over-year growth 2024-2029 (%)

12.6 Rest of World (ROW) - Market size and forecast 2024-2029

Chart on Rest of World (ROW) - Market size and forecast 2024-2029 ($ million)
Data Table on Rest of World (ROW) - Market size and forecast 2024-2029 ($ million)
Chart on Rest of World (ROW) - Year-over-year growth 2024-2029 (%)
Data Table on Rest of World (ROW) - Year-over-year growth 2024-2029 (%)
Chart on Regional Comparison - Rest of World (ROW)
Data Table on Regional Comparison - Rest of World (ROW)

12.6.1 Brazil - Market size and forecast 2024-2029

Chart on Brazil - Market size and forecast 2024-2029 ($ million)
Data Table on Brazil - Market size and forecast 2024-2029 ($ million)
Chart on Brazil - Year-over-year growth 2024-2029 (%)
Data Table on Brazil - Year-over-year growth 2024-2029 (%)

12.6.2 Saudi Arabia - Market size and forecast 2024-2029

Chart on Saudi Arabia - Market size and forecast 2024-2029 ($ million)
Data Table on Saudi Arabia - Market size and forecast 2024-2029 ($ million)
Chart on Saudi Arabia - Year-over-year growth 2024-2029 (%)
Data Table on Saudi Arabia - Year-over-year growth 2024-2029 (%)

12.6.3 UAE - Market size and forecast 2024-2029

Chart on UAE - Market size and forecast 2024-2029 ($ million)
Data Table on UAE - Market size and forecast 2024-2029 ($ million)
Chart on UAE - Year-over-year growth 2024-2029 (%)
Data Table on UAE - Year-over-year growth 2024-2029 (%)

12.6.4 South Africa - Market size and forecast 2024-2029

Chart on South Africa - Market size and forecast 2024-2029 ($ million)
Data Table on South Africa - Market size and forecast 2024-2029 ($ million)
Chart on South Africa - Year-over-year growth 2024-2029 (%)
Data Table on South Africa - Year-over-year growth 2024-2029 (%)

12.6.5 Argentina - Market size and forecast 2024-2029

Chart on Argentina - Market size and forecast 2024-2029 ($ million)
Data Table on Argentina - Market size and forecast 2024-2029 ($ million)
Chart on Argentina - Year-over-year growth 2024-2029 (%)
Data Table on Argentina - Year-over-year growth 2024-2029 (%)

12.6.6 Turkey - Market size and forecast 2024-2029

Chart on Turkey - Market size and forecast 2024-2029 ($ million)
Data Table on Turkey - Market size and forecast 2024-2029 ($ million)
Chart on Turkey - Year-over-year growth 2024-2029 (%)
Data Table on Turkey - Year-over-year growth 2024-2029 (%)

12.6.7 Egypt - Market size and forecast 2024-2029

Chart on Egypt - Market size and forecast 2024-2029 ($ million)
Data Table on Egypt - Market size and forecast 2024-2029 ($ million)
Chart on Egypt - Year-over-year growth 2024-2029 (%)
Data Table on Egypt - Year-over-year growth 2024-2029 (%)

12.6.8 Nigeria - Market size and forecast 2024-2029

Chart on Nigeria - Market size and forecast 2024-2029 ($ million)
Data Table on Nigeria - Market size and forecast 2024-2029 ($ million)
Chart on Nigeria - Year-over-year growth 2024-2029 (%)
Data Table on Nigeria - Year-over-year growth 2024-2029 (%)

12.7 Market opportunity by geography

Market opportunity by geography ($ million)
Data Tables on Market opportunity by geography ($ million)

13. Drivers, Challenges, and Opportunity

13.1 Market drivers

Increasing prevalence of dental diseases and related risk factors
Increase in number of dentists and dental practices
Favorable reimbursements and tax benefits

13.2 Market challenges

High cost of dental equipment
Lack of access to quality oral healthcare
Intense competition among companies

13.3 Impact of drivers and challenges

Impact of drivers and challenges in 2024 and 2029

13.4 Market opportunities

Technological advances and new product launches
Growing adoption of 3D printing technology by dental professionals
Strategic collaborations and mergers and acquisitions

14. Competitive Landscape

14.1 Overview

14.2

Overview on criticality of inputs and factors of differentiation

14.3 Landscape disruption

Overview on factors of disruption

14.4 Industry risks

Impact of key risks on business

15. Competitive Analysis

15.1 Companies profiled

Companies covered

15.2 Company ranking index

15.3 Market positioning of companies

Matrix on companies position and classification

15.4 3Shape AS

3Shape AS - Overview
3Shape AS - Product / Service
3Shape AS - Key offerings
SWOT

15.5 A dec Inc.

A dec Inc. - Overview
A dec Inc. - Product / Service
A dec Inc. - Key offerings
SWOT

15.6 Alliage SA

Alliage SA - Overview
Alliage SA - Product / Service
Alliage SA - Key offerings
SWOT

15.7 AMD Lasers Inc.

AMD Lasers Inc. - Overview
AMD Lasers Inc. - Product / Service
AMD Lasers Inc. - Key offerings
SWOT

15.8 BIOLASE Inc.

BIOLASE Inc. - Overview
BIOLASE Inc. - Product / Service
BIOLASE Inc. - Key offerings
SWOT

15.9 Carestream Dental LLC

Carestream Dental LLC - Overview
Carestream Dental LLC - Product / Service
Carestream Dental LLC - Key offerings
SWOT

15.10 DENTAURUM GmbH

DENTAURUM GmbH - Overview
DENTAURUM GmbH - Product / Service
DENTAURUM GmbH - Key offerings
SWOT

15.11 Dentsply Sirona Inc.

Dentsply Sirona Inc. - Overview
Dentsply Sirona Inc. - Business segments
Dentsply Sirona Inc. - Key news
Dentsply Sirona Inc. - Key offerings
Dentsply Sirona Inc. - Segment focus
SWOT

15.12 Envista Holdings Corp.

Envista Holdings Corp. - Overview
Envista Holdings Corp. - Business segments
Envista Holdings Corp. - Key news
Envista Holdings Corp. - Key offerings
Envista Holdings Corp. - Segment focus
SWOT

15.13 GC Corp.

GC Corp. - Overview
GC Corp. - Product / Service
GC Corp. - Key offerings
SWOT

15.14 Henry Schein Inc.

Henry Schein Inc. - Overview
Henry Schein Inc. - Business segments
Henry Schein Inc. - Key offerings
Henry Schein Inc. - Segment focus
SWOT

15.15 Institut Straumann AG

Institut Straumann AG - Overview
Institut Straumann AG - Product / Service
Institut Straumann AG - Key news
Institut Straumann AG - Key offerings
SWOT

15.16 Ivoclar Vivadent AG

Ivoclar Vivadent AG - Overview
Ivoclar Vivadent AG - Product / Service
Ivoclar Vivadent AG - Key offerings
SWOT

15.17 Planmeca Oy

Planmeca Oy - Overview
Planmeca Oy - Product / Service
Planmeca Oy - Key offerings
SWOT

15.18 ZimVie Inc.

ZimVie Inc. - Overview
ZimVie Inc. - Business segments
ZimVie Inc. - Key offerings
ZimVie Inc. - Segment focus
SWOT

16. Appendix

16.1 Scope of the report

Market definition
Objectives
Notes and caveats

16.2 Inclusions and exclusions checklist

Inclusions checklist
Exclusions checklist

16.3 Currency conversion rates for US$

16.4 Research methodology

16.5 Data procurement

Information sources

16.6 Data validation

16.7 Validation techniques employed for market sizing

16.8 Data synthesis

16.9 360 degree market analysis

16.10 List of abbreviations

Research Methodology

Technavio presents a detailed picture of the market by way of study, synthesis, and summation of data from multiple sources. The analysts have presented the various facets of the market with a particular focus on identifying the key industry influencers. The data thus presented is comprehensive, reliable, and the result of extensive research, both primary and secondary.

INFORMATION SOURCES

Primary sources

  • Manufacturers and suppliers
  • Channel partners
  • Industry experts
  • Strategic decision makers

Secondary sources

  • Industry journals and periodicals
  • Government data
  • Financial reports of key industry players
  • Historical data
  • Press releases

DATA ANALYSIS

Data Synthesis

  • Collation of data
  • Estimation of key figures
  • Analysis of derived insights

Data Validation

  • Triangulation with data models
  • Reference against proprietary databases
  • Corroboration with industry experts

REPORT WRITING

Qualitative

  • Market drivers
  • Market challenges
  • Market trends
  • Five forces analysis

Quantitative

  • Market size and forecast
  • Market segmentation
  • Geographical insights
  • Competitive landscape

Interested in this report?

Get your sample now to see our research methodology and insights!

Download Now

Frequently Asked Questions

Dental Surgical Equipment market growth will increase by USD 2735.9 million during 2025-2029 .

The Dental Surgical Equipment market is expected to grow at a CAGR of 8.4% during 2025-2029 .

Dental Surgical Equipment market is segmented by Product (Dental systems and equipment, Dental lasers) End-user (Clinics, Hospitals) Therapeutic area (Restorative dentistry, Orthodontics, Endodontics, Prosthodontics, Others)

3Shape AS, A dec Inc., Alliage SA, AMD Lasers Inc., BIOLASE Inc., Carestream Dental LLC, Coltene Whaledent AG, DENTAURUM GmbH, Dentsply Sirona Inc., Envista Holdings Corp., GC Corp., Henry Schein Inc., Institut Straumann AG, Ivoclar Vivadent AG, Midmark Corp., Patterson Dental, Planmeca Oy, Septodont Holding, Ultradent Products Inc., ZimVie Inc. are a few of the key vendors in the Dental Surgical Equipment market.

North America will register the highest growth rate of 40.7% among the other regions. Therefore, the Dental Surgical Equipment market in North America is expected to garner significant business opportunities for the vendors during the forecast period.

US, Canada, Mexico, Germany, UK, France, Italy, Spain, The Netherlands, China, Japan, India, South Korea, Indonesia, Thailand, Brazil, Saudi Arabia, UAE, South Africa, Argentina, Turkey, Egypt, Nigeria

  • Increasing prevalence of dental diseases and related risk factors is the driving factor this market.

The Dental Surgical Equipment market vendors should focus on grabbing business opportunities from the Product segment as it accounted for the largest market share in the base year.