Dermatological Drugs Market Analysis North America, Europe, Asia, Rest of World (ROW) - US, Finland, China, Canada, India - Size and Forecast 2024-2028

Dermatological Drugs Market Analysis North America, Europe, Asia, Rest of World (ROW) - US, Finland, China, Canada, India - Size and Forecast 2024-2028

Published: Jul 2024 139 Pages SKU: IRTNTR73277

Market Overview at a Glance

$11.99 B
Market Opportunity
10.03%
CAGR
8.88
YoY growth 2023-2024(%)

Dermatological Drugs Market Size 2024-2028

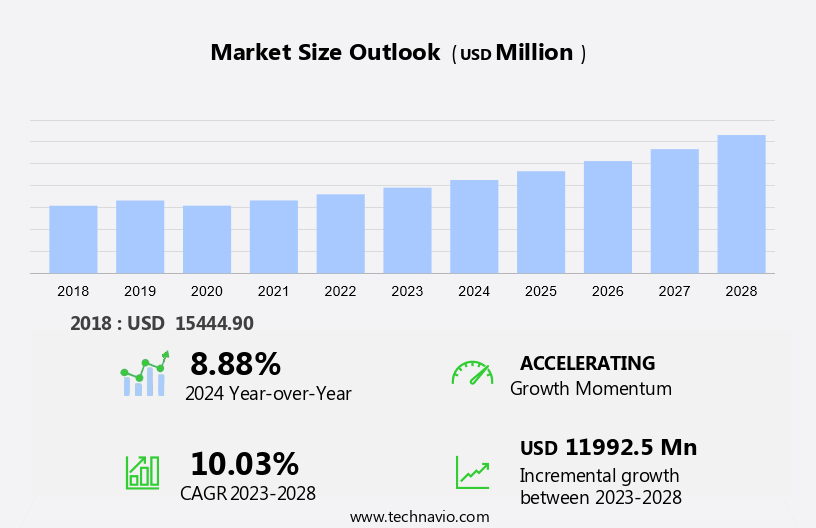
The dermatological drugs market size is forecast to increase by USD 11.99 billion at a CAGR of 10.03% between 2023 and 2028.

  • The demand for safe and stable medications that require minimal monitoring is a key factor driving the market. Additionally, the rising costs of dermatological drugs have become a significant trend in the healthcare industry. The market is witnessing significant growth due to the increasing use of hyaluronic acid in skincare treatments for its hydrating and anti-aging properties. At the same time, the introduction of new biologics and biosimilars faces considerable obstacles due to access barriers, making it harder for these therapies to reach patients. These barriers could include regulatory hurdles, pricing issues, and distribution challenges that slow the adoption of novel treatments. Together, these factors highlight the growing need for affordable, effective drugs with fewer side effects, as well as the importance of addressing obstacles in the availability and accessibility of advanced therapies.
  • Companies seeking to capitalize on these opportunities should focus on innovation, cost-effective solutions, and strategic partnerships to navigate the competitive landscape and meet the evolving needs of consumers and industries.

What will be the Size of the Dermatological Drugs Market during the forecast period?

Dermatological Drugs Market Size

 Request Free Sample

  • The market encompasses a wide range of pharmaceutical treatments addressing various skin conditions, including acne, eczema, rosacea, and others such as keratosis, xerosis, corns, callous, nail problems, ingrown nails, and wounds. Customer preferences for effective and safe solutions continue to drive market growth. Environmental conditions and personal care expenditure are significant factors influencing the market dynamics. Investments by companies in research and development of innovative formulations utilizing ingredients like emollients, keratolytic agents, and moisturizers, such as petrolatum, lanolin, mineral oil, dimethicone, lactic acid, salicylic acid, urea, and water, cater to diverse skin types and conditions.
  • The market landscape is marked by the introduction of advanced technologies and the integration of natural and organic ingredients into dermatological products.

How is the Dermatological Drugs Industry segmented?

The industry research report provides comprehensive data (region-wise segment analysis), with forecasts and estimates in "USD million" for the period 2024-2028, as well as historical data from 2018-2022 for the following segments.

  • Product
    • Biologics
    • Small molecules
  • Geography
    • North America
      • US
      • Canada
    • Europe
      • Finland
    • Asia
    • Rest of World (ROW)

By Product Insights

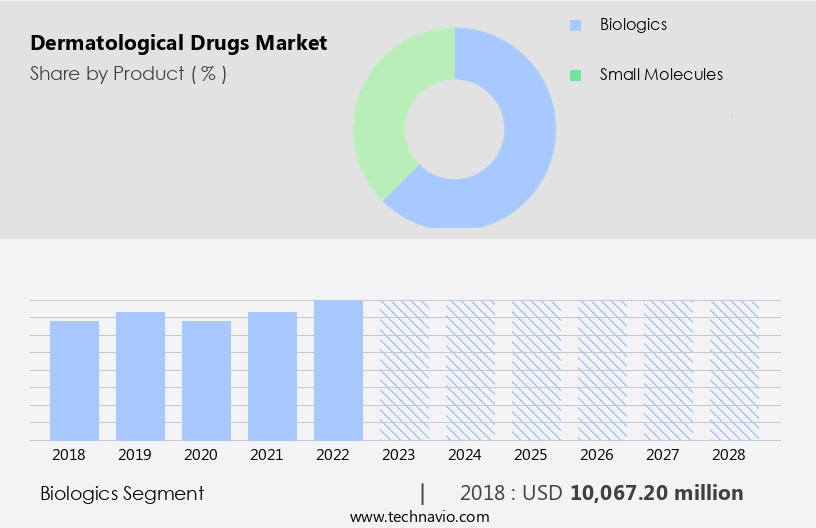
The biologics segment is estimated to witness significant growth during the forecast period. The market is witnessing significant growth due to the increasing prevalence of various skin conditions such as acne, eczema, and rosacea. Customer preferences for effective topical treatments and the rising aging population are key drivers for market expansion. Environmental conditions and personal care expenditure also contribute to the market's growth. Companies are investing in research and development to introduce innovative products, including emollients, keratolytics, and treatments for dry skin, keratosis, xerosis, corns, callous, nail problems, ingrown nails, wounds, and dermatological products for the eyes, lips, mouth, nose, vaginal area, groin area, face, bathing, showering, and shampooing.

Biologics, including adalimumab, etanercept, and infliximab, are increasingly being used for dermatologic conditions, accounting for approximately 18% of the global pharmaceutical drugs market. The market is expected to continue growing due to the rising disposable income and healthcare expenditure, as well as the expiring patents of several dermatological drugs. Trade associations play a crucial role in promoting industry growth and collaboration. The market is global, with varying manufacturer price levels and VAT regulations, and companies employ various modeling approaches to forecast demand.

Dermatological Drugs Market Size

Get a glance at the market report of share of various segments Request Free Sample

The Biologics segment was valued at USD 10.07 billion in 2018 and showed a gradual increase during the forecast period.

Regional Analysis

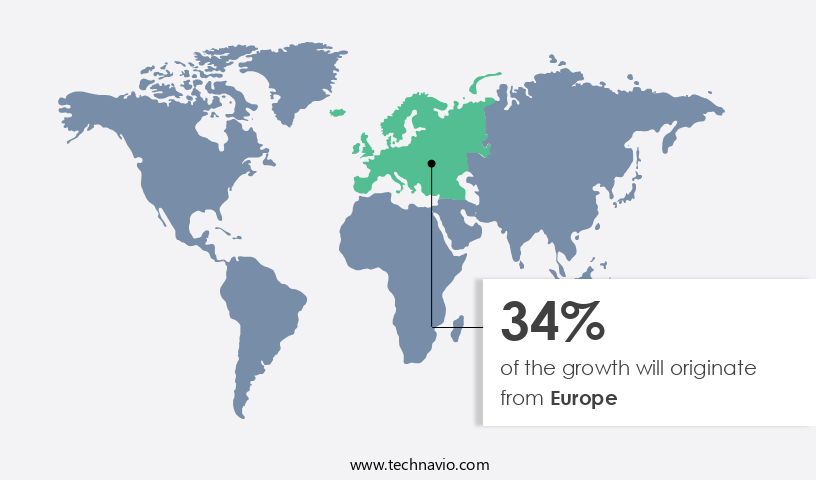
Europe is estimated to contribute 34% to the growth of the global market during the forecast period. Technavio's analysts have elaborately explained the regional trends and drivers that shape the market during the forecast period.

Dermatological Drugs Market Share by Geography

For more insights on the market size of various regions, Request Free Sample

The North American market is experiencing notable expansion due to the increasing geriatric population and high prevalence of skin diseases. In the US, the growing awareness of diagnostic dermatology tests among the elderly population is driving sales of dermatological drugs, particularly those used for treating various types of skin cancer, which are more common among the elderly. Customer preferences for effective treatments, environmental conditions, and personal care expenditure are additional factors fueling market growth. Companies are investing in research and development to introduce innovative products and cater to the evolving needs of consumers.

The market is also influenced by healthcare expenditure, expiring patents, and trade associations. Topical products for conditions such as acne, eczema, rosacea, dry skin, keratosis, xerosis, and nail problems are in high demand. Ingredients like emollients, keratolytic agents, and moisturizers are commonly used in these products. Water, petrolatum, lanolin, mineral oil, dimethicone, lactic acid, salicylic acid, urea, and corn and callous treatments are among the popular ingredients. Dermatological products for the eyes, lips, mouth, nose, vaginal area, groin area, and face are also gaining popularity. The market is segmented into doctor-prescribed and over-the-counter (OTC) products. Consumers often consult doctors or pharmacists for doctor-prescribed products, while OTC products can be purchased without a prescription.

Market Dynamics

Our researchers analyzed the data with 2023 as the base year, along with the key drivers, trends, and challenges. A holistic analysis of drivers will help companies refine their marketing strategies to gain a competitive advantage.

What are the key market drivers leading to the rise in the adoption of the Dermatological Drugs Industry?

  • The need for safe and stable drugs that require minimal monitoring is the key driver of the market. The market caters to the demand for safe and reliable medications for treating various skin conditions affecting the lips, mouth, nose, vaginal area, groin area, face, and other parts of the body. With an increasing number of people suffering from severe dermatologic conditions, there is a growing need for effective and safe drugs with minimal adverse effects. Rational drug use is essential in dermatology to ensure the use of appropriate, effective, and safe therapies in the recommended dosage and formulation for the correct indications and duration.
  • Moreover, dermatologists play a crucial role in defining the illness, setting therapy objectives, using personalized treatment, initiating treatment, providing necessary information to patients, and monitoring their progress. Bathing, showering, and shampooing are common practices that require the use of various dermatological products such as moisturizers, shampoos, and cleansers. Ensuring the safety and efficacy of these products is essential to prevent adverse reactions and maintain patient compliance. Thus, such factors are driving the growth of the market during the forecast period

What are the market trends shaping the Dermatological Drugs Industry?

  • An increase in prices of dermatological drugs is the upcoming market trend. The market is witnessing an upward trend due to the rising consumer demand and expedited approvals of new medications. Topical treatments remain the most affordable dermatological therapy, while small molecules follow. Biologics, on the other hand, are high-priced. To mitigate the high costs, manufacturers employ pricing strategies such as negotiated discounts with buyers and copay coupon cards. The introduction of biosimilars is anticipated to impact innovator drug prices and decrease the costs for subsequent follow-on biologics.
  • In response, manufacturers of newer biologics focus on catering to specialized niche markets to justify their product pricing. The anticipated availability of effective and affordable biosimilars may temper the high prices of biologics in the dermatological drugs market. This includes treatments for various areas such as the lips, mouth, nose, vaginal area, groin area, face, and during bathing, showering, and shampooing, as well as the use of moisturizers. 

What challenges does the Dermatological Drugs Industry face during its growth?

  • The presence of access barriers for novel biologics and biosimilars is a key challenge affecting the industry's growth. The dermatological drugs market encompasses a range of pharmaceutical products designed for the treatment of various skin conditions affecting the lips, mouth, nose, vaginal area, groin area, face, and other parts of the body. The use of these drugs includes bathing, showering, and shampooing, as well as the application of moisturizers and specialized topical treatments. One significant segment of the market is dominated by TNF-alpha inhibitor biologics, which are primarily used for chronic inflammatory conditions.
  • However, the high cost of these biologics, which are protected by clustered patents for another five years, limits their adoption. Regulatory bodies, such as the FDA and EMA, have responded by promoting the adoption of biosimilars, which are lower-priced alternatives. Yet, originator companies have implemented various legal and regulatory barriers to hinder the entry of biosimilars, extending their monopoly profits. Additionally, insurers' mandatory step therapy requirements further complicate the market landscape.

Exclusive Customer Landscape

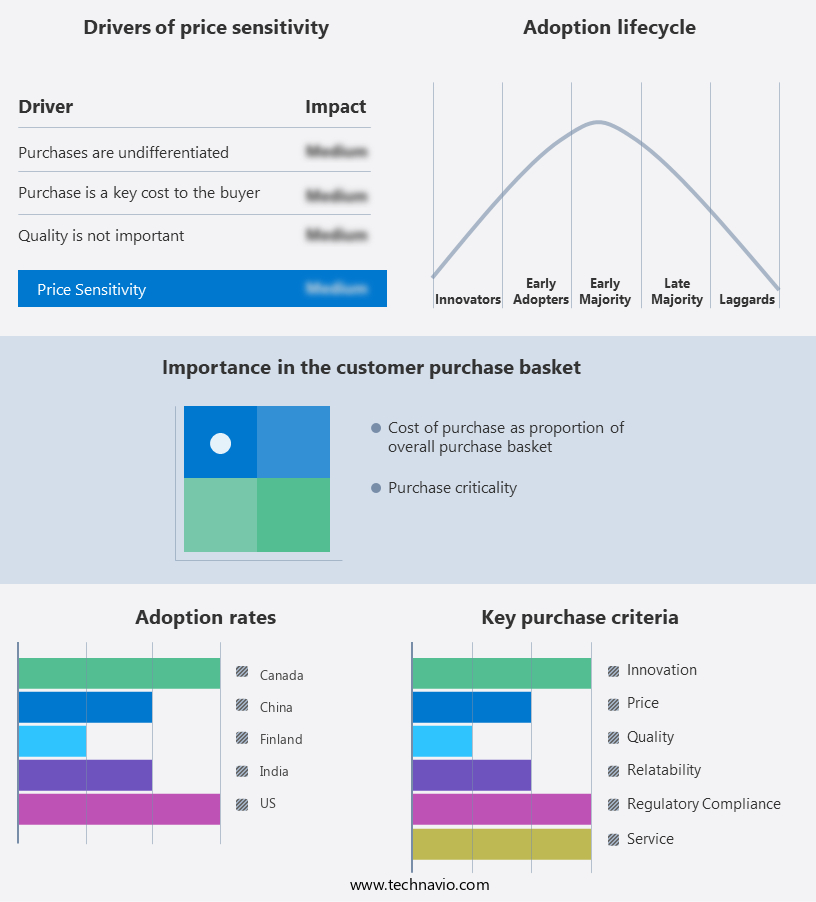
The market forecasting report includes the adoption lifecycle of the market, covering from the innovator's stage to the laggard's stage. It focuses on adoption rates in different regions based on penetration. Furthermore, the market report also includes key purchase criteria and drivers of price sensitivity to help companies evaluate and develop their market growth analysis strategies.

Dermatological Drugs Market Share by Geography

 Customer Landscape

Key Companies & Market Insights

Companies are implementing various strategies, such as strategic alliances, market forecast, partnerships, mergers and acquisitions, geographical expansion, and product/service launches, to enhance their presence in the industry.

The industry research and growth report includes detailed analyses of the competitive landscape of the market and information about key companies, including:

  • AbbVie
  • Amgen Inc.
  • Bausch Health Companies Inc.
  • Botanix Pharmaceutical
  • Bristol Myers Squibb Co.
  • Cipla Inc.
  • Dr Reddys Laboratories Ltd.
  • F. Hoffmann La Roche Ltd.
  • Galderma SA
  • GlaxoSmithKline Plc
  • Johnson and Johnson Services Inc.
  • LEO Pharma AS
  • Lupin Ltd.
  • Novartis AG
  • Pfizer Inc.
  • Sanofi SA
  • Sol Gel Technologies Ltd.
  • Sun Pharmaceutical Industries Ltd.
  • UCB SA
  • Vibcare Pharma Pvt. Ltd.

Qualitative and quantitative analysis of companies has been conducted to help clients understand the wider business environment as well as the strengths and weaknesses of key industry players. Data is qualitatively analyzed to categorize companies as pure play, category-focused, industry-focused, and diversified; it is quantitatively analyzed to categorize companies as dominant, leading, strong, tentative, and weak.

Research Analyst Overview

The market encompasses a wide range of pharmaceutical products designed to address various skin conditions and disorders. These conditions include but are not limited to, acne, eczema, rosacea, and a host of others, such as customer preferences influenced by environmental conditions. The global population's aging process and the subsequent increase in personal care expenditure have led to significant investments by companies in this sector. The rising disposable income in several regions has further fueled the growth of the market. A global comparison of healthcare expenditure reveals that a substantial portion is allocated towards the treatment of skin conditions, making it an attractive area for pharmaceutical companies.

Moreover, manufacturers employ various modeling approaches to develop effective dermatological drugs. These approaches include extensive research and development efforts to create topical products that cater to various skin types and conditions. The expiring patents of certain blockbuster drugs have opened up opportunities for new entrants in the market. The market dynamics for dermatological drugs are influenced by several factors. These include the prevalence of skin conditions, customer preferences, and the availability of effective treatments. Environmental conditions also play a crucial role in the demand for specific dermatological products. The market for dermatological drugs is diverse and expansive, with products targeting various body parts and conditions.

Furthermore, these include conditions affecting the eyes, lips, mouth, nose, vaginal area, groin area, face, and various other parts of the body. The use of these products extends to various activities such as bathing, showering, and shampooing. The market for dermatological drugs includes a wide range of products, from emollients and keratolytics for dry skin conditions to keratosis and xerosis treatments. These products employ various active ingredients such as water, petrolatum, lanolin, mineral oil, dimethicone, lactic acid, salicylic acid, urea, and others. The use of dermatological products is not limited to medical settings. Pharmacists and doctors play a crucial role in recommending these products to patients, while consumers increasingly rely on over-the-counter options for self-treatment.

Market Scope

Report Coverage

Details

Page number

139

Base year

2023

Historic period

2018-2022

Forecast period

2024-2028

Growth momentum & CAGR

Accelerate at a CAGR of 10.03%

Market growth 2024-2028

USD 11.99 billion

Market structure

Fragmented

YoY growth 2023-2024(%)

8.88

Key countries

US, Finland, China, Canada, and India

Competitive landscape

Leading Companies, Market Positioning of Companies, Competitive Strategies, and Industry Risks

Request Free Sample

What are the Key Data Covered in this Dermatological Drugs Market Research and Growth Report?

  • CAGR of the Dermatological Drugs industry during the forecast period
  • Detailed information on factors that will drive the market growth and forecasting between 2024 and 2028
  • Precise estimation of the size of the market and its contribution of the industry in focus to the parent market
  • Accurate predictions about upcoming growth and trends and changes in consumer behaviour
  • Growth of the market across North America, Europe, Asia, and Rest of World (ROW)
  • Thorough analysis of the market's competitive landscape and detailed information about companies
  • Comprehensive analysis of factors that will challenge the dermatological drugs market growth of industry companies

We can help! Our analysts can customize this dermatological drugs market research report to meet your requirements.

Get in touch

1 Executive Summary

  • 1.1 Market overview
    • Executive Summary - Chart on Market Overview
    • Executive Summary - Data Table on Market Overview
    • Executive Summary - Chart on Global Market Characteristics
    • Executive Summary - Chart on Market by Geography
    • Executive Summary - Chart on Market Segmentation by Product
    • Executive Summary - Chart on Incremental Growth
    • Executive Summary - Data Table on Incremental Growth
    • Executive Summary - Chart on Company Market Positioning

2 Market Landscape

  • 2.1 Market ecosystem
    • Parent Market
    • Data Table on - Parent Market
  • 2.2 Market characteristics
    • Market characteristics analysis
  • 2.3 Value chain analysis
    • Value Chain Analysis

3 Market Sizing

  • 3.1 Market definition
    • Offerings of companies included in the market definition
  • 3.2 Market segment analysis
    • Market segments
  • 3.3 Market size 2023
    • 3.4 Market outlook: Forecast for 2023-2028
      • Chart on Global - Market size and forecast 2023-2028 ($ million)
      • Data Table on Global - Market size and forecast 2023-2028 ($ million)
      • Chart on Global Market: Year-over-year growth 2023-2028 (%)
      • Data Table on Global Market: Year-over-year growth 2023-2028 (%)

    4 Historic Market Size

    • 4.1 Global Dermatological Drugs Market 2018 - 2022
      • Historic Market Size - Data Table on Global Dermatological Drugs Market 2018 - 2022 ($ million)
    • 4.2 Product segment analysis 2018 - 2022
      • Historic Market Size - Product Segment 2018 - 2022 ($ million)
    • 4.3 Geography segment analysis 2018 - 2022
      • Historic Market Size - Geography Segment 2018 - 2022 ($ million)
    • 4.4 Country segment analysis 2018 - 2022
      • Historic Market Size - Country Segment 2018 - 2022 ($ million)

    5 Five Forces Analysis

    • 5.1 Five forces summary
      • Five forces analysis - Comparison between 2023 and 2028
    • 5.2 Bargaining power of buyers
      • Bargaining power of buyers - Impact of key factors 2023 and 2028
    • 5.3 Bargaining power of suppliers
      • Bargaining power of suppliers - Impact of key factors in 2023 and 2028
    • 5.4 Threat of new entrants
      • Threat of new entrants - Impact of key factors in 2023 and 2028
    • 5.5 Threat of substitutes
      • Threat of substitutes - Impact of key factors in 2023 and 2028
    • 5.6 Threat of rivalry
      • Threat of rivalry - Impact of key factors in 2023 and 2028
    • 5.7 Market condition
      • Chart on Market condition - Five forces 2023 and 2028

    6 Market Segmentation by Product

    • 6.1 Market segments
      • Chart on Product - Market share 2023-2028 (%)
      • Data Table on Product - Market share 2023-2028 (%)
    • 6.2 Comparison by Product
      • Chart on Comparison by Product
      • Data Table on Comparison by Product
    • 6.3 Biologics - Market size and forecast 2023-2028
      • Chart on Biologics - Market size and forecast 2023-2028 ($ million)
      • Data Table on Biologics - Market size and forecast 2023-2028 ($ million)
      • Chart on Biologics - Year-over-year growth 2023-2028 (%)
      • Data Table on Biologics - Year-over-year growth 2023-2028 (%)
    • 6.4 Small molecules - Market size and forecast 2023-2028
      • Chart on Small molecules - Market size and forecast 2023-2028 ($ million)
      • Data Table on Small molecules - Market size and forecast 2023-2028 ($ million)
      • Chart on Small molecules - Year-over-year growth 2023-2028 (%)
      • Data Table on Small molecules - Year-over-year growth 2023-2028 (%)
    • 6.5 Market opportunity by Product
      • Market opportunity by Product ($ million)
      • Data Table on Market opportunity by Product ($ million)

    7 Customer Landscape

    • 7.1 Customer landscape overview
      • Analysis of price sensitivity, lifecycle, customer purchase basket, adoption rates, and purchase criteria

    8 Geographic Landscape

    • 8.1 Geographic segmentation
      • Chart on Market share by geography 2023-2028 (%)
      • Data Table on Market share by geography 2023-2028 (%)
    • 8.2 Geographic comparison
      • Chart on Geographic comparison
      • Data Table on Geographic comparison
    • 8.3 North America - Market size and forecast 2023-2028
      • Chart on North America - Market size and forecast 2023-2028 ($ million)
      • Data Table on North America - Market size and forecast 2023-2028 ($ million)
      • Chart on North America - Year-over-year growth 2023-2028 (%)
      • Data Table on North America - Year-over-year growth 2023-2028 (%)
    • 8.4 Europe - Market size and forecast 2023-2028
      • Chart on Europe - Market size and forecast 2023-2028 ($ million)
      • Data Table on Europe - Market size and forecast 2023-2028 ($ million)
      • Chart on Europe - Year-over-year growth 2023-2028 (%)
      • Data Table on Europe - Year-over-year growth 2023-2028 (%)
    • 8.5 Asia - Market size and forecast 2023-2028
      • Chart on Asia - Market size and forecast 2023-2028 ($ million)
      • Data Table on Asia - Market size and forecast 2023-2028 ($ million)
      • Chart on Asia - Year-over-year growth 2023-2028 (%)
      • Data Table on Asia - Year-over-year growth 2023-2028 (%)
    • 8.6 Rest of World (ROW) - Market size and forecast 2023-2028
      • Chart on Rest of World (ROW) - Market size and forecast 2023-2028 ($ million)
      • Data Table on Rest of World (ROW) - Market size and forecast 2023-2028 ($ million)
      • Chart on Rest of World (ROW) - Year-over-year growth 2023-2028 (%)
      • Data Table on Rest of World (ROW) - Year-over-year growth 2023-2028 (%)
    • 8.7 US - Market size and forecast 2023-2028
      • Chart on US - Market size and forecast 2023-2028 ($ million)
      • Data Table on US - Market size and forecast 2023-2028 ($ million)
      • Chart on US - Year-over-year growth 2023-2028 (%)
      • Data Table on US - Year-over-year growth 2023-2028 (%)
    • 8.8 Finland - Market size and forecast 2023-2028
      • Chart on Finland - Market size and forecast 2023-2028 ($ million)
      • Data Table on Finland - Market size and forecast 2023-2028 ($ million)
      • Chart on Finland - Year-over-year growth 2023-2028 (%)
      • Data Table on Finland - Year-over-year growth 2023-2028 (%)
    • 8.9 China - Market size and forecast 2023-2028
      • Chart on China - Market size and forecast 2023-2028 ($ million)
      • Data Table on China - Market size and forecast 2023-2028 ($ million)
      • Chart on China - Year-over-year growth 2023-2028 (%)
      • Data Table on China - Year-over-year growth 2023-2028 (%)
    • 8.10 Canada - Market size and forecast 2023-2028
      • Chart on Canada - Market size and forecast 2023-2028 ($ million)
      • Data Table on Canada - Market size and forecast 2023-2028 ($ million)
      • Chart on Canada - Year-over-year growth 2023-2028 (%)
      • Data Table on Canada - Year-over-year growth 2023-2028 (%)
    • 8.11 India - Market size and forecast 2023-2028
      • Chart on India - Market size and forecast 2023-2028 ($ million)
      • Data Table on India - Market size and forecast 2023-2028 ($ million)
      • Chart on India - Year-over-year growth 2023-2028 (%)
      • Data Table on India - Year-over-year growth 2023-2028 (%)
    • 8.12 Market opportunity by geography
      • Market opportunity by geography ($ million)
      • Data Tables on Market opportunity by geography ($ million)

    9 Drivers, Challenges, and Opportunity/Restraints

    • 9.1 Market drivers
      • 9.2 Market challenges
        • 9.3 Impact of drivers and challenges
          • Impact of drivers and challenges in 2023 and 2028
        • 9.4 Market opportunities/restraints

          10 Competitive Landscape

          • 10.1 Overview
            • 10.2 Competitive Landscape
              • Overview on criticality of inputs and factors of differentiation
            • 10.3 Landscape disruption
              • Overview on factors of disruption
            • 10.4 Industry risks
              • Impact of key risks on business

            11 Competitive Analysis

            • 11.1 Companies profiled
              • Companies covered
            • 11.2 Market positioning of companies
              • Matrix on companies position and classification
            • 11.3 AbbVie
              • AbbVie - Overview
              • AbbVie - Product / Service
              • AbbVie - Key offerings
            • 11.4 Amgen Inc.
              • Amgen Inc. - Overview
              • Amgen Inc. - Product / Service
              • Amgen Inc. - Key news
              • Amgen Inc. - Key offerings
            • 11.5 Bristol Myers Squibb Co.
              • Bristol Myers Squibb Co. - Overview
              • Bristol Myers Squibb Co. - Product / Service
              • Bristol Myers Squibb Co. - Key news
              • Bristol Myers Squibb Co. - Key offerings
            • 11.6 Galderma SA
              • Galderma SA - Overview
              • Galderma SA - Product / Service
              • Galderma SA - Key offerings
            • 11.7 Johnson and Johnson Services Inc.
              • Johnson and Johnson Services Inc. - Overview
              • Johnson and Johnson Services Inc. - Business segments
              • Johnson and Johnson Services Inc. - Key news
              • Johnson and Johnson Services Inc. - Key offerings
              • Johnson and Johnson Services Inc. - Segment focus
            • 11.8 LEO Pharma AS
              • LEO Pharma AS - Overview
              • LEO Pharma AS - Business segments
              • LEO Pharma AS - Key offerings
              • LEO Pharma AS - Segment focus
            • 11.9 Novartis AG
              • Novartis AG - Overview
              • Novartis AG - Business segments
              • Novartis AG - Key news
              • Novartis AG - Key offerings
              • Novartis AG - Segment focus
            • 11.10 Pfizer Inc.
              • Pfizer Inc. - Overview
              • Pfizer Inc. - Product / Service
              • Pfizer Inc. - Key news
              • Pfizer Inc. - Key offerings
            • 11.11 Sanofi SA
              • Sanofi SA - Overview
              • Sanofi SA - Business segments
              • Sanofi SA - Key news
              • Sanofi SA - Key offerings
              • Sanofi SA - Segment focus

            12 Appendix

            • 12.1 Scope of the report
              • 12.2 Inclusions and exclusions checklist
                • Inclusions checklist
                • Exclusions checklist
              • 12.3 Currency conversion rates for US$
                • Currency conversion rates for US$
              • 12.4 Research methodology
                • Research methodology
              • 12.5 Data procurement
                • Information sources
              • 12.6 Data validation
                • Data validation
              • 12.7 Validation techniques employed for market sizing
                • Validation techniques employed for market sizing
              • 12.8 Data synthesis
                • Data synthesis
              • 12.9 360 degree market analysis
                • 360 degree market analysis
              • 12.10 List of abbreviations
                • List of abbreviations

              Research Methodology

              Technavio presents a detailed picture of the market by way of study, synthesis, and summation of data from multiple sources. The analysts have presented the various facets of the market with a particular focus on identifying the key industry influencers. The data thus presented is comprehensive, reliable, and the result of extensive research, both primary and secondary.

              INFORMATION SOURCES

              Primary sources

              • Manufacturers and suppliers
              • Channel partners
              • Industry experts
              • Strategic decision makers

              Secondary sources

              • Industry journals and periodicals
              • Government data
              • Financial reports of key industry players
              • Historical data
              • Press releases

              DATA ANALYSIS

              Data Synthesis

              • Collation of data
              • Estimation of key figures
              • Analysis of derived insights

              Data Validation

              • Triangulation with data models
              • Reference against proprietary databases
              • Corroboration with industry experts

              REPORT WRITING

              Qualitative

              • Market drivers
              • Market challenges
              • Market trends
              • Five forces analysis

              Quantitative

              • Market size and forecast
              • Market segmentation
              • Geographical insights
              • Competitive landscape

              Interested in this report?

              Get your sample now to see our research methodology and insights!

              Download Now

              Frequently Asked Questions

              Dermatological Drugs market growth will increase by $ 11992.5 mn during 2024-2028 .

              The Dermatological Drugs market is expected to grow at a CAGR of 10.03% during 2024-2028 .

              Dermatological Drugs market is segmented by Product( Biologics, Small molecules, Others)

              AbbVie, Amgen Inc., Bausch Health Companies Inc., Botanix Pharmaceutical, Bristol Myers Squibb Co., Cipla Inc., Dr Reddys Laboratories Ltd., F. Hoffmann La Roche Ltd., Galderma SA, GlaxoSmithKline Plc, Johnson and Johnson Services Inc., LEO Pharma AS, Lupin Ltd., Novartis AG, Pfizer Inc., Sanofi SA, Sol Gel Technologies Ltd., Sun Pharmaceutical Industries Ltd., UCB SA, Vibcare Pharma Pvt. Ltd. are a few of the key vendors in the Dermatological Drugs market.

              Europe will register the highest growth rate of 34% among the other regions. Therefore, the Dermatological Drugs market in Europe is expected to garner significant business opportunities for the vendors during the forecast period.

              US, Finland, China, Canada, India

              • Need for safe and stable drugs that require minimal monitoringThe dermatological drugs market has a huge requirement for safe and stable drugs that require minimal monitoring. Presently is the driving factor this market.
              • most drugs used to treat severe dermatologic conditions are associated with neuropsychiatric adverse effects. They are dose- and duration-dependent and hence require systematic monitoring for identifying adverse effects. Rational drug use is conventionally defined as the use of appropriate is the driving factor this market.
              • effective is the driving factor this market.
              • safe is the driving factor this market.
              • and cost-effective therapies in the recommended dosage and formulation for correct indications and for the required duration. Rational prescription by the dermatologist involves defining the illness is the driving factor this market.
              • specifying therapy objectives is the driving factor this market.
              • using personalized treatment is the driving factor this market.
              • initiating treatment is the driving factor this market.
              • providing information to patients is the driving factor this market.
              • and monitoring the patient. Since most available dermatological drugs require repeated and long-term use is the driving factor this market.
              • the term 'rational prescription' may not be valid. The stability of most dermatological drugs also varies depending on climate. For instance is the driving factor this market.
              • extreme climatic conditions can reduce the potency of drugs is the driving factor this market.
              • with some drugs degrading faster than others. Hence is the driving factor this market.
              • there is a need for drugs that show sufficient chemical is the driving factor this market.
              • physical is the driving factor this market.
              • and microbial stability in varied climatic conditions. is the driving factor this market.

              The Dermatological Drugs market vendors should focus on grabbing business opportunities from the Biologics segment as it accounted for the largest market share in the base year.