Biosimilars Market Analysis, Size, and Forecast 2026-2030: North America (US, Canada, and Mexico), Europe (Germany, UK, and France), APAC (China, India, and Japan), South America (Brazil, Argentina, and Colombia), Middle East and Africa (Saudi Arabia, UAE, and Turkey), Asia, Rest of World (ROW)

Biosimilars Market Analysis, Size, and Forecast 2026-2030:
North America (US, Canada, and Mexico), Europe (Germany, UK, and France), APAC (China, India, and Japan), South America (Brazil, Argentina, and Colombia), Middle East and Africa (Saudi Arabia, UAE, and Turkey), Asia, Rest of World (ROW)

Published: Mar 2026 299 Pages SKU: IRTNTR70710

Market Overview at a Glance

$38.17 B
Market Opportunity
13.3%
CAGR 2025 - 2030
45%
North America Growth
$10.10 B
Monoclonal antibodies segment 2024

Biosimilars Market Size 2026-2030

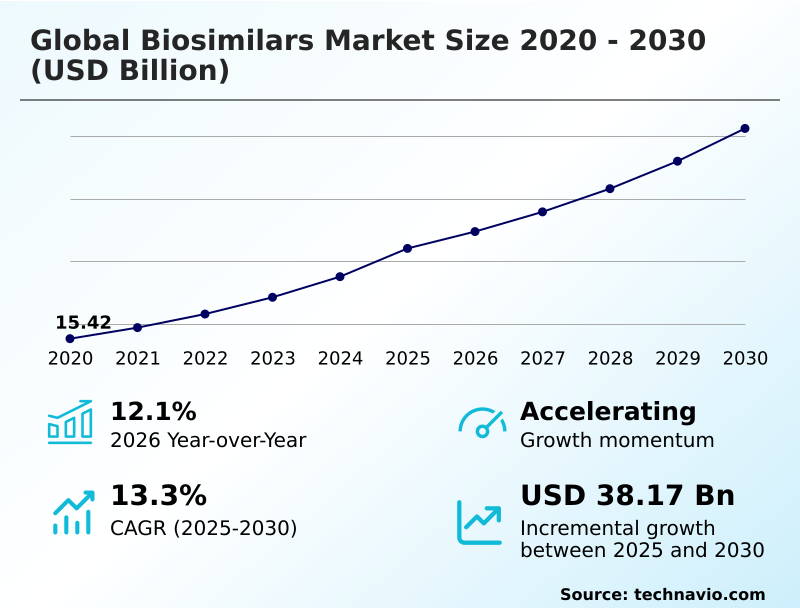
The biosimilars market size is valued to increase by USD 38.17 billion, at a CAGR of 13.3% from 2025 to 2030. Increasing patent expirations and intensifying focus on cost-effectiveness will drive the biosimilars market.

Major Market Trends & Insights

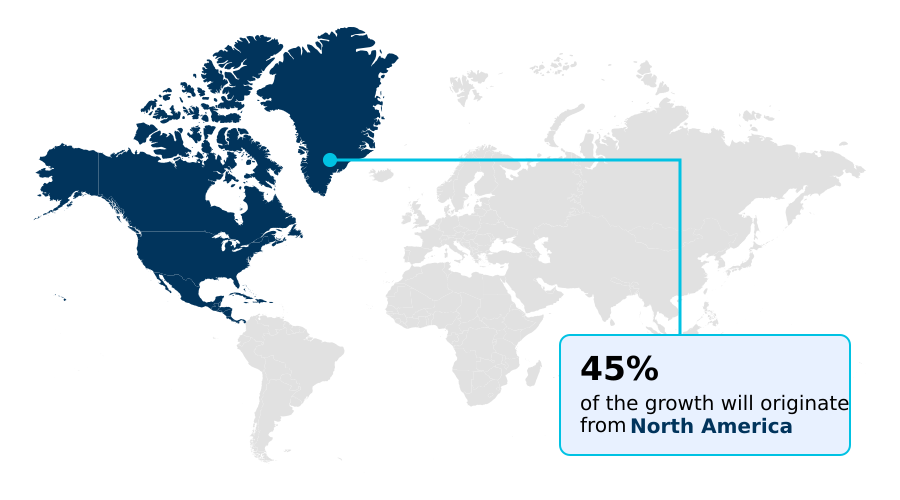
  • North America dominated the market and accounted for a 45% growth during the forecast period.
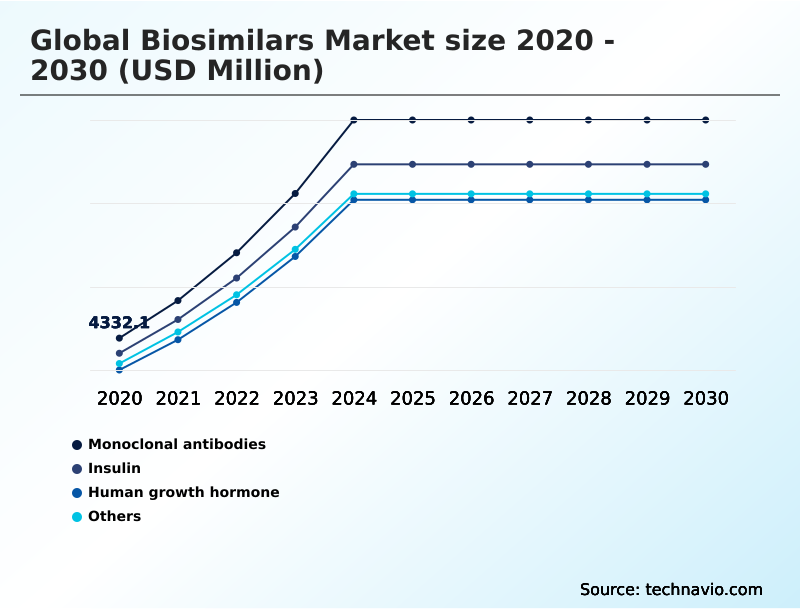
  • By Product Type - Monoclonal antibodies segment was valued at USD 10.10 billion in 2024
  • By Application - Oncology and hematology segment accounted for the largest market revenue share in 2024

Market Size & Forecast

  • Market Opportunities: USD 66.90 billion
  • Market Future Opportunities: USD 38.17 billion
  • CAGR from 2025 to 2030 : 13.3%

Market Summary

  • The biosimilars market is defined by the critical need to balance scientific rigor with commercial viability. The primary driver remains the expiration of patents on high-revenue originator biologics, which opens the door for more affordable yet therapeutically equivalent alternatives.
  • This dynamic is fostering intense competition and pushing manufacturers toward strategic innovations, such as developing products with interchangeability designations to gain a competitive edge at the pharmacy level. However, the path to market is fraught with challenges, including navigating complex patent thickets and overcoming lingering physician and patient reluctance.
  • For instance, a biopharmaceutical firm must leverage advanced analytical characterization and robust clinical data to create a compelling totality-of-the-evidence package for regulatory submission. Successfully demonstrating indistinguishable pharmacokinetic and pharmacodynamic profiles is not merely a scientific hurdle but a crucial commercial step.
  • This rigorous validation process, essential for gaining prescriber confidence, directly impacts market penetration and the realization of cost savings for healthcare systems. As the industry matures, the focus is shifting from simple replication to creating bio-betters and expanding into new therapeutic areas, signaling a more sophisticated and value-driven future.

What will be the Size of the Biosimilars Market during the forecast period?

Get Key Insights on Market Forecast (PDF) Request Free Sample

How is the Biosimilars Market Segmented?

The biosimilars industry research report provides comprehensive data (region-wise segment analysis), with forecasts and estimates in "USD million" for the period 2026-2030, as well as historical data from 2020-2024 for the following segments.

  • Product type
    • Monoclonal antibodies
    • Insulin
    • Human growth hormone
    • Others
  • Application
    • Oncology and hematology
    • Endocrinology
    • Immunology
    • Nephrology
  • Manufacturing type
    • In-house manufacturing
    • Contract manufacturing
  • Geography
    • North America
      • US
      • Canada
      • Mexico
    • Europe
      • Germany
      • UK
      • France
    • Asia
    • Rest of World (ROW)

By Product Type Insights

The monoclonal antibodies segment is estimated to witness significant growth during the forecast period.

The monoclonal antibodies segment is a cornerstone of the biosimilars market, driven by patent expirations of high-revenue biologic drugs. These therapies, essential for oncology and hematology treatments and immunology autoimmune therapies, are subject to intense development focus.

Innovations in peptide mapping and protein aggregation analysis are crucial for demonstrating biosimilarity. Regulatory shifts, such as the increased reliance on a totality-of-the-evidence approach, have streamlined development, with some programs reporting a 20% reduction in pre-clinical validation timelines.

This evolution allows for faster market entry of cost-effective therapeutic alternatives. The emphasis on high-concentration formulations and advanced drug delivery systems further shapes the competitive dynamics within this critical market segment, supporting broader patient access expansion and public health sustainability.

Request Free Sample

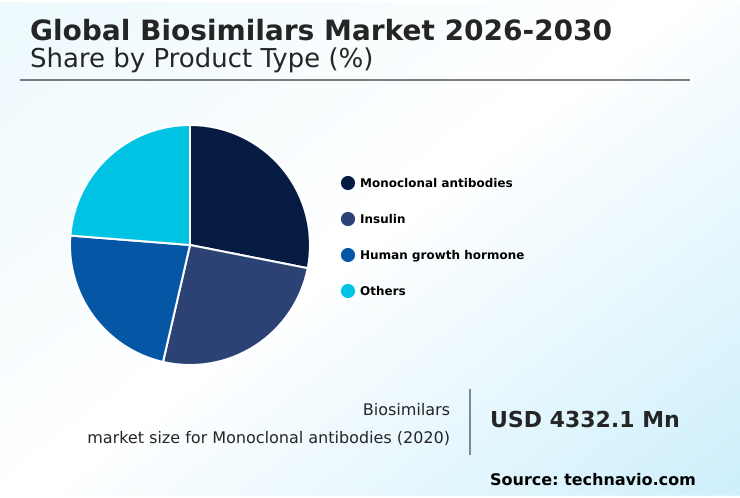
The Monoclonal antibodies segment was valued at USD 10.10 billion in 2024 and showed a gradual increase during the forecast period.

Request Free Sample

Regional Analysis

North America is estimated to contribute 45% to the growth of the global market during the forecast period.Technavio’s analysts have elaborately explained the regional trends and drivers that shape the market during the forecast period.

See How Biosimilars Market Demand is Rising in North America Request Free Sample

The geographic landscape of the market is diverse, with North America, Europe, and Asia representing distinct stages of market maturity.

North America leads in revenue, where regulatory advancements under the Biologics Price Competition and Innovation Act (BPCIA) have supported a steady influx of new products.

Europe is a mature market characterized by high biosimilar uptake, with some nations achieving over 80% market share for certain molecules due to established tender systems.

Asia is emerging as a critical growth hub for both consumption and manufacturing, with regional players leveraging advanced biomanufacturing technologies to produce biologics.

Government support for local production in countries like India and South Korea has helped reduce manufacturing costs by up to 25%, bolstering both domestic supply and export capabilities for off-patent biological medicines.

Market Dynamics

Our researchers analyzed the data with 2025 as the base year, along with the key drivers, trends, and challenges. A holistic analysis of drivers will help companies refine their marketing strategies to gain a competitive advantage.

  • Strategic decision-making in the biosimilars market requires a deep understanding of specific therapeutic and regulatory nuances. For instance, developing a monoclonal antibody biosimilar for oncology demands a different clinical and commercialization strategy than an interchangeable insulin glargine biosimilar, where pharmacy-level substitution is key.
  • The denosumab biosimilar litigation impact analysis highlights the significant risk posed by legal challenges, which can delay market entry. Similarly, the successful launch of an adalimumab biosimilar high-concentration formulation depends on navigating a competitive landscape dominated by an established originator.
  • In specialized fields, bringing an aflibercept biosimilar for macular degeneration or a ustekinumab biosimilar for Crohn's disease to market involves engaging with specific physician groups and patient advocates. Supportive care products, such as a filgrastim biosimilar for neutropenia management or an epoetin alfa biosimilar in chronic kidney disease, have different reimbursement dynamics.
  • The industry is also focused on streamlining regulatory pathways for biosimilars to reduce development timelines. Firms must decide between leveraging the role of CDMOs in biosimilar manufacturing or pursuing the vertical integration benefits for biosimilar producers to control costs. Successfully navigating patent thickets for biologic drugs and boosting physician confidence in biosimilar adoption are critical for success.
  • The ultimate goal is realizing significant cost savings from biosimilar substitution, where the impact of interchangeability on market uptake cannot be overstated. Companies must weigh a biobetter development versus a biosimilar strategy, considering the potential for biosimilar expansion in emerging markets.
  • Advanced manufacturing for biologic production and the global harmonization of biosimilar regulations are essential for ensuring supply chain security for biologic medicines, with integrated supply chains showing up to 15% greater resilience to disruptions.

What are the key market drivers leading to the rise in the adoption of Biosimilars Industry?

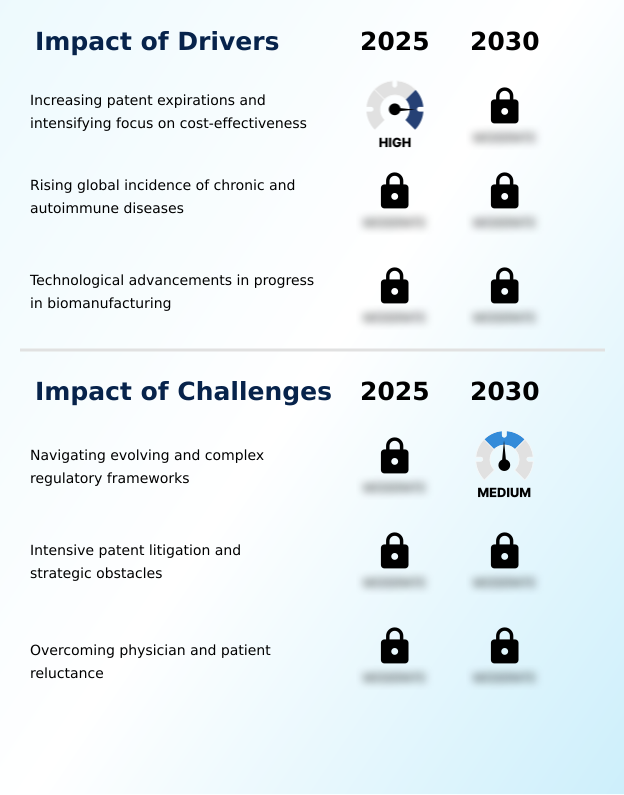
  • The market's growth is primarily driven by the increasing number of patent expirations for major biologics, coupled with an intensified focus on cost-effectiveness within global healthcare systems.

  • Market growth is fundamentally driven by the continuing wave of patent expirations for major biologics, which enables the introduction of cost-effective therapeutic alternatives.
  • This focus on healthcare expenditure reduction is a powerful incentive for payers, with biosimilar adoption capable of lowering treatment costs by over 35% in competitive therapeutic classes.
  • The rising global incidence of chronic conditions further fuels demand for sustainable solutions in chronic disease management and nephrology patient care. Concurrently, the refinement of regulatory frameworks, including the totality-of-the-evidence approach, is streamlining development without compromising on immunogenicity assessment.
  • These clearer regulatory submission pathways, combined with advancements in biomanufacturing, are lowering entry barriers and fostering a more dynamic and competitive market.

What are the market trends shaping the Biosimilars Industry?

  • A key market trend is the strategic shift from standard biosimilar development to the pursuit of interchangeability designations. Concurrently, there is a growing focus on creating bio-betters, which offer enhanced therapeutic performance over existing biologics.

  • Key market trends reflect a strategic evolution beyond direct replication toward value-added differentiation. A primary focus is on securing an interchangeability designation, a regulatory status that can boost market penetration by over 30% in its first year by enabling pharmacy-level substitution. Concurrently, some firms are pursuing biobetters development, creating enhanced versions of existing biologics.
  • There is also a notable expansion into new therapeutic areas, including ophthalmology and neurology, diversifying from the initial focus on oncology and immunology. This is complemented by a move toward vertical integration and the adoption of advanced biomanufacturing technologies.
  • In-house control over production can shorten development-to-market timelines by up to 20%, providing a significant competitive advantage and enhancing biopharmaceutical supply chain security.

What challenges does the Biosimilars Industry face during its growth?

  • A key challenge affecting industry growth is the need for manufacturers to navigate complex and evolving regulatory frameworks across different global jurisdictions.

  • Despite strong growth drivers, the market faces significant challenges that can impede progress. Aggressive legal strategies from originator companies, including the creation of patent thickets, present a persistent intellectual property litigation risk that can delay market entry by several years. The lack of complete regulatory framework harmonization across key global regions creates complexity and increases development costs.
  • Another critical hurdle is overcoming physician and patient adoption hesitancy, which is often rooted in a lack of understanding of the rigorous science behind therapeutic equivalence demonstration. In some specialized fields, biosimilar uptake remains 40% lower than in primary care settings, highlighting the ongoing need for targeted education to build trust and ensure market access strategies are effective.

Exclusive Technavio Analysis on Customer Landscape

The biosimilars market forecasting report includes the adoption lifecycle of the market, covering from the innovator’s stage to the laggard’s stage. It focuses on adoption rates in different regions based on penetration. Furthermore, the biosimilars market report also includes key purchase criteria and drivers of price sensitivity to help companies evaluate and develop their market growth analysis strategies.

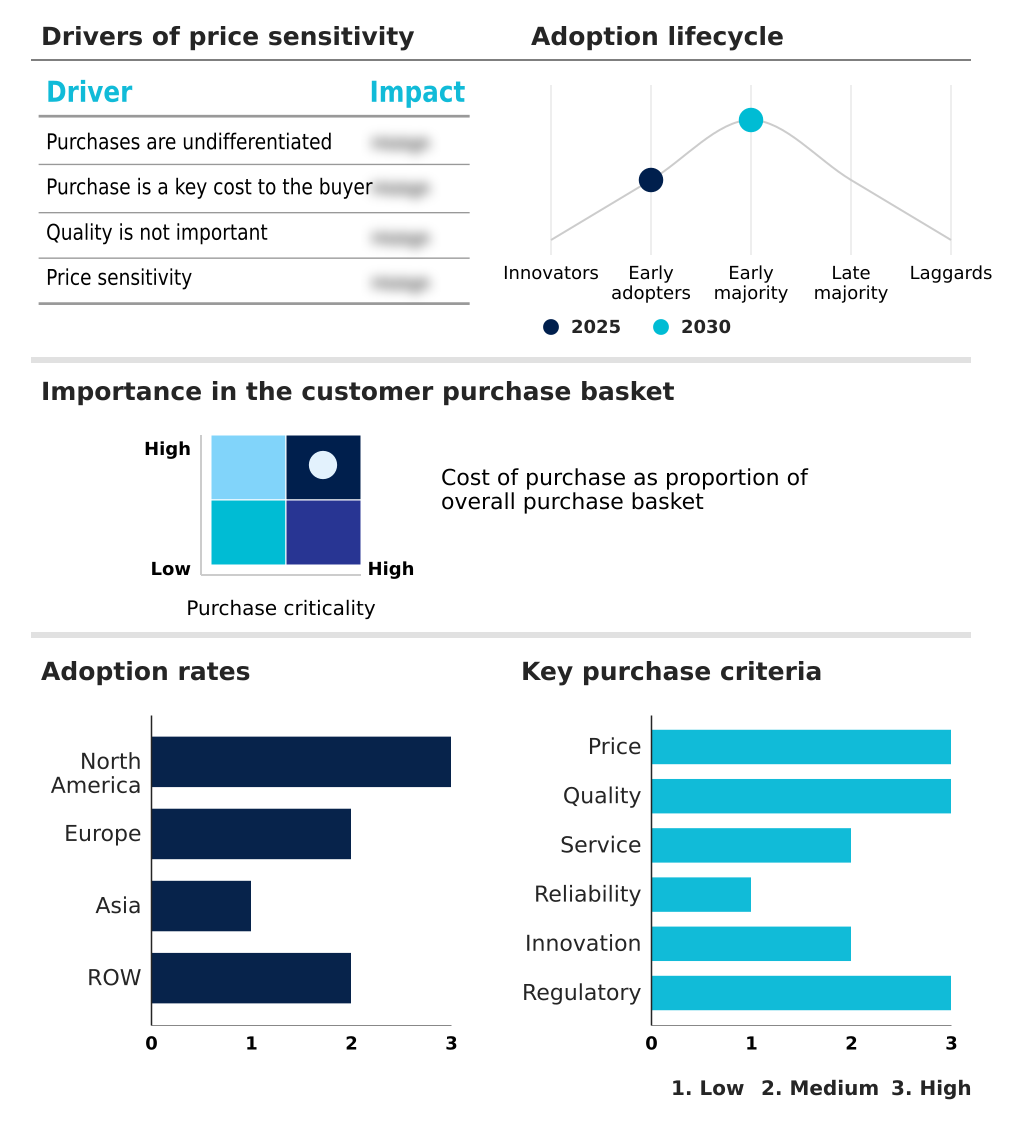
Customer Landscape of Biosimilars Industry

Competitive Landscape

Companies are implementing various strategies, such as strategic alliances, biosimilars market forecast, partnerships, mergers and acquisitions, geographical expansion, and product/service launches, to enhance their presence in the industry.

Abbott Laboratories - The firm’s offerings center on producing high-quality, cost-effective biologic alternatives to expand patient access in critical therapeutic areas through advanced scientific development and manufacturing.

The industry research and growth report includes detailed analyses of the competitive landscape of the market and information about key companies, including:

  • Abbott Laboratories
  • Biocon Ltd.
  • Dr. Reddys Laboratories Ltd.
  • Fresenius Kabi AG
  • Intas Pharmaceuticals Ltd.
  • Kashiv Biosciences LLC
  • Mabxience Holding S.L.
  • NeuClone Pty Ltd.
  • Organon and Co.
  • Pfizer Inc.
  • Reliance Life Sciences Pvt. Ltd.
  • Samsung Bioepis Co. Ltd.
  • Sandoz Group AG
  • STADA Arzneimittel AG
  • Teva Pharmaceutical Ltd.
  • Viatris Inc.
  • Zentiva Group
  • Zydus Lifesciences Ltd.

Qualitative and quantitative analysis of companies has been conducted to help clients understand the wider business environment as well as the strengths and weaknesses of key industry players. Data is qualitatively analyzed to categorize companies as pure play, category-focused, industry-focused, and diversified; it is quantitatively analyzed to categorize companies as dominant, leading, strong, tentative, and weak.

Recent Development and News in Biosimilars market

  • In May 2025, Formycon and its partner Fresenius Kabi announced that their ustekinumab biosimilar, Otulfi (ustekinumab-aauz), was designated as interchangeable by the US Food and Drug Administration, allowing for substitution at the pharmacy level.
  • In April 2025, Boehringer Ingelheim announced it had received the first interchangeable designation for its adalimumab biosimilar, Cyltezo, in a high-concentration formulation, directly challenging the market-dominant version of Humira.
  • In April 2025, Biocon Biologics Ltd. announced that the US Food and Drug Administration approved Johevne (bevacizumab-nila), a biosimilar referencing Avastin, for treating various cancers including colorectal, lung, and certain brain tumors.
  • In January 2025, Amgen initiated the US launch of Wezlana (ustekinumab-auub), the first biosimilar to reference Stelara, providing a lower-cost biologic option for patients with conditions such as Crohn's disease and plaque psoriasis.

Dive into Technavio’s robust research methodology, blending expert interviews, extensive data synthesis, and validated models for unparalleled Biosimilars Market insights. See full methodology.

Market Scope
Page number 299
Base year 2025
Historic period 2020-2024
Forecast period 2026-2030
Growth momentum & CAGR Accelerate at a CAGR of 13.3%
Market growth 2026-2030 USD 38171.7 million
Market structure Fragmented
YoY growth 2025-2026(%) 12.1%
Key countries US, Canada, Mexico, Germany, UK, France, Italy, Spain, The Netherlands, China, India, Japan, South Korea, Thailand, Indonesia, Brazil, Saudi Arabia, UAE, Turkey, Argentina, South Africa, Colombia and Israel
Competitive landscape Leading Companies, Market Positioning of Companies, Competitive Strategies, and Industry Risks

Request Free Sample

Research Analyst Overview

  • The biosimilars market is predicated on delivering high-quality biologic medical products as alternatives to established reference biologic drugs. Successful market entry hinges on meticulous analytical characterization, including peptide mapping and analysis of post-translational modifications, to prove similarity.
  • The industry is witnessing a strategic shift toward vertical integration in biopharma, a boardroom-level decision involving significant capex to gain control over the entire production process, from cell line development and upstream fermentation to downstream purification and final fill-finish operations.
  • This strategy, coupled with the adoption of process analytical technology (PAT), has enabled some manufacturers to improve batch-to-batch consistency by over 30%. Development pipelines are increasingly focused on complex molecules like monoclonal antibodies, insulin analogs, and human growth hormone (somatropin), alongside supportive care biologics such as granulocyte colony-stimulating factors (G-CSF) and erythropoiesis-stimulating agents (ESAs).
  • Adherence to good manufacturing practice (gmp) compliance is non-negotiable, whether production is in-house or managed by a contract development and manufacturing organization (cdmo). As more anti-angiogenic agents and tumor necrosis factor (tnf) inhibitors come off patent, the competitive landscape will intensify, making manufacturing efficiency a key differentiator.

What are the Key Data Covered in this Biosimilars Market Research and Growth Report?

  • What is the expected growth of the Biosimilars Market between 2026 and 2030?

    • USD 38.17 billion, at a CAGR of 13.3%

  • What segmentation does the market report cover?

    • The report is segmented by Product Type (Monoclonal antibodies, Insulin, Human growth hormone, and Others), Application (Oncology and hematology, Endocrinology, Immunology, and Nephrology), Manufacturing Type (In-house manufacturing, and Contract manufacturing) and Geography (North America, Europe, Asia, Rest of World (ROW))

  • Which regions are analyzed in the report?

    • North America, Europe, Asia and Rest of World (ROW)

  • What are the key growth drivers and market challenges?

    • Increasing patent expirations and intensifying focus on cost-effectiveness, Navigating evolving and complex regulatory frameworks

  • Who are the major players in the Biosimilars Market?

    • Abbott Laboratories, Biocon Ltd., Dr. Reddys Laboratories Ltd., Fresenius Kabi AG, Intas Pharmaceuticals Ltd., Kashiv Biosciences LLC, Mabxience Holding S.L., NeuClone Pty Ltd., Organon and Co., Pfizer Inc., Reliance Life Sciences Pvt. Ltd., Samsung Bioepis Co. Ltd., Sandoz Group AG, STADA Arzneimittel AG, Teva Pharmaceutical Ltd., Viatris Inc., Zentiva Group and Zydus Lifesciences Ltd.

Market Research Insights

  • The market's dynamics are shaped by a push for healthcare expenditure reduction, where value-based payment models are gaining traction and have been shown to increase biosimilar adoption by up to 15% in certain health systems. The development of cost-effective therapeutic alternatives is paramount, with strategic partnerships accelerating market entry by an average of 20%.
  • Companies are focused on patient access expansion, leveraging streamlined regulatory pathways to serve unmet needs in chronic disease management. This competitive environment encourages biopharmaceutical innovation, including the creation of high-concentration formulations. Ensuring public health sustainability remains a core objective, with off-patent biological medicines playing a crucial role in managing costs while maintaining high standards of care.

We can help! Our analysts can customize this biosimilars market research report to meet your requirements.

Get in touch

1. Executive Summary

1.1 Market overview

Executive Summary - Chart on Market Overview
Executive Summary - Data Table on Market Overview
Executive Summary - Chart on Global Market Characteristics
Executive Summary - Chart on Market by Geography
Executive Summary - Chart on Market Segmentation by Product Type
Executive Summary - Chart on Market Segmentation by Application
Executive Summary - Chart on Market Segmentation by Manufacturing Type
Executive Summary - Chart on Incremental Growth
Executive Summary - Data Table on Incremental Growth
Executive Summary - Chart on Company Market Positioning

2. Technavio Analysis

2.1 Analysis of price sensitivity, lifecycle, customer purchase basket, adoption rates, and purchase criteria

2.2 Criticality of inputs and Factors of differentiation

Chart on Overview on criticality of inputs and factors of differentiation

2.3 Factors of disruption

Chart on Overview on factors of disruption

2.4 Impact of drivers and challenges

Chart on Impact of drivers and challenges in 2025 and 2030

3. Market Landscape

3.1 Market ecosystem

Chart on Parent Market
Data Table on - Parent Market

3.2 Market characteristics

Chart on Market characteristics analysis

3.3 Value chain analysis

Chart on Value chain analysis

4. Market Sizing

4.1 Market definition

Data Table on Offerings of companies included in the market definition

4.2 Market segment analysis

Market segments

4.3 Market size 2025

4.4 Market outlook: Forecast for 2025-2030

Chart on Global - Market size and forecast 2025-2030 ($ million)
Data Table on Global - Market size and forecast 2025-2030 ($ million)
Chart on Global Market: Year-over-year growth 2025-2030 (%)
Data Table on Global Market: Year-over-year growth 2025-2030 (%)

5. Historic Market Size

5.1 Global Biosimilars Market 2020 - 2024

Historic Market Size - Data Table on Global Biosimilars Market 2020 - 2024 ($ million)

5.2 Product Type segment analysis 2020 - 2024

Historic Market Size - Product Type Segment 2020 - 2024 ($ million)

5.3 Application segment analysis 2020 - 2024

Historic Market Size - Application Segment 2020 - 2024 ($ million)

5.4 Manufacturing Type segment analysis 2020 - 2024

Historic Market Size - Manufacturing Type Segment 2020 - 2024 ($ million)

5.5 Geography segment analysis 2020 - 2024

Historic Market Size - Geography Segment 2020 - 2024 ($ million)

5.6 Country segment analysis 2020 - 2024

Historic Market Size - Country Segment 2020 - 2024 ($ million)

6. Qualitative Analysis

6.1 AI Impact on Global Biosimilars Market

6.2 Impact of Geopolitical Conflict on Global Biosimilars Market

7. Five Forces Analysis

7.1 Five forces summary

Five forces analysis - Comparison between 2025 and 2030

7.2 Bargaining power of buyers

Bargaining power of buyers - Impact of key factors 2025 and 2030

7.3 Bargaining power of suppliers

Bargaining power of suppliers - Impact of key factors in 2025 and 2030

7.4 Threat of new entrants

Threat of new entrants - Impact of key factors in 2025 and 2030

7.5 Threat of substitutes

Threat of substitutes - Impact of key factors in 2025 and 2030

7.6 Threat of rivalry

Threat of rivalry - Impact of key factors in 2025 and 2030

7.7 Market condition

Chart on Market condition - Five forces 2025 and 2030

8. Market Segmentation by Product Type

8.1 Market segments

Chart on Product Type - Market share 2025-2030 (%)
Data Table on Product Type - Market share 2025-2030 (%)

8.2 Comparison by Product Type

Chart on Comparison by Product Type
Data Table on Comparison by Product Type

8.3 Monoclonal antibodies - Market size and forecast 2025-2030

Chart on Monoclonal antibodies - Market size and forecast 2025-2030 ($ million)
Data Table on Monoclonal antibodies - Market size and forecast 2025-2030 ($ million)
Chart on Monoclonal antibodies - Year-over-year growth 2025-2030 (%)
Data Table on Monoclonal antibodies - Year-over-year growth 2025-2030 (%)

8.4 Insulin - Market size and forecast 2025-2030

Chart on Insulin - Market size and forecast 2025-2030 ($ million)
Data Table on Insulin - Market size and forecast 2025-2030 ($ million)
Chart on Insulin - Year-over-year growth 2025-2030 (%)
Data Table on Insulin - Year-over-year growth 2025-2030 (%)

8.5 Human growth hormone - Market size and forecast 2025-2030

Chart on Human growth hormone - Market size and forecast 2025-2030 ($ million)
Data Table on Human growth hormone - Market size and forecast 2025-2030 ($ million)
Chart on Human growth hormone - Year-over-year growth 2025-2030 (%)
Data Table on Human growth hormone - Year-over-year growth 2025-2030 (%)

8.6 Others - Market size and forecast 2025-2030

Chart on Others - Market size and forecast 2025-2030 ($ million)
Data Table on Others - Market size and forecast 2025-2030 ($ million)
Chart on Others - Year-over-year growth 2025-2030 (%)
Data Table on Others - Year-over-year growth 2025-2030 (%)

8.7 Market opportunity by Product Type

Market opportunity by Product Type ($ million)
Data Table on Market opportunity by Product Type ($ million)

9. Market Segmentation by Application

9.1 Market segments

Chart on Application - Market share 2025-2030 (%)
Data Table on Application - Market share 2025-2030 (%)

9.2 Comparison by Application

Chart on Comparison by Application
Data Table on Comparison by Application

9.3 Oncology and hematology - Market size and forecast 2025-2030

Chart on Oncology and hematology - Market size and forecast 2025-2030 ($ million)
Data Table on Oncology and hematology - Market size and forecast 2025-2030 ($ million)
Chart on Oncology and hematology - Year-over-year growth 2025-2030 (%)
Data Table on Oncology and hematology - Year-over-year growth 2025-2030 (%)

9.4 Endocrinology - Market size and forecast 2025-2030

Chart on Endocrinology - Market size and forecast 2025-2030 ($ million)
Data Table on Endocrinology - Market size and forecast 2025-2030 ($ million)
Chart on Endocrinology - Year-over-year growth 2025-2030 (%)
Data Table on Endocrinology - Year-over-year growth 2025-2030 (%)

9.5 Immunology - Market size and forecast 2025-2030

Chart on Immunology - Market size and forecast 2025-2030 ($ million)
Data Table on Immunology - Market size and forecast 2025-2030 ($ million)
Chart on Immunology - Year-over-year growth 2025-2030 (%)
Data Table on Immunology - Year-over-year growth 2025-2030 (%)

9.6 Nephrology - Market size and forecast 2025-2030

Chart on Nephrology - Market size and forecast 2025-2030 ($ million)
Data Table on Nephrology - Market size and forecast 2025-2030 ($ million)
Chart on Nephrology - Year-over-year growth 2025-2030 (%)
Data Table on Nephrology - Year-over-year growth 2025-2030 (%)

9.7 Market opportunity by Application

Market opportunity by Application ($ million)
Data Table on Market opportunity by Application ($ million)

10. Market Segmentation by Manufacturing Type

10.1 Market segments

Chart on Manufacturing Type - Market share 2025-2030 (%)
Data Table on Manufacturing Type - Market share 2025-2030 (%)

10.2 Comparison by Manufacturing Type

Chart on Comparison by Manufacturing Type
Data Table on Comparison by Manufacturing Type

10.3 In-house manufacturing - Market size and forecast 2025-2030

Chart on In-house manufacturing - Market size and forecast 2025-2030 ($ million)
Data Table on In-house manufacturing - Market size and forecast 2025-2030 ($ million)
Chart on In-house manufacturing - Year-over-year growth 2025-2030 (%)
Data Table on In-house manufacturing - Year-over-year growth 2025-2030 (%)

10.4 Contract manufacturing - Market size and forecast 2025-2030

Chart on Contract manufacturing - Market size and forecast 2025-2030 ($ million)
Data Table on Contract manufacturing - Market size and forecast 2025-2030 ($ million)
Chart on Contract manufacturing - Year-over-year growth 2025-2030 (%)
Data Table on Contract manufacturing - Year-over-year growth 2025-2030 (%)

10.5 Market opportunity by Manufacturing Type

Market opportunity by Manufacturing Type ($ million)
Data Table on Market opportunity by Manufacturing Type ($ million)

11. Customer Landscape

11.1 Customer landscape overview

Analysis of price sensitivity, lifecycle, customer purchase basket, adoption rates, and purchase criteria

12. Geographic Landscape

12.1 Geographic segmentation

Chart on Market share by geography 2025-2030 (%)
Data Table on Market share by geography 2025-2030 (%)

12.2 Geographic comparison

Chart on Geographic comparison
Data Table on Geographic comparison

12.3 North America - Market size and forecast 2025-2030

Chart on North America - Market size and forecast 2025-2030 ($ million)
Data Table on North America - Market size and forecast 2025-2030 ($ million)
Chart on North America - Year-over-year growth 2025-2030 (%)
Data Table on North America - Year-over-year growth 2025-2030 (%)
Chart on Regional Comparison - North America
Data Table on Regional Comparison - North America

12.3.1 US - Market size and forecast 2025-2030

Chart on US - Market size and forecast 2025-2030 ($ million)
Data Table on US - Market size and forecast 2025-2030 ($ million)
Chart on US - Year-over-year growth 2025-2030 (%)
Data Table on US - Year-over-year growth 2025-2030 (%)

12.3.2 Canada - Market size and forecast 2025-2030

Chart on Canada - Market size and forecast 2025-2030 ($ million)
Data Table on Canada - Market size and forecast 2025-2030 ($ million)
Chart on Canada - Year-over-year growth 2025-2030 (%)
Data Table on Canada - Year-over-year growth 2025-2030 (%)

12.3.3 Mexico - Market size and forecast 2025-2030

Chart on Mexico - Market size and forecast 2025-2030 ($ million)
Data Table on Mexico - Market size and forecast 2025-2030 ($ million)
Chart on Mexico - Year-over-year growth 2025-2030 (%)
Data Table on Mexico - Year-over-year growth 2025-2030 (%)

12.4 Europe - Market size and forecast 2025-2030

Chart on Europe - Market size and forecast 2025-2030 ($ million)
Data Table on Europe - Market size and forecast 2025-2030 ($ million)
Chart on Europe - Year-over-year growth 2025-2030 (%)
Data Table on Europe - Year-over-year growth 2025-2030 (%)
Chart on Regional Comparison - Europe
Data Table on Regional Comparison - Europe

12.4.1 Germany - Market size and forecast 2025-2030

Chart on Germany - Market size and forecast 2025-2030 ($ million)
Data Table on Germany - Market size and forecast 2025-2030 ($ million)
Chart on Germany - Year-over-year growth 2025-2030 (%)
Data Table on Germany - Year-over-year growth 2025-2030 (%)

12.4.2 UK - Market size and forecast 2025-2030

Chart on UK - Market size and forecast 2025-2030 ($ million)
Data Table on UK - Market size and forecast 2025-2030 ($ million)
Chart on UK - Year-over-year growth 2025-2030 (%)
Data Table on UK - Year-over-year growth 2025-2030 (%)

12.4.3 France - Market size and forecast 2025-2030

Chart on France - Market size and forecast 2025-2030 ($ million)
Data Table on France - Market size and forecast 2025-2030 ($ million)
Chart on France - Year-over-year growth 2025-2030 (%)
Data Table on France - Year-over-year growth 2025-2030 (%)

12.4.4 Italy - Market size and forecast 2025-2030

Chart on Italy - Market size and forecast 2025-2030 ($ million)
Data Table on Italy - Market size and forecast 2025-2030 ($ million)
Chart on Italy - Year-over-year growth 2025-2030 (%)
Data Table on Italy - Year-over-year growth 2025-2030 (%)

12.4.5 Spain - Market size and forecast 2025-2030

Chart on Spain - Market size and forecast 2025-2030 ($ million)
Data Table on Spain - Market size and forecast 2025-2030 ($ million)
Chart on Spain - Year-over-year growth 2025-2030 (%)
Data Table on Spain - Year-over-year growth 2025-2030 (%)

12.4.6 The Netherlands - Market size and forecast 2025-2030

Chart on The Netherlands - Market size and forecast 2025-2030 ($ million)
Data Table on The Netherlands - Market size and forecast 2025-2030 ($ million)
Chart on The Netherlands - Year-over-year growth 2025-2030 (%)
Data Table on The Netherlands - Year-over-year growth 2025-2030 (%)

12.5 Asia - Market size and forecast 2025-2030

Chart on Asia - Market size and forecast 2025-2030 ($ million)
Data Table on Asia - Market size and forecast 2025-2030 ($ million)
Chart on Asia - Year-over-year growth 2025-2030 (%)
Data Table on Asia - Year-over-year growth 2025-2030 (%)
Chart on Regional Comparison - Asia
Data Table on Regional Comparison - Asia

12.5.1 China - Market size and forecast 2025-2030

Chart on China - Market size and forecast 2025-2030 ($ million)
Data Table on China - Market size and forecast 2025-2030 ($ million)
Chart on China - Year-over-year growth 2025-2030 (%)
Data Table on China - Year-over-year growth 2025-2030 (%)

12.5.2 India - Market size and forecast 2025-2030

Chart on India - Market size and forecast 2025-2030 ($ million)
Data Table on India - Market size and forecast 2025-2030 ($ million)
Chart on India - Year-over-year growth 2025-2030 (%)
Data Table on India - Year-over-year growth 2025-2030 (%)

12.5.3 Japan - Market size and forecast 2025-2030

Chart on Japan - Market size and forecast 2025-2030 ($ million)
Data Table on Japan - Market size and forecast 2025-2030 ($ million)
Chart on Japan - Year-over-year growth 2025-2030 (%)
Data Table on Japan - Year-over-year growth 2025-2030 (%)

12.5.4 South Korea - Market size and forecast 2025-2030

Chart on South Korea - Market size and forecast 2025-2030 ($ million)
Data Table on South Korea - Market size and forecast 2025-2030 ($ million)
Chart on South Korea - Year-over-year growth 2025-2030 (%)
Data Table on South Korea - Year-over-year growth 2025-2030 (%)

12.5.5 Thailand - Market size and forecast 2025-2030

Chart on Thailand - Market size and forecast 2025-2030 ($ million)
Data Table on Thailand - Market size and forecast 2025-2030 ($ million)
Chart on Thailand - Year-over-year growth 2025-2030 (%)
Data Table on Thailand - Year-over-year growth 2025-2030 (%)

12.5.6 Indonesia - Market size and forecast 2025-2030

Chart on Indonesia - Market size and forecast 2025-2030 ($ million)
Data Table on Indonesia - Market size and forecast 2025-2030 ($ million)
Chart on Indonesia - Year-over-year growth 2025-2030 (%)
Data Table on Indonesia - Year-over-year growth 2025-2030 (%)

12.6 Rest of World (ROW) - Market size and forecast 2025-2030

Chart on Rest of World (ROW) - Market size and forecast 2025-2030 ($ million)
Data Table on Rest of World (ROW) - Market size and forecast 2025-2030 ($ million)
Chart on Rest of World (ROW) - Year-over-year growth 2025-2030 (%)
Data Table on Rest of World (ROW) - Year-over-year growth 2025-2030 (%)
Chart on Regional Comparison - Rest of World (ROW)
Data Table on Regional Comparison - Rest of World (ROW)

12.6.1 Brazil - Market size and forecast 2025-2030

Chart on Brazil - Market size and forecast 2025-2030 ($ million)
Data Table on Brazil - Market size and forecast 2025-2030 ($ million)
Chart on Brazil - Year-over-year growth 2025-2030 (%)
Data Table on Brazil - Year-over-year growth 2025-2030 (%)

12.6.2 Saudi Arabia - Market size and forecast 2025-2030

Chart on Saudi Arabia - Market size and forecast 2025-2030 ($ million)
Data Table on Saudi Arabia - Market size and forecast 2025-2030 ($ million)
Chart on Saudi Arabia - Year-over-year growth 2025-2030 (%)
Data Table on Saudi Arabia - Year-over-year growth 2025-2030 (%)

12.6.3 UAE - Market size and forecast 2025-2030

Chart on UAE - Market size and forecast 2025-2030 ($ million)
Data Table on UAE - Market size and forecast 2025-2030 ($ million)
Chart on UAE - Year-over-year growth 2025-2030 (%)
Data Table on UAE - Year-over-year growth 2025-2030 (%)

12.6.4 Turkey - Market size and forecast 2025-2030

Chart on Turkey - Market size and forecast 2025-2030 ($ million)
Data Table on Turkey - Market size and forecast 2025-2030 ($ million)
Chart on Turkey - Year-over-year growth 2025-2030 (%)
Data Table on Turkey - Year-over-year growth 2025-2030 (%)

12.6.5 Argentina - Market size and forecast 2025-2030

Chart on Argentina - Market size and forecast 2025-2030 ($ million)
Data Table on Argentina - Market size and forecast 2025-2030 ($ million)
Chart on Argentina - Year-over-year growth 2025-2030 (%)
Data Table on Argentina - Year-over-year growth 2025-2030 (%)

12.6.6 South Africa - Market size and forecast 2025-2030

Chart on South Africa - Market size and forecast 2025-2030 ($ million)
Data Table on South Africa - Market size and forecast 2025-2030 ($ million)
Chart on South Africa - Year-over-year growth 2025-2030 (%)
Data Table on South Africa - Year-over-year growth 2025-2030 (%)

12.6.7 Colombia - Market size and forecast 2025-2030

Chart on Colombia - Market size and forecast 2025-2030 ($ million)
Data Table on Colombia - Market size and forecast 2025-2030 ($ million)
Chart on Colombia - Year-over-year growth 2025-2030 (%)
Data Table on Colombia - Year-over-year growth 2025-2030 (%)

12.6.8 Israel - Market size and forecast 2025-2030

Chart on Israel - Market size and forecast 2025-2030 ($ million)
Data Table on Israel - Market size and forecast 2025-2030 ($ million)
Chart on Israel - Year-over-year growth 2025-2030 (%)
Data Table on Israel - Year-over-year growth 2025-2030 (%)

12.7 Market opportunity by geography

Market opportunity by geography ($ million)
Data Tables on Market opportunity by geography ($ million)

13. Drivers, Challenges, and Opportunity

13.1 Market drivers

Increasing patent expirations and intensifying focus on cost-effectiveness
Rising global incidence of chronic and autoimmune diseases
Technological advancements in progress in biomanufacturing

13.2 Market challenges

Navigating evolving and complex regulatory frameworks
Intensive patent litigation and strategic obstacles
Overcoming physician and patient reluctance

13.3 Impact of drivers and challenges

Impact of drivers and challenges in 2025 and 2030

13.4 Market opportunities

Strategic shift towards interchangeability and pursuit of bio betters
Expansion into novel therapeutic areas and increased focus on emerging markets
Embracing vertical integration and advanced manufacturing technologies

14. Competitive Landscape

14.1 Overview

14.2

Overview on criticality of inputs and factors of differentiation

14.3 Landscape disruption

Overview on factors of disruption

14.4 Industry risks

Impact of key risks on business

15. Competitive Analysis

15.1 Companies profiled

Companies covered

15.2 Company ranking index

15.3 Market positioning of companies

Matrix on companies position and classification

15.4 Abbott Laboratories

Abbott Laboratories - Overview
Abbott Laboratories - Business segments
Abbott Laboratories - Key news
Abbott Laboratories - Key offerings
Abbott Laboratories - Segment focus
SWOT

15.5 Biocon Ltd.

Biocon Ltd. - Overview
Biocon Ltd. - Business segments
Biocon Ltd. - Key offerings
Biocon Ltd. - Segment focus
SWOT

15.6 Dr. Reddys Laboratories Ltd.

Dr. Reddys Laboratories Ltd. - Overview
Dr. Reddys Laboratories Ltd. - Business segments
Dr. Reddys Laboratories Ltd. - Key news
Dr. Reddys Laboratories Ltd. - Key offerings
Dr. Reddys Laboratories Ltd. - Segment focus
SWOT

15.7 Fresenius Kabi AG

Fresenius Kabi AG - Overview
Fresenius Kabi AG - Product / Service
Fresenius Kabi AG - Key offerings
SWOT

15.8 Intas Pharmaceuticals Ltd.

Intas Pharmaceuticals Ltd. - Overview
Intas Pharmaceuticals Ltd. - Product / Service
Intas Pharmaceuticals Ltd. - Key offerings
SWOT

15.9 NeuClone Pty Ltd.

NeuClone Pty Ltd. - Overview
NeuClone Pty Ltd. - Product / Service
NeuClone Pty Ltd. - Key offerings
SWOT

15.10 Organon and Co.

Organon and Co. - Overview
Organon and Co. - Product / Service
Organon and Co. - Key offerings
SWOT

15.11 Pfizer Inc.

Pfizer Inc. - Overview
Pfizer Inc. - Business segments
Pfizer Inc. - Key news
Pfizer Inc. - Key offerings
Pfizer Inc. - Segment focus
SWOT

15.12 Reliance Life Sciences Pvt. Ltd.

Reliance Life Sciences Pvt. Ltd. - Overview
Reliance Life Sciences Pvt. Ltd. - Product / Service
Reliance Life Sciences Pvt. Ltd. - Key offerings
SWOT

15.13 Sandoz Group AG

Sandoz Group AG - Overview
Sandoz Group AG - Business segments
Sandoz Group AG - Key news
Sandoz Group AG - Key offerings
Sandoz Group AG - Segment focus
SWOT

15.14 STADA Arzneimittel AG

STADA Arzneimittel AG - Overview
STADA Arzneimittel AG - Business segments
STADA Arzneimittel AG - Key offerings
STADA Arzneimittel AG - Segment focus
SWOT

15.15 Teva Pharmaceutical Ltd.

Teva Pharmaceutical Ltd. - Overview
Teva Pharmaceutical Ltd. - Business segments
Teva Pharmaceutical Ltd. - Key news
Teva Pharmaceutical Ltd. - Key offerings
Teva Pharmaceutical Ltd. - Segment focus
SWOT

15.16 Viatris Inc.

Viatris Inc. - Overview
Viatris Inc. - Business segments
Viatris Inc. - Key news
Viatris Inc. - Key offerings
Viatris Inc. - Segment focus
SWOT

15.17 Zentiva Group

Zentiva Group - Overview
Zentiva Group - Product / Service
Zentiva Group - Key offerings
SWOT

15.18 Zydus Lifesciences Ltd.

Zydus Lifesciences Ltd. - Overview
Zydus Lifesciences Ltd. - Business segments
Zydus Lifesciences Ltd. - Key news
Zydus Lifesciences Ltd. - Key offerings
Zydus Lifesciences Ltd. - Segment focus
SWOT

16. Appendix

16.1 Scope of the report

Market definition
Objectives
Notes and caveats

16.2 Inclusions and exclusions checklist

Inclusions checklist
Exclusions checklist

16.3 Currency conversion rates for US$

16.4 Research methodology

16.5 Data procurement

Information sources

16.6 Data validation

16.7 Validation techniques employed for market sizing

16.8 Data synthesis

16.9 360 degree market analysis

16.10 List of abbreviations

Research Methodology

Technavio presents a detailed picture of the market by way of study, synthesis, and summation of data from multiple sources. The analysts have presented the various facets of the market with a particular focus on identifying the key industry influencers. The data thus presented is comprehensive, reliable, and the result of extensive research, both primary and secondary.

INFORMATION SOURCES

Primary sources

  • Manufacturers and suppliers
  • Channel partners
  • Industry experts
  • Strategic decision makers

Secondary sources

  • Industry journals and periodicals
  • Government data
  • Financial reports of key industry players
  • Historical data
  • Press releases

DATA ANALYSIS

Data Synthesis

  • Collation of data
  • Estimation of key figures
  • Analysis of derived insights

Data Validation

  • Triangulation with data models
  • Reference against proprietary databases
  • Corroboration with industry experts

REPORT WRITING

Qualitative

  • Market drivers
  • Market challenges
  • Market trends
  • Five forces analysis

Quantitative

  • Market size and forecast
  • Market segmentation
  • Geographical insights
  • Competitive landscape

Interested in this report?

Get your sample now to see our research methodology and insights!

Download Now

Frequently Asked Questions

Biosimilars market growth will increase by USD 38171.7 million during 2026-2030.

The Biosimilars market is expected to grow at a CAGR of 13.3% during 2026-2030.

Biosimilars market is segmented by Product type (Monoclonal antibodies, Insulin, Human growth hormone, Others) Application (Oncology and hematology, Endocrinology, Immunology, Nephrology) Manufacturing type (In-house manufacturing, Contract manufacturing)

Abbott Laboratories, Biocon Ltd., Dr. Reddys Laboratories Ltd., Fresenius Kabi AG, Intas Pharmaceuticals Ltd., Kashiv Biosciences LLC, Mabxience Holding S.L., NeuClone Pty Ltd., Organon and Co., Pfizer Inc., Reliance Life Sciences Pvt. Ltd., Samsung Bioepis Co. Ltd., Sandoz Group AG, STADA Arzneimittel AG, Teva Pharmaceutical Ltd., Viatris Inc., Zentiva Group, Zydus Lifesciences Ltd. are a few of the key vendors in the Biosimilars market.

North America will register the highest growth rate of 45% among the other regions. Therefore, the Biosimilars market in North America is expected to garner significant business opportunities for the vendors during the forecast period.

US, Canada, Mexico, Germany, UK, France, Italy, Spain, The Netherlands, China, India, Japan, South Korea, Thailand, Indonesia, Brazil, Saudi Arabia, UAE, Turkey, Argentina, South Africa, Colombia, Israel

  • Increasing patent expirations and intensifying focus on cost-effectiveness is the driving factor this market.

The Biosimilars market vendors should focus on grabbing business opportunities from the Product type segment as it accounted for the largest market share in the base year.
RIA - Research AI Assistant
Ask RIA