Hyaluronic Acid Market Analysis, Size, and Forecast 2024-2028: North America (US and Canada), Europe (France, Germany, Italy, and UK), Middle East and Africa (Egypt, KSA, Oman, and UAE), APAC (China, India, and Japan), South America (Argentina and Brazil), and Rest of World (ROW)

Hyaluronic Acid Market Analysis, Size, and Forecast 2024-2028:
North America (US and Canada), Europe (France, Germany, Italy, and UK), Middle East and Africa (Egypt, KSA, Oman, and UAE), APAC (China, India, and Japan), South America (Argentina and Brazil), and Rest of World (ROW)

Published: May 2024 180 Pages SKU: IRTNTR75120

Market Overview at a Glance

$4.46 B
Market Opportunity
8.09%
CAGR
7.32
YoY growth 2023-2024(%)

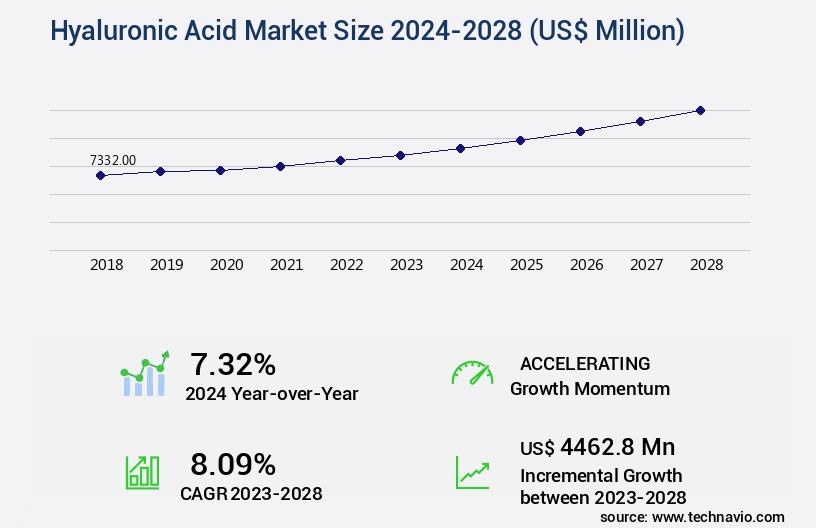
Hyaluronic Acid Market Size 2024-2028

The hyaluronic acid market size is forecast to increase by USD 4.46 billion, at a CAGR of 8.09% between 2023 and 2028.

Major Market Trends & Insights

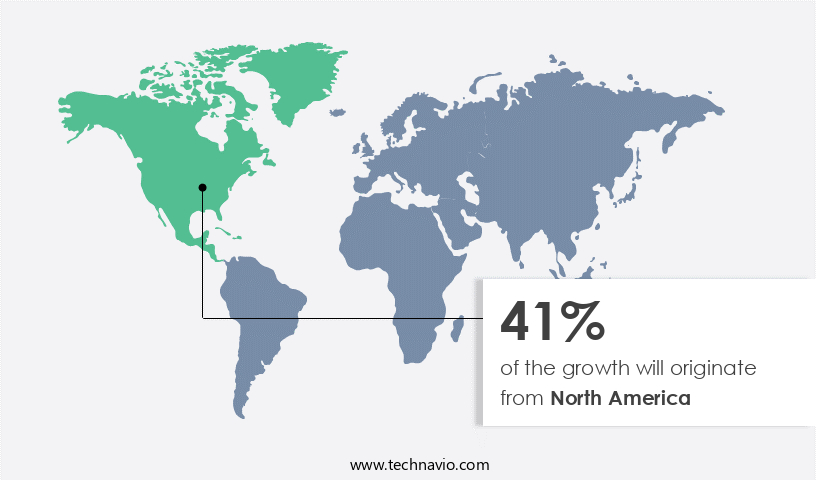
  • North America dominated the market and accounted for a 41% growth during the forecast period.
  • By the Application - Dermal fillers segment was valued at USD 3.57 billion in 2022
  • By the End-user - Pharmaceutical industry segment accounted for the largest market revenue share in 2022

Market Size & Forecast

  • Market Opportunities: USD 88.95 million
  • Market Future Opportunities: USD 4462.80 million
  • CAGR : 8.09%
  • North America: Largest market in 2022

Market Summary

  • The market exhibits significant growth, driven by its widespread applications in various industries. According to market reports, the market size was valued at around USD 6 billion in 2020 and is projected to expand at a steady pace. This expansion is attributed to the increasing demand for hyaluronic acid in the pharmaceutical and cosmetics sectors. In the pharmaceutical industry, hyaluronic acid is used in the production of ophthalmic and orthopedic implants, while in the cosmetics sector, it is a popular ingredient in skincare products due to its hydrating properties.
  • Furthermore, the rising awareness of the benefits of hyaluronic acid and the increasing preference for minimally invasive treatments are also fueling market growth. Despite these positive trends, raw material availability and price fluctuations remain challenges for market participants.

What will be the Size of the Hyaluronic Acid Market during the forecast period?

Hyaluronic Acid Market Size

Explore market size, adoption trends, and growth potential for hyaluronic acid market Request Free Sample

  • The market encompasses a diverse range of applications, driven by its unique properties and increasing demand for advanced skincare and biomedical solutions. With a global market size projected to reach USD 10.5 billion by 2026, representing a significant growth from the USD 6.5 billion recorded in 2021, this market showcases a continuous expansion. The structural properties of hyaluronic acid, including its high molecular weight, mechanical strength, and ability to maintain skin barrier function, contribute to its popularity in various industries. In the cosmetics sector, it is used for its immunological response and cell proliferation benefits, while in the medical field, it is employed for its role in reducing inflammation and aiding in drug encapsulation and sustained release.
  • Product characterization, regulatory compliance, and functional groups are essential considerations in the production process. In vivo studies, spectroscopic analysis, and microscopy techniques are employed for product evaluation, ensuring the highest quality and efficacy. Osmotic pressure, packaging requirements, and shelf life are crucial factors in maintaining product stability throughout manufacturing and distribution. Molecular weight determination, processing parameters, and thermal analysis are essential for optimizing yield and improving rheological modeling. Clinical trials, biofilm formation studies, and inflammation reduction assessments are integral to understanding the impact of hyaluronic acid on human health and its potential applications.
  • The market continues to evolve, with ongoing research focusing on innovation in areas such as rheological modeling, drug encapsulation, and yield optimization.

How is this Hyaluronic Acid Industry segmented?

The hyaluronic acid industry research report provides comprehensive data (region-wise segment analysis), with forecasts and estimates in "USD million" for the period 2024-2028, as well as historical data from 2018-2022 for the following segments.
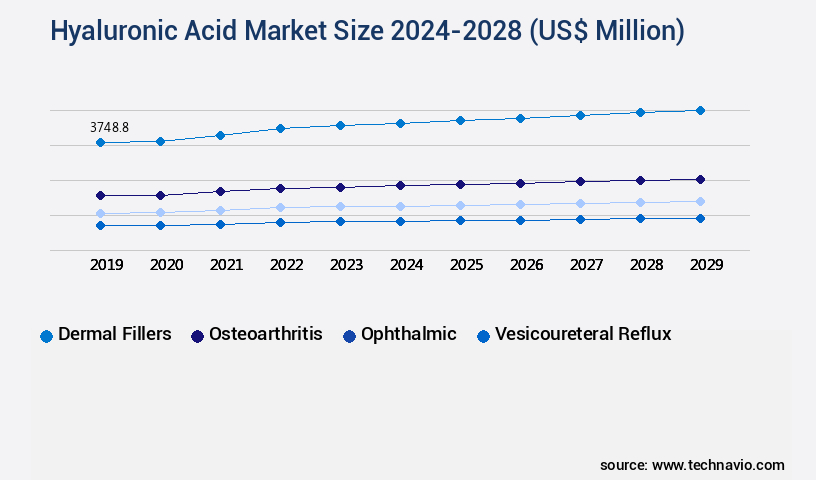
  • Application
    • Dermal fillers
    • Osteoarthritis
    • Ophthalmic
    • Vesicoureteral reflux
  • End-user
    • Pharmaceutical industry
    • Cosmetic industry
  • Type
    • High Molecular Weight
    • Low Molecular Weight
    • Cross-linked Hyaluronic Acid
  • Geography
    • North America
      • US
      • Canada
    • Europe
      • France
      • Germany
      • Italy
      • UK
    • Middle East and Africa
      • Egypt
      • KSA
      • Oman
      • UAE
    • APAC
      • China
      • India
      • Japan
    • South America
      • Argentina
      • Brazil
    • Rest of World (ROW)

By Application Insights

The dermal fillers segment is estimated to witness significant growth during the forecast period.

Hyaluronic acid, a natural polysaccharide, plays a significant role in various industries due to its biocompatibility and biodegradability. In the pharmaceutical sector, hyaluronic acid and its derivatives are utilized for sustained-release drug delivery systems, enhancing medication efficacy through precise attachment to cell surface receptors. This targeted approach is employed for delivering a range of medications, such as proteins, nucleic acids, and anti-aging formulations. In the cosmetics industry, hyaluronic acid's anionic properties contribute to increased skin hydration and improved structural integrity by attracting water and causing swelling. This property is essential for skin care formulations, film casting, and solution viscosity adjustments.

Hyaluronic Acid Market Size

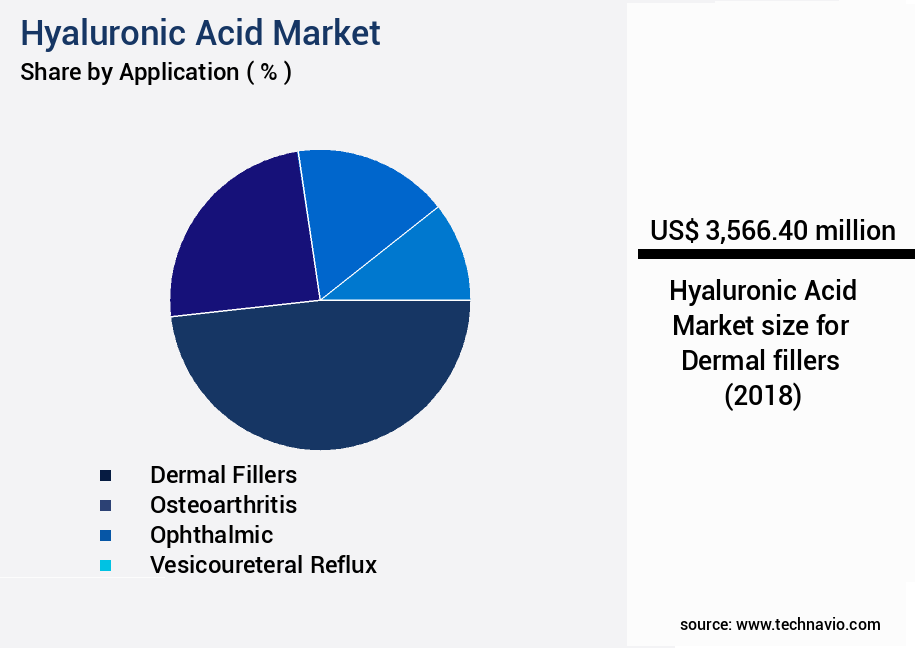
The Dermal fillers segment was valued at USD 3.57 billion in 2018 and showed a gradual increase during the forecast period.

Purification methods, crosslinking density, and esterification reactions are crucial in ensuring the quality of hyaluronic acid-based products. The tissue regeneration sector benefits from hyaluronic acid's ability to stimulate cell growth and promote wound healing. Sterilization techniques, such as freeze-drying and biocompatibility testing, are essential in maintaining the integrity of hyaluronic acid-based products for orthopedic applications. In the medical field, hyaluronic acid is used in injection molding, sodium hyaluronate, and calcium hyaluronate for various applications. Degradation kinetics and hyaluronidase activity are critical factors in determining the product's stability and effectiveness. The market is expanding, with a growing demand for hyaluronic acid in cosmetics and pharmaceutical applications.

For instance, the cosmetics industry is expected to witness a 20% increase in demand for hyaluronic acid due to its ability to enhance skin hydration and elasticity. Additionally, the pharmaceutical sector anticipates a 15% rise in the use of hyaluronic acid for drug delivery systems, driven by the development of advanced formulations and targeted drug delivery methods. These trends underscore the continuous evolution of the market and its potential applications across various industries. The ongoing research and development efforts in purification methods, molecular interactions, particle size distribution, gel formation, and stability studies further contribute to the market's growth and innovation.

Hyaluronic Acid Market Size

Request Free Sample

Regional Analysis

North America is estimated to contribute 41% to the growth of the global market during the forecast period. Technavio's analysts have elaborately explained the regional trends and drivers that shape the market during the forecast period.

Hyaluronic Acid Market Share by Geography

See How Hyaluronic Acid Market Demand is Rising in North America Request Free Sample

The market in North America is experiencing substantial expansion, driven by the burgeoning medical and cosmetic sectors. With advanced healthcare facilities and a consumer focus on anti-aging treatments, such as plastic surgery, the demand for hyaluronic acid is on the rise. Furthermore, the growing instances of osteoarthritis and a sizeable geriatric population contribute to market growth. In the North American region, the prevalence of chronic and infectious skin diseases adds to the demand for this essential ingredient. According to recent studies, the market for hyaluronic acid in North America is projected to expand by approximately 7% in the next year.

Additionally, industry experts anticipate a 5% increase in market size over the next five years. The market's growth can be attributed to the increasing awareness of the benefits of hyaluronic acid in various applications, such as wound healing, joint health, and cosmetic treatments.

Market Dynamics

Our researchers analyzed the data with 2023 as the base year, along with the key drivers, trends, and challenges. A holistic analysis of drivers will help companies refine their marketing strategies to gain a competitive advantage.

The hyaluronic acid (HA) market in the US continues to evolve, with a focus on enhancing performance, efficiency, and compliance. One area of significant interest is the development of sodium hyaluronate crosslinking methods, which improve the stability and durability of HA-based products. These methods, such as photochemical and enzymatic crosslinking, can increase the gel's resistance to degradation mechanisms, ensuring long-term effectiveness. Moreover, understanding the viscosity and molecular weight correlation of HA solutions is crucial for optimizing their rheological behavior. By controlling these properties, manufacturers can create HA hydrogels with the desired consistency for various applications, including cartilage regeneration and wound healing. Innovations in HA production also include chemical modification for drug delivery and optimization of purification processes. Quality control tests, such as rheological characterization and assessments of long-term stability, ensure the consistency and safety of HA-based products. HA's role in cell migration and adhesion, as well as its influence on inflammation, has led to the development of HA-based wound dressings and applications in ophthalmic surgery. In the field of osteoarthritis treatment, HA-based biomaterials for tissue engineering show promise in improving joint function and reducing inflammation. As the HA market continues to grow, it is essential to consider the impact of processing parameters on product quality and the interaction of HA with biological molecules. By focusing on these aspects, manufacturers can create innovative, high-performing HA-based products that meet the evolving needs of the industry.

Hyaluronic Acid Market Size

What are the key market drivers leading to the rise in the adoption of Hyaluronic Acid Industry?

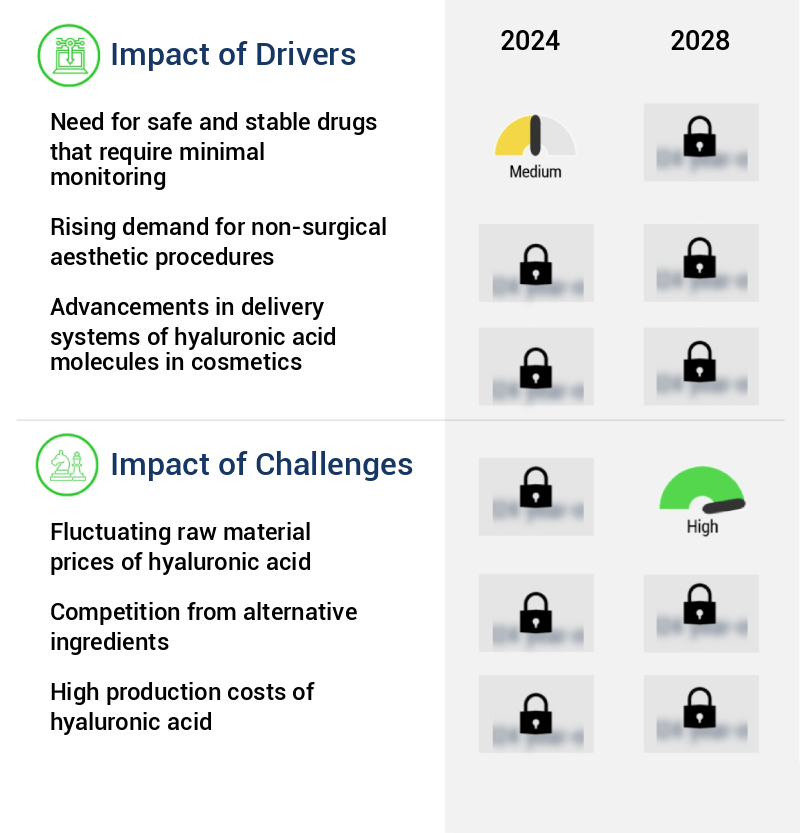
  • The market's primary demand is driven by the necessity for safe and stable drugs that necessitate minimal monitoring from healthcare professionals. 
  • The market encompasses the production and distribution of this naturally occurring biopolymer, which is gaining significant attention due to its versatile applications in various industries. Hyaluronic acid is a crucial component in numerous end-use sectors, including healthcare, cosmetics, and food industries. In healthcare, it is primarily used in the production of injectable drugs for the treatment of various conditions, such as osteoarthritis and dermatological disorders. In the healthcare sector, the demand for hyaluronic acid is driven by the increasing prevalence of chronic diseases and the need for safe and stable drugs. Traditional treatments for severe dermatologic conditions often come with neuropsychiatric adverse effects, which are dose and duration-dependent.
  • Consequently, there is a growing emphasis on rational drug use, which involves defining the illness, specifying therapy objectives, using personalized treatment, initiating treatment, providing information to patients, and monitoring the patient. This approach aims to ensure the use of appropriate, effective, safe, and cost-effective therapies in the recommended dosage and formulation for the correct indications and the required duration. The cosmetics industry also leverages hyaluronic acid due to its excellent water-binding capacity, making it an ideal ingredient for skincare products. It helps maintain skin hydration, elasticity, and suppleness. In the food industry, hyaluronic acid is used as a food additive, primarily as a thickener and stabilizer in various food products.
  • The market is characterized by continuous evolution and unfolding activities. Companies are investing in research and development to expand their product offerings and cater to the growing demand for hyaluronic acid-based products. For instance, there is a rising trend towards the development of biodegradable and eco-friendly hyaluronic acid derivatives. Additionally, the market is witnessing a shift towards the use of alternative sources for hyaluronic acid production, such as microbial fermentation and plant-based sources, to reduce reliance on animal sources. One notable trend in the market is the increasing adoption of hyaluronic acid in the pharmaceutical industry for the development of injectable drugs.
  • According to a study, the global market for hyaluronic acid in pharmaceuticals is projected to grow at a steady pace, driven by the increasing prevalence of chronic diseases and the rising demand for minimally invasive treatments. In contrast, the cosmetics industry is expected to witness a relatively slower growth rate due to the saturation of the market and the increasing competition. The market is a dynamic and evolving industry with significant potential for growth across various sectors. The ongoing research and development efforts, coupled with the increasing demand for safe and effective hyaluronic acid-based products, are expected to drive market growth in the coming years.

What are the market trends shaping the Hyaluronic Acid Industry?

  • Market companies are increasingly engaging in acquisitions and forming joint ventures, which has become a notable trend in the business world.
  • The market is a dynamic and evolving industry, with various sectors leveraging its properties for diverse applications. Manufacturers are actively collaborating and forming strategic alliances to expand their product offerings and cater to the expanding demand. For instance, in March 2022, AbbVie Inc. acquired Syndesi Therapeutics to broaden AbbVie's neuroscience portfolio, gaining access to Syndesi's portfolio of new modulators of the synaptic vesicle protein 2A (SV2A), including its flagship product, SDI-118. This trend of collaboration and expansion is not isolated, as numerous companies continue to explore opportunities in the pharmaceutical sector, particularly in areas like dermatology, orthopedics, and surgical adhesion prevention.
  • These industries' growing reliance on hyaluronic acid for therapeutic applications underscores the market's continuous growth and development. Moreover, the market's expansion is not limited to mergers and acquisitions. Companies are also investing in research and development to innovate new applications and improve existing ones. This commitment to innovation and collaboration is crucial in maintaining the market's competitive edge and addressing the evolving needs of various industries.

What challenges does the Hyaluronic Acid Industry face during its growth?

  • The volatility in the cost of raw materials, specifically hyaluronic acid, poses a significant challenge to the growth of the industry. 
  • Hyaluronic acid, a naturally occurring polysaccharide, is in high demand across various industries due to its exceptional water-binding capacity and viscoelastic properties. This versatile compound is used extensively in the pharmaceutical, cosmetics, and food industries. However, the production of hyaluronic acid faces significant challenges, primarily due to the rising costs of raw materials. Extracted from natural sources like soy, wheat, and animal-based sources such as rooster combs, the procurement of raw materials is a critical factor in the market's growth. The increasing global population and the subsequent rise in demand for hyaluronic acid-based products have put immense pressure on manufacturers to secure a steady supply of raw materials.
  • The extraction process involves the use of essential oils, plant extracts, chemicals, syrups, and vitamins. However, the cost of extracting raw materials from these sources has been on the rise due to stringent regulations for wastewater treatment and waste biomaterials. These regulations, while essential for environmental sustainability, add to the production costs, making hyaluronic acid an expensive commodity. Despite these challenges, the market continues to evolve, with ongoing research and development efforts aimed at finding more cost-effective production methods and alternative sources. The industry's resilience and adaptability are evident in its ability to navigate these challenges and meet the growing demand for its products.
  • In terms of market size, the market was valued at approximately USD 7.5 billion in 2020 and is projected to reach USD 11.5 billion by 2026, growing at a steady pace. The pharmaceutical sector holds the largest market share, accounting for over 50% of the total market value. The cosmetics industry follows closely, with a significant growth rate, driven by the increasing demand for anti-aging and skin care products. The market is a dynamic and evolving industry, facing challenges in raw material procurement but adapting through ongoing research and development efforts.
  • The market's growth is driven by the increasing demand for its products across various sectors, with the pharmaceutical and cosmetics industries leading the way.

Exclusive Customer Landscape

The hyaluronic acid market forecasting report includes the adoption lifecycle of the market, covering from the innovator's stage to the laggard's stage. It focuses on adoption rates in different regions based on penetration. Furthermore, the hyaluronic acid market report also includes key purchase criteria and drivers of price sensitivity to help companies evaluate and develop their market growth analysis strategies.

Hyaluronic Acid Market Share by Geography

 Customer Landscape of Hyaluronic Acid Industry

Key Companies & Market Insights

Companies are implementing various strategies, such as strategic alliances, hyaluronic acid market forecast, partnerships, mergers and acquisitions, geographical expansion, and product/service launches, to enhance their presence in the industry.

Allergan - The company specializes in providing hyaluronic acid-based dermal fillers, including JUVEDERM VOLUX XC, enhancing skin's volume and elasticity for a more youthful appearance. 

The industry research and growth report includes detailed analyses of the competitive landscape of the market and information about key companies, including:

  • Allergan
  • Anika Therapeutics
  • Bausch Health
  • Bioiberica
  • Bioplus Co.
  • Bloomage Biotechnology
  • Bohus BioTech
  • Contipro
  • Evonik Industries
  • Fidia Farmaceutici
  • Galderma
  • HTL Biotechnology
  • Kewpie Corporation
  • Lifecore Biomedical
  • Maruha Nichiro
  • Merz Pharma
  • Seikagaku Corporation
  • Shandong Topscience Biotech
  • Shiseido
  • Sinclair Pharma

Qualitative and quantitative analysis of companies has been conducted to help clients understand the wider business environment as well as the strengths and weaknesses of key industry players. Data is qualitatively analyzed to categorize companies as pure play, category-focused, industry-focused, and diversified; it is quantitatively analyzed to categorize companies as dominant, leading, strong, tentative, and weak.

Recent Development and News in Hyaluronic Acid Market

  • In January 2024, Fidia Farmaceutici, an Italian specialty pharmaceutical company, announced the launch of its new product, Hyaluronan 20 mg/mL, a high-concentration hyaluronic acid (HA) injection for the treatment of osteoarthritis (Reuters). This expansion of their HA product line aimed to cater to the growing demand for advanced treatments in the market.
  • In March 2024, Seppic, a French specialty chemical company, and Galderma, a leading dermatology company, entered into a strategic partnership to develop and commercialize innovative hyaluronic acid-based dermal fillers (Wall Street Journal). This collaboration aimed to leverage Seppic's expertise in HA production and Galderma's market presence in the cosmetics industry.
  • In May 2024, Anhui Bright Dyeing Co., Ltd., a Chinese chemical manufacturer, completed the acquisition of a major stake in Hyaluronan Technology Co., Ltd., a leading HA production company (SEC Filing). This strategic move allowed Anhui Bright Dyeing to expand its presence in the global HA market and strengthen its production capabilities.
  • In February 2025, the European Medicines Agency (EMA) approved the marketing authorization application for Synvisc-One, a single-injection treatment for osteoarthritis using highly concentrated HA from Genzyme, a Sanofi company (Bloomberg). This approval marked a significant milestone in the HA market, offering patients an alternative to multiple-injection treatments.

Research Analyst Overview

  • The market encompasses a diverse range of applications, from cosmetics formulations to orthopedic treatments. This dynamic market is characterized by continuous innovation and evolution, with a particular focus on improving the rheological properties of hyaluronic acid through various methods. One such method is esterification reaction, which enhances the stability and viscosity of hyaluronic acid solutions. This process is crucial in the production of rheology modifiers, which are essential in orthopedic applications, such as joint lubricants and tissue scaffolds. The freeze-drying process is another key technique used in the market, particularly in the manufacture of microsphere production for wound healing and tissue regeneration.
  • Biocompatibility testing is a critical quality control method employed to ensure the safety and efficacy of hyaluronic acid-based products. For instance, sodium hyaluronate, a common form of hyaluronic acid, is extensively used in ophthalmic applications due to its excellent biocompatibility and water retention capacity. The industry growth in the market is anticipated to reach 7% annually, driven by the increasing demand for advanced wound healing products and the expanding use of hyaluronic acid in cosmetics formulations. Moreover, the development of drug delivery systems, such as injection molding and film casting, is expected to further fuel market growth.
  • Molecular interactions, purification methods, crosslinking density, and molecular weight distribution are essential factors influencing the production and application of hyaluronic acid. Stability studies, sterilization techniques, and particle size distribution are other critical aspects that impact the market's dynamics. Chemical modification, such as polymerization degree and degradation kinetics, plays a significant role in the market, enabling the creation of diverse products with tailored properties. Calcium hyaluronate, a derivative of hyaluronic acid, is gaining popularity in the market due to its enhanced biocompatibility and degradation resistance. In the realm of cosmetics, hyaluronic acid's ability to improve skin hydration and provide a smoother appearance has led to its widespread use in various formulations.
  • The ongoing research and development in this area aim to create more effective and stable hyaluronic acid-based products, further expanding the market's potential. In summary, the market is a vibrant and evolving industry, driven by advancements in production techniques, biocompatibility testing, and application development across various sectors. The continuous focus on improving the rheological properties, stability, and safety of hyaluronic acid-based products is expected to fuel the market's growth in the coming years.

Dive into Technavio's robust research methodology, blending expert interviews, extensive data synthesis, and validated models for unparalleled Hyaluronic Acid Market insights. See full methodology.

Market Scope

Report Coverage

Details

Page number

180

Base year

2023

Historic period

2018-2022

Forecast period

2024-2028

Growth momentum & CAGR

Accelerate at a CAGR of 8.09%

Market growth 2024-2028

USD 4462.8 million

Market structure

Fragmented

YoY growth 2023-2024(%)

7.32

Key countries

US, Canada, Germany, UK, Italy, France, China, India, Japan, Brazil, Egypt, UAE, Oman, Argentina, KSA, UAE, Brazil, and Rest of World (ROW)

Competitive landscape

Leading Companies, Market Positioning of Companies, Competitive Strategies, and Industry Risks

Request Free Sample

What are the Key Data Covered in this Hyaluronic Acid Market Research and Growth Report?

  • CAGR of the Hyaluronic Acid industry during the forecast period
  • Detailed information on factors that will drive the growth and forecasting between 2024 and 2028
  • Precise estimation of the size of the market and its contribution of the industry in focus to the parent market
  • Accurate predictions about upcoming growth and trends and changes in consumer behaviour
  • Growth of the market across North America, APAC, Europe, Middle East and Africa, and South America
  • Thorough analysis of the market's competitive landscape and detailed information about companies
  • Comprehensive analysis of factors that will challenge the hyaluronic acid market growth of industry companies

We can help! Our analysts can customize this hyaluronic acid market research report to meet your requirements.

Get in touch

1 Executive Summary

  • 1.1 Market overview
    • Executive Summary - Chart on Market Overview
    • Executive Summary - Data Table on Market Overview
    • Executive Summary - Chart on Global Market Characteristics
    • Executive Summary - Chart on Market by Geography
    • Executive Summary - Chart on Market Segmentation by Application
    • Executive Summary - Chart on Market Segmentation by End-user
    • Executive Summary - Chart on Incremental Growth
    • Executive Summary - Data Table on Incremental Growth
    • Executive Summary - Chart on Company Market Positioning

2 Market Landscape

  • 2.1 Market ecosystem
    • Parent Market
    • Data Table on - Parent Market
  • 2.2 Market characteristics
    • Market characteristics analysis
  • 2.3 Value chain analysis
    • Value Chain Analysis

3 Market Sizing

  • 3.1 Market definition
    • Offerings of companies included in the market definition
  • 3.2 Market segment analysis
    • Market segments
  • 3.3 Market size 2023
    • 3.4 Market outlook: Forecast for 2023-2028
      • Chart on Global - Market size and forecast 2023-2028 ($ million)
      • Data Table on Global - Market size and forecast 2023-2028 ($ million)
      • Chart on Global Market: Year-over-year growth 2023-2028 (%)
      • Data Table on Global Market: Year-over-year growth 2023-2028 (%)

    4 Historic Market Size

    • 4.1 Global Hyaluronic Acid Market 2018 - 2022
      • Historic Market Size - Data Table on Global Hyaluronic Acid Market 2018 - 2022 ($ million)
    • 4.2 Application segment analysis 2018 - 2022
      • Historic Market Size - Application Segment 2018 - 2022 ($ million)
    • 4.3 End-user segment analysis 2018 - 2022
      • Historic Market Size - End-user Segment 2018 - 2022 ($ million)
    • 4.4 Geography segment analysis 2018 - 2022
      • Historic Market Size - Geography Segment 2018 - 2022 ($ million)
    • 4.5 Country segment analysis 2018 - 2022
      • Historic Market Size - Country Segment 2018 - 2022 ($ million)

    5 Five Forces Analysis

    • 5.1 Five forces summary
      • Five forces analysis - Comparison between 2023 and 2028
    • 5.2 Bargaining power of buyers
      • Bargaining power of buyers - Impact of key factors 2023 and 2028
    • 5.3 Bargaining power of suppliers
      • Bargaining power of suppliers - Impact of key factors in 2023 and 2028
    • 5.4 Threat of new entrants
      • Threat of new entrants - Impact of key factors in 2023 and 2028
    • 5.5 Threat of substitutes
      • Threat of substitutes - Impact of key factors in 2023 and 2028
    • 5.6 Threat of rivalry
      • Threat of rivalry - Impact of key factors in 2023 and 2028
    • 5.7 Market condition
      • Chart on Market condition - Five forces 2023 and 2028

    6 Market Segmentation by Application

    • 6.1 Market segments
      • Chart on Application - Market share (2023-2028) (%)
      • Data Table on Application - Market share (2023-2028) (%)
    • 6.2 Comparison by Application
      • Chart on Comparison by Application
      • Data Table on Comparison by Application
    • 6.3 Dermal fillers - Market size and forecast (2023-2028)
      • Chart on Dermal fillers - Market size and forecast (2023-2028) ($ million)
      • Data Table on Dermal fillers - Market size and forecast (2023-2028) ($ million)
      • Chart on Dermal fillers - Year-over-year growth (2023-2028) (%)
      • Data Table on Dermal fillers - Year-over-year growth (2023-2028) (%)
    • 6.4 Osteoarthritis - Market size and forecast (2023-2028)
      • Chart on Osteoarthritis - Market size and forecast (2023-2028) ($ million)
      • Data Table on Osteoarthritis - Market size and forecast (2023-2028) ($ million)
      • Chart on Osteoarthritis - Year-over-year growth (2023-2028) (%)
      • Data Table on Osteoarthritis - Year-over-year growth (2023-2028) (%)
    • 6.5 Ophthalmic - Market size and forecast (2023-2028)
      • Chart on Ophthalmic - Market size and forecast (2023-2028) ($ million)
      • Data Table on Ophthalmic - Market size and forecast (2023-2028) ($ million)
      • Chart on Ophthalmic - Year-over-year growth (2023-2028) (%)
      • Data Table on Ophthalmic - Year-over-year growth (2023-2028) (%)
    • 6.6 Vesicoureteral reflux - Market size and forecast (2023-2028)
      • Chart on Vesicoureteral reflux - Market size and forecast (2023-2028) ($ million)
      • Data Table on Vesicoureteral reflux - Market size and forecast (2023-2028) ($ million)
      • Chart on Vesicoureteral reflux - Year-over-year growth (2023-2028) (%)
      • Data Table on Vesicoureteral reflux - Year-over-year growth (2023-2028) (%)
    • 6.7 Market opportunity by Application
      • Market opportunity by Application ($ million)
      • Data Table on Market opportunity by Application ($ million)

    7 Market Segmentation by End-user

    • 7.1 Market segments
      • Chart on End-user - Market share (2023-2028) (%)
      • Data Table on End-user - Market share (2023-2028) (%)
    • 7.2 Comparison by End-user
      • Chart on Comparison by End-user
      • Data Table on Comparison by End-user
    • 7.3 Pharmaceutical industry - Market size and forecast (2023-2028)
      • Chart on Pharmaceutical industry - Market size and forecast (2023-2028) ($ million)
      • Data Table on Pharmaceutical industry - Market size and forecast (2023-2028) ($ million)
      • Chart on Pharmaceutical industry - Year-over-year growth (2023-2028) (%)
      • Data Table on Pharmaceutical industry - Year-over-year growth (2023-2028) (%)
    • 7.4 Cosmetic industry - Market size and forecast (2023-2028)
      • Chart on Cosmetic industry - Market size and forecast (2023-2028) ($ million)
      • Data Table on Cosmetic industry - Market size and forecast (2023-2028) ($ million)
      • Chart on Cosmetic industry - Year-over-year growth (2023-2028) (%)
      • Data Table on Cosmetic industry - Year-over-year growth (2023-2028) (%)
    • 7.5 Market opportunity by End-user
      • Market opportunity by End-user ($ million)
      • Data Table on Market opportunity by End-user ($ million)

    8 Market Segmentation by Type

    • 8.1 Market segments
      • Chart on Type - Market share (2023-2028) (%)
      • Data Table on Type - Market share (2023-2028) (%)
    • 8.2 Comparison by Type
      • Chart on Comparison by Type
      • Data Table on Comparison by Type
    • 8.3 High Molecular Weight - Market size and forecast (2023-2028)
      • Chart on High Molecular Weight - Market size and forecast (2023-2028) ($ million)
      • Data Table on High Molecular Weight - Market size and forecast (2023-2028) ($ million)
      • Chart on High Molecular Weight - Year-over-year growth (2023-2028) (%)
      • Data Table on High Molecular Weight - Year-over-year growth (2023-2028) (%)
    • 8.4 Low Molecular Weight - Market size and forecast (2023-2028)
      • Chart on Low Molecular Weight - Market size and forecast (2023-2028) ($ million)
      • Data Table on Low Molecular Weight - Market size and forecast (2023-2028) ($ million)
      • Chart on Low Molecular Weight - Year-over-year growth (2023-2028) (%)
      • Data Table on Low Molecular Weight - Year-over-year growth (2023-2028) (%)
    • 8.5 Cross-linked Hyaluronic Acid - Market size and forecast (2023-2028)
      • Chart on Cross-linked Hyaluronic Acid - Market size and forecast (2023-2028) ($ million)
      • Data Table on Cross-linked Hyaluronic Acid - Market size and forecast (2023-2028) ($ million)
      • Chart on Cross-linked Hyaluronic Acid - Year-over-year growth (2023-2028) (%)
      • Data Table on Cross-linked Hyaluronic Acid - Year-over-year growth (2023-2028) (%)
    • 8.6 Market opportunity by Type
      • Market opportunity by Type ($ million)
      • Data Table on Market opportunity by Type ($ million)

    9 Customer Landscape

    • 9.1 Customer landscape overview
      • Analysis of price sensitivity, lifecycle, customer purchase basket, adoption rates, and purchase criteria

    10 Geographic Landscape

    • 10.1 Geographic segmentation
      • Chart on Market share by geography 2023-2028 (%)
      • Data Table on Market share by geography 2023-2028 (%)
    • 10.2 Geographic comparison
      • Chart on Geographic comparison
      • Data Table on Geographic comparison
    • 10.3 North America - Market size and forecast 2023-2028
      • Chart on North America - Market size and forecast 2023-2028 ($ million)
      • Data Table on North America - Market size and forecast 2023-2028 ($ million)
      • Chart on North America - Year-over-year growth 2023-2028 (%)
      • Data Table on North America - Year-over-year growth 2023-2028 (%)
    • 10.4 APAC - Market size and forecast 2023-2028
      • Chart on APAC - Market size and forecast 2023-2028 ($ million)
      • Data Table on APAC - Market size and forecast 2023-2028 ($ million)
      • Chart on APAC - Year-over-year growth 2023-2028 (%)
      • Data Table on APAC - Year-over-year growth 2023-2028 (%)
    • 10.5 Europe - Market size and forecast 2023-2028
      • Chart on Europe - Market size and forecast 2023-2028 ($ million)
      • Data Table on Europe - Market size and forecast 2023-2028 ($ million)
      • Chart on Europe - Year-over-year growth 2023-2028 (%)
      • Data Table on Europe - Year-over-year growth 2023-2028 (%)
    • 10.6 Middle East and Africa - Market size and forecast 2023-2028
      • Chart on Middle East and Africa - Market size and forecast 2023-2028 ($ million)
      • Data Table on Middle East and Africa - Market size and forecast 2023-2028 ($ million)
      • Chart on Middle East and Africa - Year-over-year growth 2023-2028 (%)
      • Data Table on Middle East and Africa - Year-over-year growth 2023-2028 (%)
    • 10.7 South America - Market size and forecast 2023-2028
      • Chart on South America - Market size and forecast 2023-2028 ($ million)
      • Data Table on South America - Market size and forecast 2023-2028 ($ million)
      • Chart on South America - Year-over-year growth 2023-2028 (%)
      • Data Table on South America - Year-over-year growth 2023-2028 (%)
    • 10.8 US - Market size and forecast 2023-2028
      • Chart on US - Market size and forecast 2023-2028 ($ million)
      • Data Table on US - Market size and forecast 2023-2028 ($ million)
      • Chart on US - Year-over-year growth 2023-2028 (%)
      • Data Table on US - Year-over-year growth 2023-2028 (%)
    • 10.9 Canada - Market size and forecast 2023-2028
      • Chart on Canada - Market size and forecast 2023-2028 ($ million)
      • Data Table on Canada - Market size and forecast 2023-2028 ($ million)
      • Chart on Canada - Year-over-year growth 2023-2028 (%)
      • Data Table on Canada - Year-over-year growth 2023-2028 (%)
    • 10.10 China - Market size and forecast 2023-2028
      • Chart on China - Market size and forecast 2023-2028 ($ million)
      • Data Table on China - Market size and forecast 2023-2028 ($ million)
      • Chart on China - Year-over-year growth 2023-2028 (%)
      • Data Table on China - Year-over-year growth 2023-2028 (%)
    • 10.11 South Korea - Market size and forecast 2023-2028
      • Chart on South Korea - Market size and forecast 2023-2028 ($ million)
      • Data Table on South Korea - Market size and forecast 2023-2028 ($ million)
      • Chart on South Korea - Year-over-year growth 2023-2028 (%)
      • Data Table on South Korea - Year-over-year growth 2023-2028 (%)
    • 10.12 Germany - Market size and forecast 2023-2028
      • Chart on Germany - Market size and forecast 2023-2028 ($ million)
      • Data Table on Germany - Market size and forecast 2023-2028 ($ million)
      • Chart on Germany - Year-over-year growth 2023-2028 (%)
      • Data Table on Germany - Year-over-year growth 2023-2028 (%)
    • 10.13 Market opportunity by geography
      • Market opportunity by geography ($ million)
      • Data Tables on Market opportunity by geography ($ million)
    • 10.14 UK - Market size and forecast (2023-2028)
      • Chart on UK - Market size and forecast (2023-2028) ($ million)
      • Data Table on UK - Market size and forecast (2023-2028) ($ million)
      • Chart on UK - Year-over-year growth (2023-2028) (%)
      • Data Table on UK - Year-over-year growth (2023-2028) (%)
    • 10.15 Italy - Market size and forecast (2023-2028)
      • Chart on Italy - Market size and forecast (2023-2028) ($ million)
      • Data Table on Italy - Market size and forecast (2023-2028) ($ million)
      • Chart on Italy - Year-over-year growth (2023-2028) (%)
      • Data Table on Italy - Year-over-year growth (2023-2028) (%)
    • 10.16 France - Market size and forecast (2023-2028)
      • Chart on France - Market size and forecast (2023-2028) ($ million)
      • Data Table on France - Market size and forecast (2023-2028) ($ million)
      • Chart on France - Year-over-year growth (2023-2028) (%)
      • Data Table on France - Year-over-year growth (2023-2028) (%)
    • 10.17 India - Market size and forecast (2023-2028)
      • Chart on India - Market size and forecast (2023-2028) ($ million)
      • Data Table on India - Market size and forecast (2023-2028) ($ million)
      • Chart on India - Year-over-year growth (2023-2028) (%)
      • Data Table on India - Year-over-year growth (2023-2028) (%)
    • 10.18 Japan - Market size and forecast (2023-2028)
      • Chart on Japan - Market size and forecast (2023-2028) ($ million)
      • Data Table on Japan - Market size and forecast (2023-2028) ($ million)
      • Chart on Japan - Year-over-year growth (2023-2028) (%)
      • Data Table on Japan - Year-over-year growth (2023-2028) (%)
    • 10.19 Brazil - Market size and forecast (2023-2028)
      • Chart on Brazil - Market size and forecast (2023-2028) ($ million)
      • Data Table on Brazil - Market size and forecast (2023-2028) ($ million)
      • Chart on Brazil - Year-over-year growth (2023-2028) (%)
      • Data Table on Brazil - Year-over-year growth (2023-2028) (%)
    • 10.20 Egypt - Market size and forecast (2023-2028)
      • Chart on Egypt - Market size and forecast (2023-2028) ($ million)
      • Data Table on Egypt - Market size and forecast (2023-2028) ($ million)
      • Chart on Egypt - Year-over-year growth (2023-2028) (%)
      • Data Table on Egypt - Year-over-year growth (2023-2028) (%)
    • 10.21 UAE - Market size and forecast (2023-2028)
      • Chart on UAE - Market size and forecast (2023-2028) ($ million)
      • Data Table on UAE - Market size and forecast (2023-2028) ($ million)
      • Chart on UAE - Year-over-year growth (2023-2028) (%)
      • Data Table on UAE - Year-over-year growth (2023-2028) (%)
    • 10.22 Oman - Market size and forecast (2023-2028)
      • Chart on Oman - Market size and forecast (2023-2028) ($ million)
      • Data Table on Oman - Market size and forecast (2023-2028) ($ million)
      • Chart on Oman - Year-over-year growth (2023-2028) (%)
      • Data Table on Oman - Year-over-year growth (2023-2028) (%)
    • 10.23 Argentina - Market size and forecast (2023-2028)
      • Chart on Argentina - Market size and forecast (2023-2028) ($ million)
      • Data Table on Argentina - Market size and forecast (2023-2028) ($ million)
      • Chart on Argentina - Year-over-year growth (2023-2028) (%)
      • Data Table on Argentina - Year-over-year growth (2023-2028) (%)
    • 10.24 KSA - Market size and forecast (2023-2028)
      • Chart on KSA - Market size and forecast (2023-2028) ($ million)
      • Data Table on KSA - Market size and forecast (2023-2028) ($ million)
      • Chart on KSA - Year-over-year growth (2023-2028) (%)
      • Data Table on KSA - Year-over-year growth (2023-2028) (%)
    • 10.25 UAE - Market size and forecast (2023-2028)
      • Chart on UAE - Market size and forecast (2023-2028) ($ million)
      • Data Table on UAE - Market size and forecast (2023-2028) ($ million)
      • Chart on UAE - Year-over-year growth (2023-2028) (%)
      • Data Table on UAE - Year-over-year growth (2023-2028) (%)
    • 10.26 Brazil - Market size and forecast (2023-2028)
      • Chart on Brazil - Market size and forecast (2023-2028) ($ million)
      • Data Table on Brazil - Market size and forecast (2023-2028) ($ million)
      • Chart on Brazil - Year-over-year growth (2023-2028) (%)
      • Data Table on Brazil - Year-over-year growth (2023-2028) (%)
    • 10.27 Rest of World (ROW) - Market size and forecast (2023-2028)
      • Chart on Rest of World (ROW) - Market size and forecast (2023-2028) ($ million)
      • Data Table on Rest of World (ROW) - Market size and forecast (2023-2028) ($ million)
      • Chart on Rest of World (ROW) - Year-over-year growth (2023-2028) (%)
      • Data Table on Rest of World (ROW) - Year-over-year growth (2023-2028) (%)

    11 Drivers, Challenges, and Opportunity/Restraints

    • 11.1 Market drivers
      • 11.2 Market challenges
        • 11.3 Impact of drivers and challenges
          • Impact of drivers and challenges in 2023 and 2028
        • 11.4 Market opportunities/restraints

          12 Competitive Landscape

          • 12.1 Overview
            • 12.2 Competitive Landscape
              • Overview on criticality of inputs and factors of differentiation
            • 12.3 Landscape disruption
              • Overview on factors of disruption
            • 12.4 Industry risks
              • Impact of key risks on business

            13 Competitive Analysis

            • 13.1 Companies profiled
              • Companies covered
            • 13.2 Market positioning of companies
              • Matrix on companies position and classification
            • 13.3 Allergan
              • Allergan - Overview
              • Allergan - Product / Service
              • Allergan - Key offerings
            • 13.4 Anika Therapeutics
              • Anika Therapeutics - Overview
              • Anika Therapeutics - Product / Service
              • Anika Therapeutics - Key offerings
            • 13.5 Bausch Health
              • Bausch Health - Overview
              • Bausch Health - Product / Service
              • Bausch Health - Key offerings
            • 13.6 Bioiberica
              • Bioiberica - Overview
              • Bioiberica - Product / Service
              • Bioiberica - Key offerings
            • 13.7 Bioplus Co.
              • Bioplus Co. - Overview
              • Bioplus Co. - Product / Service
              • Bioplus Co. - Key offerings
            • 13.8 Bloomage Biotechnology
              • Bloomage Biotechnology - Overview
              • Bloomage Biotechnology - Product / Service
              • Bloomage Biotechnology - Key offerings
            • 13.9 Bohus BioTech
              • Bohus BioTech - Overview
              • Bohus BioTech - Product / Service
              • Bohus BioTech - Key offerings
            • 13.10 Contipro
              • Contipro - Overview
              • Contipro - Product / Service
              • Contipro - Key offerings
            • 13.11 Evonik Industries
              • Evonik Industries - Overview
              • Evonik Industries - Product / Service
              • Evonik Industries - Key offerings
            • 13.12 Fidia Farmaceutici
              • Fidia Farmaceutici - Overview
              • Fidia Farmaceutici - Product / Service
              • Fidia Farmaceutici - Key offerings
            • 13.13 Galderma
              • Galderma - Overview
              • Galderma - Product / Service
              • Galderma - Key offerings
            • 13.14 HTL Biotechnology
              • HTL Biotechnology - Overview
              • HTL Biotechnology - Product / Service
              • HTL Biotechnology - Key offerings
            • 13.15 Kewpie Corporation
              • Kewpie Corporation - Overview
              • Kewpie Corporation - Product / Service
              • Kewpie Corporation - Key offerings
            • 13.16 Lifecore Biomedical
              • Lifecore Biomedical - Overview
              • Lifecore Biomedical - Product / Service
              • Lifecore Biomedical - Key offerings
            • 13.17 Maruha Nichiro
              • Maruha Nichiro - Overview
              • Maruha Nichiro - Product / Service
              • Maruha Nichiro - Key offerings
            • 13.18 Merz Pharma
              • Merz Pharma - Overview
              • Merz Pharma - Product / Service
              • Merz Pharma - Key offerings
            • 13.19 Seikagaku Corporation
              • Seikagaku Corporation - Overview
              • Seikagaku Corporation - Product / Service
              • Seikagaku Corporation - Key offerings
            • 13.20 Shandong Topscience Biotech
              • Shandong Topscience Biotech - Overview
              • Shandong Topscience Biotech - Product / Service
              • Shandong Topscience Biotech - Key offerings
            • 13.21 Shiseido
              • Shiseido - Overview
              • Shiseido - Product / Service
              • Shiseido - Key offerings
            • 13.22 Sinclair Pharma
              • Sinclair Pharma - Overview
              • Sinclair Pharma - Product / Service
              • Sinclair Pharma - Key offerings
            • 13.23 AbbVie Inc.
              • AbbVie Inc. - Overview
              • AbbVie Inc. - Product / Service
              • AbbVie Inc. - Key offerings
            • 13.24 Abdi Ibrahim Ilac Sanayi ve Tic A.S.
              • Abdi Ibrahim Ilac Sanayi ve Tic A.S. - Overview
              • Abdi Ibrahim Ilac Sanayi ve Tic A.S. - Product / Service
              • Abdi Ibrahim Ilac Sanayi ve Tic A.S. - Key offerings
            • 13.25 Anika Therapeutics Inc.
              • Anika Therapeutics Inc. - Overview
              • Anika Therapeutics Inc. - Product / Service
              • Anika Therapeutics Inc. - Key offerings
            • 13.26 Bausch Health Companies Inc.
              • Bausch Health Companies Inc. - Overview
              • Bausch Health Companies Inc. - Product / Service
              • Bausch Health Companies Inc. - Key offerings
            • 13.27 Bio plus Co. Ltd.
              • Bio plus Co. Ltd. - Overview
              • Bio plus Co. Ltd. - Product / Service
              • Bio plus Co. Ltd. - Key offerings
            • 13.28 BioScience GmbH Cosmetics Trading LLC
              • BioScience GmbH Cosmetics Trading LLC - Overview
              • BioScience GmbH Cosmetics Trading LLC - Product / Service
              • BioScience GmbH Cosmetics Trading LLC - Key offerings
            • 13.29 Bioxis Pharmaceutical
              • Bioxis Pharmaceutical - Overview
              • Bioxis Pharmaceutical - Product / Service
              • Bioxis Pharmaceutical - Key offerings
            • 13.30 Bloomage Biotech Co. Ltd.
              • Bloomage Biotech Co. Ltd. - Overview
              • Bloomage Biotech Co. Ltd. - Product / Service
              • Bloomage Biotech Co. Ltd. - Key offerings
            • 13.31 Ferring BV
              • Ferring BV - Overview
              • Ferring BV - Product / Service
              • Ferring BV - Key offerings
            • 13.32 Fidia Farmaceutici Spa
              • Fidia Farmaceutici Spa - Overview
              • Fidia Farmaceutici Spa - Product / Service
              • Fidia Farmaceutici Spa - Key offerings
            • 13.33 Galderma SA
              • Galderma SA - Overview
              • Galderma SA - Product / Service
              • Galderma SA - Key offerings
            • 13.34 Huadong Medicine Co. Ltd.
              • Huadong Medicine Co. Ltd. - Overview
              • Huadong Medicine Co. Ltd. - Product / Service
              • Huadong Medicine Co. Ltd. - Key offerings
            • 13.35 Laboratoires VIVACY
              • Laboratoires VIVACY - Overview
              • Laboratoires VIVACY - Product / Service
              • Laboratoires VIVACY - Key offerings
            • 13.36 LG Chem Ltd.
              • LG Chem Ltd. - Overview
              • LG Chem Ltd. - Product / Service
              • LG Chem Ltd. - Key offerings
            • 13.37 Merz Pharma GmbH and Co KGaA
              • Merz Pharma GmbH and Co KGaA - Overview
              • Merz Pharma GmbH and Co KGaA - Product / Service
              • Merz Pharma GmbH and Co KGaA - Key offerings
            • 13.38 Sanofi SA
              • Sanofi SA - Overview
              • Sanofi SA - Product / Service
              • Sanofi SA - Key offerings
            • 13.39 SEIKAGAKU CORP.
              • SEIKAGAKU CORP. - Overview
              • SEIKAGAKU CORP. - Product / Service
              • SEIKAGAKU CORP. - Key offerings
            • 13.40 Smith and Nephew plc
              • Smith and Nephew plc - Overview
              • Smith and Nephew plc - Product / Service
              • Smith and Nephew plc - Key offerings
            • 13.41 Syrhatech
              • Syrhatech - Overview
              • Syrhatech - Product / Service
              • Syrhatech - Key offerings
            • 13.42 Teva Pharmaceutical Industries Ltd.
              • Teva Pharmaceutical Industries Ltd. - Overview
              • Teva Pharmaceutical Industries Ltd. - Product / Service
              • Teva Pharmaceutical Industries Ltd. - Key offerings
            • 13.43 Zimmer Biomet Holdings Inc.
              • Zimmer Biomet Holdings Inc. - Overview
              • Zimmer Biomet Holdings Inc. - Product / Service
              • Zimmer Biomet Holdings Inc. - Key offerings

            14 Appendix

            • 14.1 Scope of the report
              • 14.2 Inclusions and exclusions checklist
                • Inclusions checklist
                • Exclusions checklist
              • 14.3 Currency conversion rates for US$
                • Currency conversion rates for US$
              • 14.4 Research methodology
                • Research methodology
              • 14.5 Data procurement
                • Information sources
              • 14.6 Data validation
                • Data validation
              • 14.7 Validation techniques employed for market sizing
                • Validation techniques employed for market sizing
              • 14.8 Data synthesis
                • Data synthesis
              • 14.9 360 degree market analysis
                • 360 degree market analysis
              • 14.10 List of abbreviations
                • List of abbreviations

              Research Methodology

              Technavio presents a detailed picture of the market by way of study, synthesis, and summation of data from multiple sources. The analysts have presented the various facets of the market with a particular focus on identifying the key industry influencers. The data thus presented is comprehensive, reliable, and the result of extensive research, both primary and secondary.

              INFORMATION SOURCES

              Primary sources

              • Manufacturers and suppliers
              • Channel partners
              • Industry experts
              • Strategic decision makers

              Secondary sources

              • Industry journals and periodicals
              • Government data
              • Financial reports of key industry players
              • Historical data
              • Press releases

              DATA ANALYSIS

              Data Synthesis

              • Collation of data
              • Estimation of key figures
              • Analysis of derived insights

              Data Validation

              • Triangulation with data models
              • Reference against proprietary databases
              • Corroboration with industry experts

              REPORT WRITING

              Qualitative

              • Market drivers
              • Market challenges
              • Market trends
              • Five forces analysis

              Quantitative

              • Market size and forecast
              • Market segmentation
              • Geographical insights
              • Competitive landscape

              Interested in this report?

              Get your sample now to see our research methodology and insights!

              Download Now

              Frequently Asked Questions

              Hyaluronic Acid market growth will increase by $ 4462.8 mn during 2024-2028.

              The Hyaluronic Acid market is expected to grow at a CAGR of 8.09% during 2024-2028.

              Hyaluronic Acid market is segmented by Application( Dermal fillers, Osteoarthritis, Ophthalmic, Vesicoureteral reflux) End-user( Pharmaceutical industry, Cosmetic industry)

              Allergan, Anika Therapeutics, Bausch Health, Bioiberica, Bioplus Co., Bloomage Biotechnology, Bohus BioTech, Contipro, Evonik Industries, Fidia Farmaceutici, Galderma, HTL Biotechnology, Kewpie Corporation, Lifecore Biomedical, Maruha Nichiro, Merz Pharma, Seikagaku Corporation, Shandong Topscience Biotech, Shiseido, Sinclair Pharma are a few of the key vendors in the Hyaluronic Acid market.

              North America will register the highest growth rate of 41% among the other regions. Therefore, the Hyaluronic Acid market in North America is expected to garner significant business opportunities for the vendors during the forecast period.

              US, Canada, Germany, UK, Italy, France, China, India, Japan, Brazil, Egypt, UAE, Oman, Argentina, KSA, UAE, Brazil, Rest of World (ROW)

              • Need for safe and stable drugs that require minimal monitoringThe global hyaluronic acid market has a huge requirement for safe and stable drugs that require minimal monitoring. Presently is the driving factor this market.
              • most drugs used to treat severe dermatologic conditions are associated with neuropsychiatric adverse effects. They are dose and duration-dependent and hence require systematic monitoring to identify adverse effects. Rational drug use is conventionally defined as the use of appropriate is the driving factor this market.
              • effective is the driving factor this market.
              • safe is the driving factor this market.
              • and cost-effective therapies in the recommended dosage and formulation for correct indications and the required duration. Rational prescription by the dermatologist involves defining the illness is the driving factor this market.
              • specifying therapy objectives is the driving factor this market.
              • using personalized treatment is the driving factor this market.
              • initiating treatment is the driving factor this market.
              • providing information to patients is the driving factor this market.
              • and monitoring the patient. Since most available dermatological drugs require repeated and long-term use is the driving factor this market.
              • the term rational prescription may not be valid. The stability of most dermatological drugs also varies depending on the climate. For instance is the driving factor this market.
              • extreme climatic conditions can reduce the potency of drugs is the driving factor this market.
              • with some drugs degrading faster than others. Hence is the driving factor this market.
              • there is a need for drugs that show sufficient chemical is the driving factor this market.
              • physical is the driving factor this market.
              • and microbial stability in varied climatic conditions. Such an increase in demand for hyaluronic acid-based dermatological drugs is the driving factor this market.
              • in turn is the driving factor this market.
              • is expected to drive the growth of the global hyaluronic acid market during the forecast period. is the driving factor this market.

              The Hyaluronic Acid market vendors should focus on grabbing business opportunities from the Dermal fillers segment as it accounted for the largest market share in the base year.
              RIA - Research AI Assistant
              Ask RIA