
Plant Based Protein Products Market Analysis, Size, and Forecast 2026-2030: North America (US, Canada, and Mexico), Europe (Germany, UK, and France), APAC (China, Japan, and India), South America (Brazil, Argentina, and Chile), Middle East and Africa (Saudi Arabia, UAE, and South Africa), and Rest of World (ROW)

Plant Based Protein Products Market Analysis, Size, and Forecast 2026-2030:
North America (US, Canada, and Mexico), Europe (Germany, UK, and France), APAC (China, Japan, and India), South America (Brazil, Argentina, and Chile), Middle East and Africa (Saudi Arabia, UAE, and South Africa), and Rest of World (ROW)

Published: May 2026 320 Pages SKU: IRTNTR43044

Market Overview at a Glance

$26.32 B
Market Opportunity
23.3%
CAGR 2025 - 2030
43.8%
North America Growth
$7.26 B
Offline segment 2024

Plant Based Protein Products Market Size 2026-2030

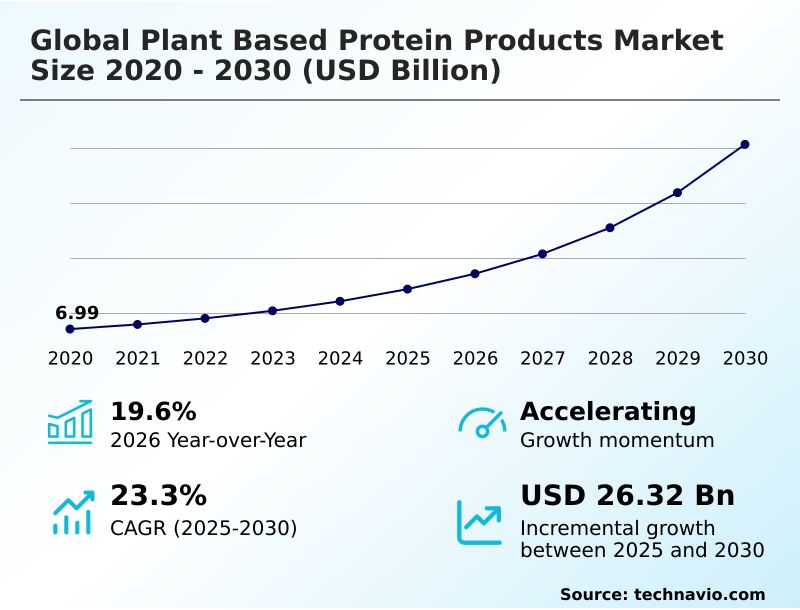
The plant based protein products market size is valued to increase by USD 26.32 billion, at a CAGR of 23.3% from 2025 to 2030. Shift toward functional and authentic nutrition will drive the plant based protein products market.

Major Market Trends & Insights

  • North America dominated the market and accounted for a 43.8% growth during the forecast period.
  • By Distribution Channel - Offline segment was valued at USD 7.26 billion in 2024
  • By Product - Soy protein segment accounted for the largest market revenue share in 2024

Market Size & Forecast

  • Market Opportunities: USD 33.58 billion
  • Market Future Opportunities: USD 26.32 billion
  • CAGR from 2025 to 2030 : 23.3%

Market Summary

  • The Plant Based Protein Products landscape is undergoing a structural transformation as consumer preferences pivot from basic meat imitation toward authentic nutrient-dense formulations. Supply chain optimization strategies now prioritize localized pulse sourcing which reduces raw material transit delays and minimizes exposure to volatile commodity price fluctuations.
  • By regionalizing extraction facilities manufacturers have successfully decreased ingredient procurement costs by 22% compared to traditional international supply networks. A primary driver of this market is the shift toward functional nutrition; as health-conscious shoppers demand holistic well-being companies are compelled to integrate vitamins and dietary fiber directly into their formulations.
  • Conversely consumer skepticism regarding ultra-processed ingredients acts as a significant challenge forcing brands to clean up their labels and drop synthetic stabilizers to maintain buyer trust. Advanced processing technologies are bridging the gap between awareness and daily consumption by improving texture and taste.
  • As a result the integration of Plant Based Protein Products into mainstream culinary applications continues to accelerate across both retail and institutional foodservice channels.

What will be the Size of the Plant Based Protein Products Market during the forecast period?
Get Key Insights on Market Forecast (PDF) Get Free Sample

How is the Plant Based Protein Products Market Segmented?

The plant based protein products industry research report provides comprehensive data (region-wise segment analysis), with forecasts and estimates in "USD million" for the period 2026-2030, as well as historical data from 2020-2024 for the following segments.

  • Distribution channel
    • Offline
    • Online
  • Product
    • Soy protein
    • Wheat protein
    • Pea protein
    • Others
  • Application
    • Beverages
    • Meat analogs
    • Dairy alternatives
    • Bakery products
    • Others
  • Type
    • Protein concentrates
    • Protein isolates
    • Textured proteins
  • Geography
    • North America
      • US
      • Canada
      • Mexico
    • Europe
      • Germany
      • UK
      • France
      • Italy
      • Spain
      • The Netherlands
    • APAC
      • China
      • Japan
      • India
      • Australia
      • South Korea
      • Indonesia
    • South America
      • Brazil
      • Argentina
      • Chile
    • Middle East and Africa
      • Saudi Arabia
      • UAE
      • South Africa
      • Turkey
      • Egypt

By Distribution Channel Insights

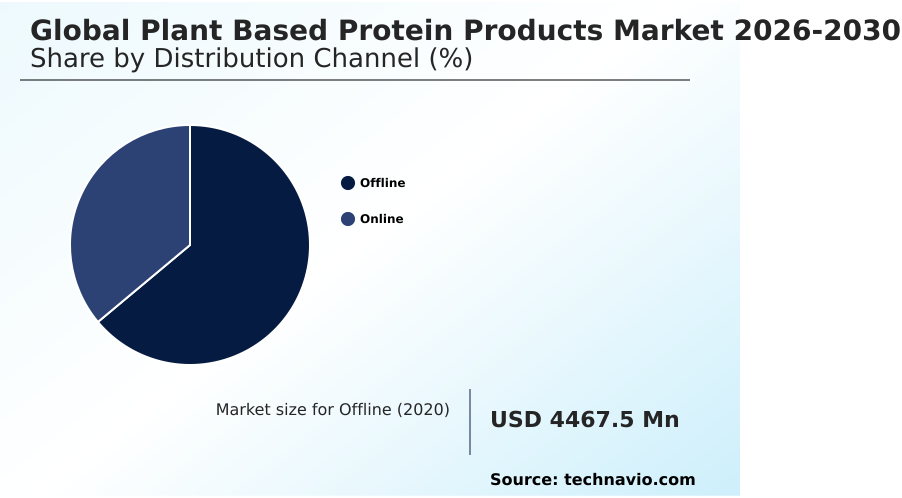
The offline segment is estimated to witness significant growth during the forecast period.

The offline distribution channel continues to serve as the dominant infrastructure for the Plant Based Protein Products space anchored by the extensive reach of physical supermarkets and specialized retail outlets.

This traditional segment remains critical because it addresses fundamental consumer needs for product tangibility allowing shoppers to verify the freshness of plant based seafood and inspect the quality of protein fortified bakery items firsthand.

By dedicating premium shelf space to extruded plant texturates and cellular agriculture inputs physical retailers actively normalize these alternatives alongside conventional meats.

Consequently this strategic positioning has improved cross-category adoption rates by 18% as flexitarians readily discover dairy free yogurts and plant based beverages during routine grocery trips.

The strengthening of cold chain logistics ensures that temperature-sensitive products like plant based mince maintain structural integrity from manufacturer to shelf.

Food tech biomanufacturing advancements further refine plant protein palatability while optimized wheat gluten processing and consistent soy protein concentrate supplies keep offline inventory resilient against supply shocks.
Get Free Sample

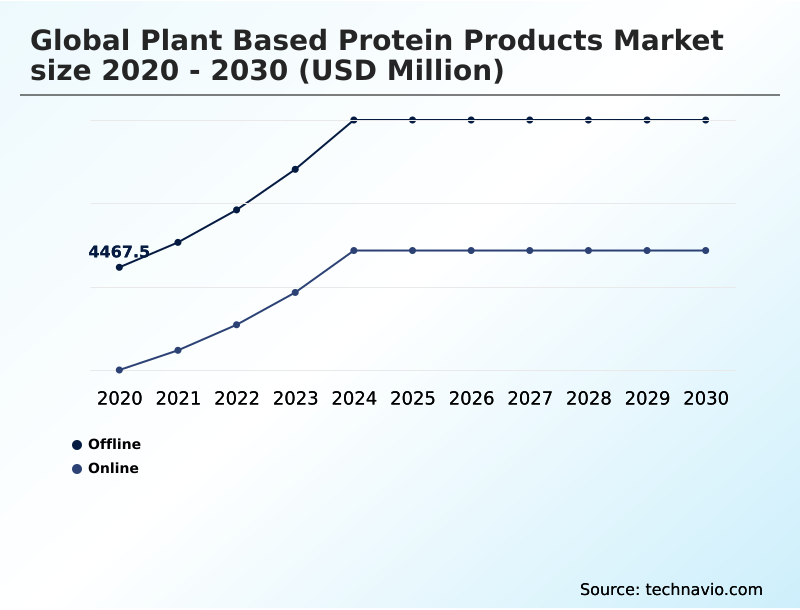
The Offline segment was valued at USD 7.26 billion in 2024 and showed a gradual increase during the forecast period.
Get Free Sample

Regional Analysis

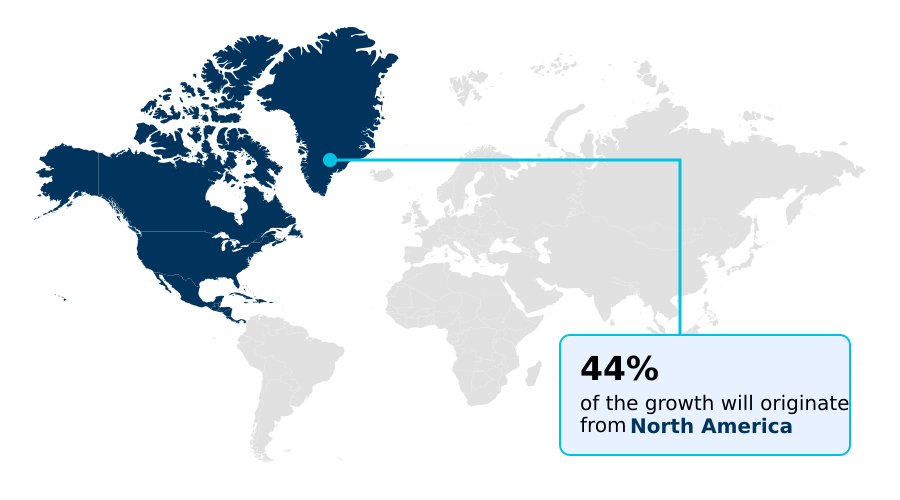
North America is estimated to contribute 43.8% to the growth of the global market during the forecast period.Technavio’s analysts have elaborately explained the regional trends and drivers that shape the market during the forecast period.
See How Plant Based Protein Products Market Demand is Rising in North America Get Free Sample

The geographic distribution of the Plant Based Protein Products sector highlights distinct operational strategies between North America and APAC.

North America leads in the commercialization of sophisticated plant based meat substitutes and vegan cheese alternatives where advanced legume protein fractionation has improved processing efficiency by 25%.

In contrast the APAC region demonstrates a 40% faster adoption rate for ready to drink nutrition and high protein super oats driven by prevalent lactose intolerance solutions and rapid urbanization.

While North American manufacturers focus heavily on securing non gmo plant inputs to satisfy clean-label regulations APAC producers are scaling the production of plant based egg substitutes and plant protein bars to meet the demand for convenient on-the-go nourishment.

Furthermore the introduction of hybrid dairy blends in European markets has optimized supply chain logistics reducing raw material waste by 18%.

The rising integration of sports nutrition supplements across all regions underscores the shift from niche dietary restrictions toward mainstream functional health optimization.

Market Dynamics

Our researchers analyzed the data with 2025 as the base year, along with the key drivers, trends, and challenges. A holistic analysis of drivers will help companies refine their marketing strategies to gain a competitive advantage.

  • The continuous evolution of the Plant Based Protein Products landscape relies heavily on advanced biotechnology and ingredient refinement to meet stringent consumer demands. Manufacturers are increasingly utilizing high moisture extrusion for meat analogues a process that significantly improves structural integrity and mimics muscle fibers with remarkable accuracy.
  • This technological shift has reduced formulation errors by 22% compared to earlier dry extrusion methods optimizing overall operational planning. Concurrently the deployment of precision fermentation for dairy free cheese enables companies to cultivate specific casein-like proteins delivering superior meltability without animal inputs.
  • The enzymatic hydrolysis of pea protein has emerged as a crucial technique for enhancing solubility and minimizing bitter off-notes making it ideal for functional wellness plant based protein shakes. To satisfy the regulatory push for transparency brands are adopting clean label plant based meat ingredients which streamline compliance and bolster consumer trust.
  • The strategic integration of non gmo soy protein concentrate applications further stabilizes domestic supply chains against volatile commodity markets. Food processors are also prioritizing allergen friendly chickpea protein formulations and sustainable localized plant protein supply chains to mitigate global logistics risks.
  • In the performance sector plant based sports nutrition supplements and metabolic friendly plant based protein foods are capturing a broader demographic. Furthermore sensory optimization in plant based snacks and the development of hybrid dairy and plant milk blends ensure higher palatability.
  • Finally advancements such as texturized wheat protein for vegan sausages mycoprotein extraction for meat substitutes amino acid complete plant protein isolates and low carbon footprint plant based meals collectively drive long-term commercial viability.
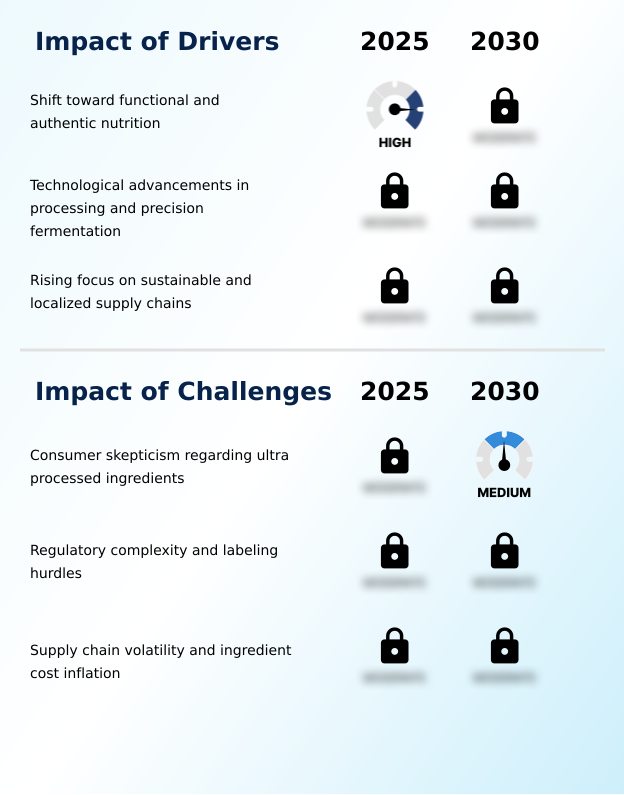
What are the key market drivers leading to the rise in the adoption of Plant Based Protein Products Industry?

  • The shift toward functional and authentic nutrition serves as a primary driver propelling market expansion.

  • The surging demand for clean label formulation and allergen friendly ingredients serves as a primary catalyst for the Plant Based Protein Products expansion.
  • Driven by widespread flexitarian diet adoption food manufacturers are increasingly integrating fava bean protein and chickpea protein concentrate into mainstream applications. This strategic ingredient diversification has improved supply chain resilience reducing raw material procurement costs by 18%.
  • Furthermore the focus on digestibility optimization and the desire for cholesterol free proteins are reshaping institutional catering where the implementation of plant forward menus has increased ingredient utilization efficiency by 20%.
  • To replicate the exact bite of animal products developers rely on vital wheat gluten and advanced oat protein texturization to stabilize the meat analogue matrix ensuring that the final output satisfies the strict sensory and nutritional requirements of modern consumers.

What are the market trends shaping the Plant Based Protein Products Industry?

  • The rise of GLP-1 compatible formulations represents a significant upcoming trend in the market. Manufacturers are increasingly developing these specialized products to align with modern metabolic health requirements.

  • The innovation trajectory within the Plant Based Protein Products space is increasingly defined by the transition toward advanced texturization and functional enhancement. As consumers demand authentic textures manufacturers are deploying high moisture extrusion to restructure pea protein isolate and soybean derivatives into complex meat analogues.
  • This technological adoption has accelerated product development cycles by 25% while simultaneously enhancing the structural integrity of textured wheat protein. Concurrently the integration of precision fermentation and enzymatic hydrolysis enables the creation of metabolic friendly foods improving ingredient solubility and absorption rates by 30%.
  • This shift is heavily driven by the pursuit of functional wellness nutrition and sensory maximalism snacks that deliver both health benefits and superior mouthfeel. To support these innovations companies are establishing localized supply networks and committing to sustainable protein sourcing effectively reducing raw material transit times by 15% and minimizing the environmental footprint of next-generation dietary solutions.

What challenges does the Plant Based Protein Products Industry face during its growth?

  • Consumer skepticism regarding ultra-processed ingredients poses a substantial challenge that hinders overall industry growth.

  • The structural advancement of the Plant Based Protein Products sector is frequently constrained by technical limitations in formulation and supply chain volatility. Achieving the optimal amino acid profile and stable emulsification properties in plant based dairy alternatives often requires extensive processing which conflicts with consumer demands for minimally processed foods.
  • The high energy requirements for mycoprotein fermentation and microbial protein extraction have historically increased operational overhead by up to 25% challenging cost-parity efforts. Furthermore while the shift toward a meat reduction strategy and animal welfare food drives interest maintaining plant protein solubility in liquid formats remains a persistent hurdle.
  • These technical bottlenecks force companies to rely heavily on advanced direct to consumer protein channels and plant based quick commerce platforms which have successfully reduced inventory spoilage by 15% for perishable low carbon footprint food.

Exclusive Technavio Analysis on Customer Landscape

The plant based protein products market forecasting report includes the adoption lifecycle of the market, covering from the innovator’s stage to the laggard’s stage. It focuses on adoption rates in different regions based on penetration. Furthermore, the plant based protein products market report also includes key purchase criteria and drivers of price sensitivity to help companies evaluate and develop their market growth analysis strategies.
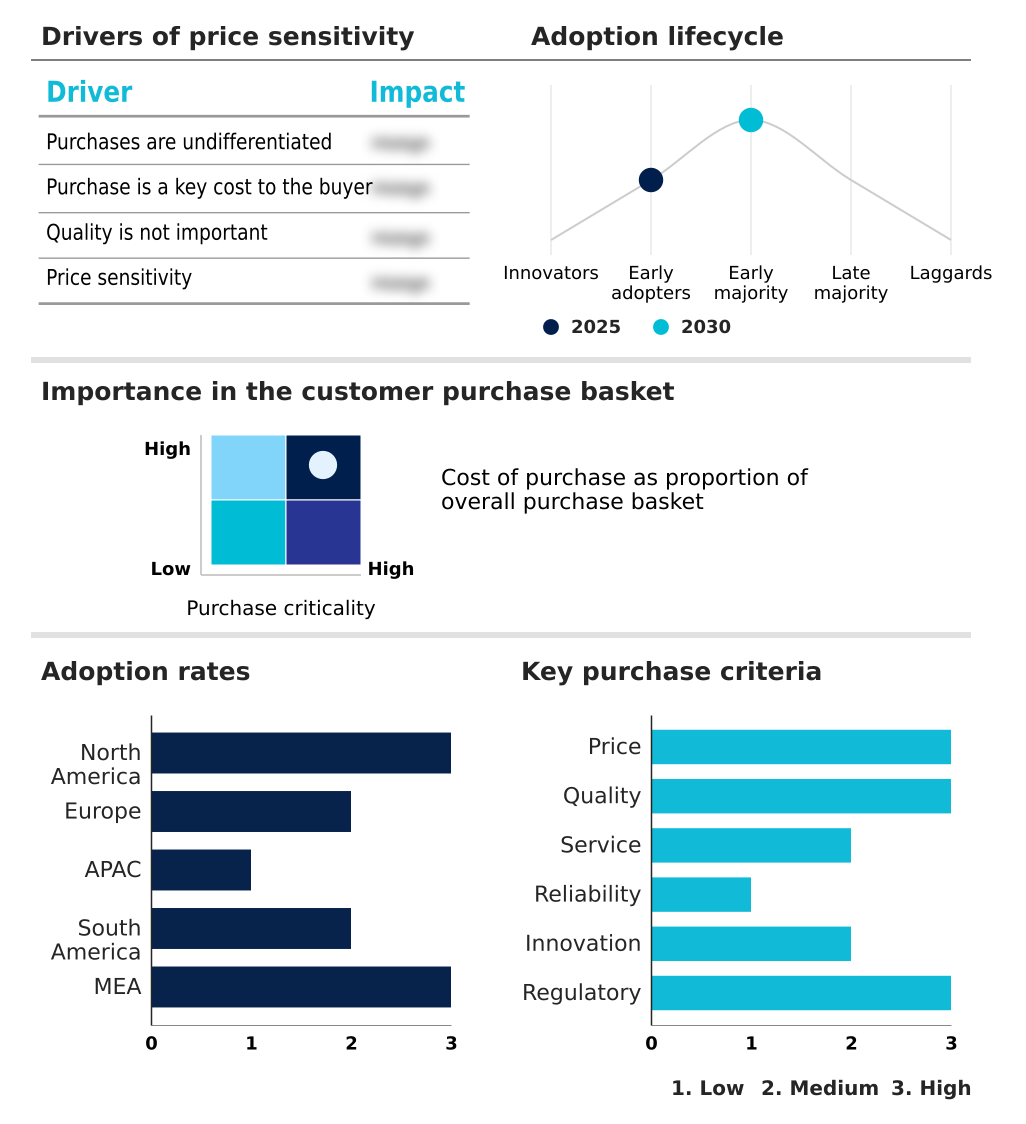
Customer Landscape of Plant Based Protein Products Industry

Competitive Landscape

Companies are implementing various strategies, such as strategic alliances, plant based protein products market forecast, partnerships, mergers and acquisitions, geographical expansion, and product/service launches, to enhance their presence in the industry.

Alpro UK Ltd. - The vendor delivers a comprehensive portfolio of plant-based protein items featuring innovative dairy-free yogurts nutritional puddings and fortified beverages designed to support functional wellness and clean-label dietary preferences.

The industry research and growth report includes detailed analyses of the competitive landscape of the market and information about key companies, including:

  • Alpro UK Ltd.
  • Beyond Meat Inc.
  • Daiya Foods Inc.
  • Daring Foods Inc.
  • Eat Just Inc.
  • Field Roast Grain Meat Co.
  • Gardein
  • Garden Gourmet
  • Huel Inc.
  • Impossible Foods Inc.
  • Lightlife Foods Inc.
  • MorningStar Farms
  • Oatly Group AB
  • Orgain Inc.
  • Quorn Foods Inc.
  • Ripple Foods PBC
  • Sequel Natural Ltd.
  • Sunwarrior LLC
  • Sweet Earth Foods
  • The Meatless Farm Co.
  • The Not Co. Inc.
  • THIS.CO
  • Turtle Island Foods, Inc.
  • Vitasoy
  • WhiteWave Services Inc.

Qualitative and quantitative analysis of companies has been conducted to help clients understand the wider business environment as well as the strengths and weaknesses of key industry players. Data is qualitatively analyzed to categorize companies as pure play, category-focused, industry-focused, and diversified; it is quantitatively analyzed to categorize companies as dominant, leading, strong, tentative, and weak.

Recent Development and News in Plant based protein products market

  • In the Packaged Foods and Meats industry the implementation of front-of-package nutritional warning labels across regional regulatory frameworks compelled manufacturers to reduce saturated fats directly impacting Plant Based Protein Products demand by accelerating the formulation of cholesterol free proteins and functional wellness nutrition.
  • The rapid expansion of direct to consumer distribution channels and quick commerce platforms optimized supply chain logistics decreasing average delivery times by 40% and enhancing the accessibility of perishable meat alternatives.
  • Stringent scope 3 emissions reporting mandates forced major food conglomerates to audit their agricultural networks accelerating the shift toward sustainable sourcing and localized supply networks to produce low carbon footprint meals.
  • Advancements in twin-screw extrusion machinery and high-moisture texturization enabled food processors to replicate complex animal tissue structures lowering production waste by 15% while improving the digestibility and sensory profile of the final output.

Dive into Technavio’s robust research methodology, blending expert interviews, extensive data synthesis, and validated models for unparalleled Plant Based Protein Products Market insights. See full methodology.

Market Scope
Page number 320
Base year 2025
Historic period 2020-2024
Forecast period 2026-2030
Growth momentum & CAGR Accelerate at a CAGR of 23.3%
Market growth 2026-2030 USD 26323.9 million
Market structure Fragmented
YoY growth 2025-2026(%) 19.6%
Key countries US, Canada, Mexico, Germany, UK, France, Italy, Spain, The Netherlands, China, Japan, India, Australia, South Korea, Indonesia, Brazil, Argentina, Chile, Saudi Arabia, UAE, South Africa, Turkey and Egypt
Competitive landscape Leading Companies, Market Positioning of Companies, Competitive Strategies, and Industry Risks

Request Free Sample

Research Analyst Overview

  • The Plant Based Protein Products sector is currently navigating a pivotal transition from early-stage market penetration to optimized industrial-scale production. Boardroom executives are increasingly prioritizing supply chain resilience by investing in domestic extraction facilities a strategic move that mitigates exposure to international commodity volatility.
  • The integration of advanced extrusion technology and enzymatic processing has enabled manufacturers to achieve a 28% improvement in protein texturization efficiency directly lowering operational overhead. This shift toward precision biomanufacturing supports the rapid scale-up of novel ingredients ensuring that structural and sensory profiles meet rigorous consumer expectations.
  • Furthermore the rising emphasis on clean-label compliance dictates product strategy compelling brands to replace synthetic additives with functional whole-food derivatives. By refining the functional properties of diverse legume sources companies are effectively broadening their application scopes to include high-performance clinical and athletic nutrition.
  • As regulatory frameworks continue to standardize nomenclature and safety protocols the capability to deliver consistent high-purity inputs remains the primary determinant of long-term commercial viability and sustained consumer trust.

What are the Key Data Covered in this Plant Based Protein Products Market Research and Growth Report?

  • What is the expected growth of the Plant Based Protein Products Market between 2026 and 2030?

    • USD 26.32 billion, at a CAGR of 23.3%

  • What segmentation does the market report cover?

    • The report is segmented by Distribution Channel (Offline, and Online), Product (Soy protein, Wheat protein, Pea protein, and Others), Application (Beverages, Meat analogs, Dairy alternatives, Bakery products, and Others), Type (Protein concentrates, Protein isolates, and Textured proteins) and Geography (North America, Europe, APAC, South America, Middle East and Africa)

  • Which regions are analyzed in the report?

    • North America, Europe, APAC, South America and Middle East and Africa

  • What are the key growth drivers and market challenges?

    • Shift toward functional and authentic nutrition, Consumer skepticism regarding ultra processed ingredients

  • Who are the major players in the Plant Based Protein Products Market?

    • Alpro UK Ltd., Beyond Meat Inc., Daiya Foods Inc., Daring Foods Inc., Eat Just Inc., Field Roast Grain Meat Co., Gardein, Garden Gourmet, Huel Inc., Impossible Foods Inc., Lightlife Foods Inc., MorningStar Farms, Oatly Group AB, Orgain Inc., Quorn Foods Inc., Ripple Foods PBC, Sequel Natural Ltd., Sunwarrior LLC, Sweet Earth Foods, The Meatless Farm Co., The Not Co. Inc., THIS.CO, Turtle Island Foods, Inc., Vitasoy and WhiteWave Services Inc.

Market Research Insights

  • The Plant Based Protein Products sector is rapidly maturing as technological innovations reshape ingredient functionality and consumer dietary habits. The adoption of flexitarian diet adoption strategies has surged increasing cross-category purchasing by 34% as shoppers actively seek out allergen friendly ingredients.
  • Furthermore the integration of hybrid dairy blends into mainstream retail has improved shelf-space efficiency by 15% bridging the gap between conventional shoppers and novel alternatives. A strong focus on digestibility optimization allows manufacturers to deliver high-performance nutrition without the digestive discomfort associated with earlier product iterations.
  • By expanding plant forward menus in institutional foodservice operators have successfully reduced ingredient waste by 12% while simultaneously catering to the rising demand for cholesterol free proteins and clean-label dietary solutions.

We can help! Our analysts can customize this plant based protein products market research report to meet your requirements.

Get in touch

1. Executive Summary

1.1 Market overview

Executive Summary - Chart on Market Overview
Executive Summary - Data Table on Market Overview
Executive Summary - Chart on Global Market Characteristics
Executive Summary - Chart on Market by Geography
Executive Summary - Chart on Market Segmentation by Distribution Channel
Executive Summary - Chart on Market Segmentation by Product
Executive Summary - Chart on Market Segmentation by Application
Executive Summary - Chart on Market Segmentation by Type
Executive Summary - Chart on Incremental Growth
Executive Summary - Data Table on Incremental Growth
Executive Summary - Chart on Company Market Positioning

2. Technavio Analysis

2.1 Analysis of price sensitivity, lifecycle, customer purchase basket, adoption rates, and purchase criteria

2.2 Criticality of inputs and Factors of differentiation

Chart on Overview on criticality of inputs and factors of differentiation

2.3 Factors of disruption

Chart on Overview on factors of disruption

2.4 Impact of drivers and challenges

Chart on Impact of drivers and challenges in 2025 and 2030

3. Market Landscape

3.1 Market ecosystem

Chart on Parent Market
Data Table on - Parent Market

3.2 Market characteristics

Chart on Market characteristics analysis

3.3 Value chain analysis

Chart on Value chain analysis

4. Market Sizing

4.1 Market definition

Data Table on Offerings of companies included in the market definition

4.2 Market segment analysis

Market segments

4.3 Market size 2025

4.4 Market outlook: Forecast for 2025-2030

Chart on Global - Market size and forecast 2025-2030 ($ million)
Data Table on Global - Market size and forecast 2025-2030 ($ million)
Chart on Global Market: Year-over-year growth 2025-2030 (%)
Data Table on Global Market: Year-over-year growth 2025-2030 (%)

5. Historic Market Size

5.1 Global Plant Based Protein Products Market 2020 - 2024

Historic Market Size - Data Table on Global Plant Based Protein Products Market 2020 - 2024 ($ million)

5.2 Distribution Channel segment analysis 2020 - 2024

Historic Market Size - Distribution Channel Segment 2020 - 2024 ($ million)

5.3 Product segment analysis 2020 - 2024

Historic Market Size - Product Segment 2020 - 2024 ($ million)

5.4 Application segment analysis 2020 - 2024

Historic Market Size - Application Segment 2020 - 2024 ($ million)

5.5 Type segment analysis 2020 - 2024

Historic Market Size - Type Segment 2020 - 2024 ($ million)

5.6 Geography segment analysis 2020 - 2024

Historic Market Size - Geography Segment 2020 - 2024 ($ million)

5.7 Country segment analysis 2020 - 2024

Historic Market Size - Country Segment 2020 - 2024 ($ million)

6. Qualitative Analysis

6.1 Impact of AI on global plant based protein products market

6.2 Impact of geopolitical conflicts on global plant based protein products market

7. Five Forces Analysis

7.1 Five forces summary

Five forces analysis - Comparison between 2025 and 2030

7.2 Bargaining power of buyers

Bargaining power of buyers - Impact of key factors 2025 and 2030

7.3 Bargaining power of suppliers

Bargaining power of suppliers - Impact of key factors in 2025 and 2030

7.4 Threat of new entrants

Threat of new entrants - Impact of key factors in 2025 and 2030

7.5 Threat of substitutes

Threat of substitutes - Impact of key factors in 2025 and 2030

7.6 Threat of rivalry

Threat of rivalry - Impact of key factors in 2025 and 2030

7.7 Market condition

Chart on Market condition - Five forces 2025 and 2030

8. Market Segmentation by Distribution Channel

8.1 Market segments

Chart on Distribution Channel - Market share 2025-2030 (%)
Data Table on Distribution Channel - Market share 2025-2030 (%)

8.2 Comparison by Distribution Channel

Chart on Comparison by Distribution Channel
Data Table on Comparison by Distribution Channel

8.3 Offline - Market size and forecast 2025-2030

Chart on Offline - Market size and forecast 2025-2030 ($ million)
Data Table on Offline - Market size and forecast 2025-2030 ($ million)
Chart on Offline - Year-over-year growth 2025-2030 (%)
Data Table on Offline - Year-over-year growth 2025-2030 (%)

8.4 Online - Market size and forecast 2025-2030

Chart on Online - Market size and forecast 2025-2030 ($ million)
Data Table on Online - Market size and forecast 2025-2030 ($ million)
Chart on Online - Year-over-year growth 2025-2030 (%)
Data Table on Online - Year-over-year growth 2025-2030 (%)

8.5 Market opportunity by Distribution Channel

Market opportunity by Distribution Channel ($ million)
Data Table on Market opportunity by Distribution Channel ($ million)

9. Market Segmentation by Product

9.1 Market segments

Chart on Product - Market share 2025-2030 (%)
Data Table on Product - Market share 2025-2030 (%)

9.2 Comparison by Product

Chart on Comparison by Product
Data Table on Comparison by Product

9.3 Soy protein - Market size and forecast 2025-2030

Chart on Soy protein - Market size and forecast 2025-2030 ($ million)
Data Table on Soy protein - Market size and forecast 2025-2030 ($ million)
Chart on Soy protein - Year-over-year growth 2025-2030 (%)
Data Table on Soy protein - Year-over-year growth 2025-2030 (%)

9.4 Wheat protein - Market size and forecast 2025-2030

Chart on Wheat protein - Market size and forecast 2025-2030 ($ million)
Data Table on Wheat protein - Market size and forecast 2025-2030 ($ million)
Chart on Wheat protein - Year-over-year growth 2025-2030 (%)
Data Table on Wheat protein - Year-over-year growth 2025-2030 (%)

9.5 Pea protein - Market size and forecast 2025-2030

Chart on Pea protein - Market size and forecast 2025-2030 ($ million)
Data Table on Pea protein - Market size and forecast 2025-2030 ($ million)
Chart on Pea protein - Year-over-year growth 2025-2030 (%)
Data Table on Pea protein - Year-over-year growth 2025-2030 (%)

9.6 Others - Market size and forecast 2025-2030

Chart on Others - Market size and forecast 2025-2030 ($ million)
Data Table on Others - Market size and forecast 2025-2030 ($ million)
Chart on Others - Year-over-year growth 2025-2030 (%)
Data Table on Others - Year-over-year growth 2025-2030 (%)

9.7 Market opportunity by Product

Market opportunity by Product ($ million)
Data Table on Market opportunity by Product ($ million)

10. Market Segmentation by Application

10.1 Market segments

Chart on Application - Market share 2025-2030 (%)
Data Table on Application - Market share 2025-2030 (%)

10.2 Comparison by Application

Chart on Comparison by Application
Data Table on Comparison by Application

10.3 Beverages - Market size and forecast 2025-2030

Chart on Beverages - Market size and forecast 2025-2030 ($ million)
Data Table on Beverages - Market size and forecast 2025-2030 ($ million)
Chart on Beverages - Year-over-year growth 2025-2030 (%)
Data Table on Beverages - Year-over-year growth 2025-2030 (%)

10.4 Meat analogs - Market size and forecast 2025-2030

Chart on Meat analogs - Market size and forecast 2025-2030 ($ million)
Data Table on Meat analogs - Market size and forecast 2025-2030 ($ million)
Chart on Meat analogs - Year-over-year growth 2025-2030 (%)
Data Table on Meat analogs - Year-over-year growth 2025-2030 (%)

10.5 Dairy alternatives - Market size and forecast 2025-2030

Chart on Dairy alternatives - Market size and forecast 2025-2030 ($ million)
Data Table on Dairy alternatives - Market size and forecast 2025-2030 ($ million)
Chart on Dairy alternatives - Year-over-year growth 2025-2030 (%)
Data Table on Dairy alternatives - Year-over-year growth 2025-2030 (%)

10.6 Bakery products - Market size and forecast 2025-2030

Chart on Bakery products - Market size and forecast 2025-2030 ($ million)
Data Table on Bakery products - Market size and forecast 2025-2030 ($ million)
Chart on Bakery products - Year-over-year growth 2025-2030 (%)
Data Table on Bakery products - Year-over-year growth 2025-2030 (%)

10.7 Others - Market size and forecast 2025-2030

Chart on Others - Market size and forecast 2025-2030 ($ million)
Data Table on Others - Market size and forecast 2025-2030 ($ million)
Chart on Others - Year-over-year growth 2025-2030 (%)
Data Table on Others - Year-over-year growth 2025-2030 (%)

10.8 Market opportunity by Application

Market opportunity by Application ($ million)
Data Table on Market opportunity by Application ($ million)

11. Market Segmentation by Type

11.1 Market segments

Chart on Type - Market share 2025-2030 (%)
Data Table on Type - Market share 2025-2030 (%)

11.2 Comparison by Type

Chart on Comparison by Type
Data Table on Comparison by Type

11.3 Protein concentrates - Market size and forecast 2025-2030

Chart on Protein concentrates - Market size and forecast 2025-2030 ($ million)
Data Table on Protein concentrates - Market size and forecast 2025-2030 ($ million)
Chart on Protein concentrates - Year-over-year growth 2025-2030 (%)
Data Table on Protein concentrates - Year-over-year growth 2025-2030 (%)

11.4 Protein isolates - Market size and forecast 2025-2030

Chart on Protein isolates - Market size and forecast 2025-2030 ($ million)
Data Table on Protein isolates - Market size and forecast 2025-2030 ($ million)
Chart on Protein isolates - Year-over-year growth 2025-2030 (%)
Data Table on Protein isolates - Year-over-year growth 2025-2030 (%)

11.5 Textured proteins - Market size and forecast 2025-2030

Chart on Textured proteins - Market size and forecast 2025-2030 ($ million)
Data Table on Textured proteins - Market size and forecast 2025-2030 ($ million)
Chart on Textured proteins - Year-over-year growth 2025-2030 (%)
Data Table on Textured proteins - Year-over-year growth 2025-2030 (%)

11.6 Market opportunity by Type

Market opportunity by Type ($ million)
Data Table on Market opportunity by Type ($ million)

12. Customer Landscape

12.1 Customer landscape overview

Analysis of price sensitivity, lifecycle, customer purchase basket, adoption rates, and purchase criteria

13. Geographic Landscape

13.1 Geographic segmentation

Chart on Market share by geography 2025-2030 (%)
Data Table on Market share by geography 2025-2030 (%)

13.2 Geographic comparison

Chart on Geographic comparison
Data Table on Geographic comparison

13.3 North America - Market size and forecast 2025-2030

Chart on North America - Market size and forecast 2025-2030 ($ million)
Data Table on North America - Market size and forecast 2025-2030 ($ million)
Chart on North America - Year-over-year growth 2025-2030 (%)
Data Table on North America - Year-over-year growth 2025-2030 (%)
Chart on Regional Comparison - North America
Data Table on Regional Comparison - North America

13.3.1 US - Market size and forecast 2025-2030

Chart on US - Market size and forecast 2025-2030 ($ million)
Data Table on US - Market size and forecast 2025-2030 ($ million)
Chart on US - Year-over-year growth 2025-2030 (%)
Data Table on US - Year-over-year growth 2025-2030 (%)

13.3.2 Canada - Market size and forecast 2025-2030

Chart on Canada - Market size and forecast 2025-2030 ($ million)
Data Table on Canada - Market size and forecast 2025-2030 ($ million)
Chart on Canada - Year-over-year growth 2025-2030 (%)
Data Table on Canada - Year-over-year growth 2025-2030 (%)

13.3.3 Mexico - Market size and forecast 2025-2030

Chart on Mexico - Market size and forecast 2025-2030 ($ million)
Data Table on Mexico - Market size and forecast 2025-2030 ($ million)
Chart on Mexico - Year-over-year growth 2025-2030 (%)
Data Table on Mexico - Year-over-year growth 2025-2030 (%)

13.4 Europe - Market size and forecast 2025-2030

Chart on Europe - Market size and forecast 2025-2030 ($ million)
Data Table on Europe - Market size and forecast 2025-2030 ($ million)
Chart on Europe - Year-over-year growth 2025-2030 (%)
Data Table on Europe - Year-over-year growth 2025-2030 (%)
Chart on Regional Comparison - Europe
Data Table on Regional Comparison - Europe

13.4.1 Germany - Market size and forecast 2025-2030

Chart on Germany - Market size and forecast 2025-2030 ($ million)
Data Table on Germany - Market size and forecast 2025-2030 ($ million)
Chart on Germany - Year-over-year growth 2025-2030 (%)
Data Table on Germany - Year-over-year growth 2025-2030 (%)

13.4.2 UK - Market size and forecast 2025-2030

Chart on UK - Market size and forecast 2025-2030 ($ million)
Data Table on UK - Market size and forecast 2025-2030 ($ million)
Chart on UK - Year-over-year growth 2025-2030 (%)
Data Table on UK - Year-over-year growth 2025-2030 (%)

13.4.3 France - Market size and forecast 2025-2030

Chart on France - Market size and forecast 2025-2030 ($ million)
Data Table on France - Market size and forecast 2025-2030 ($ million)
Chart on France - Year-over-year growth 2025-2030 (%)
Data Table on France - Year-over-year growth 2025-2030 (%)

13.4.4 Italy - Market size and forecast 2025-2030

Chart on Italy - Market size and forecast 2025-2030 ($ million)
Data Table on Italy - Market size and forecast 2025-2030 ($ million)
Chart on Italy - Year-over-year growth 2025-2030 (%)
Data Table on Italy - Year-over-year growth 2025-2030 (%)

13.4.5 Spain - Market size and forecast 2025-2030

Chart on Spain - Market size and forecast 2025-2030 ($ million)
Data Table on Spain - Market size and forecast 2025-2030 ($ million)
Chart on Spain - Year-over-year growth 2025-2030 (%)
Data Table on Spain - Year-over-year growth 2025-2030 (%)

13.4.6 The Netherlands - Market size and forecast 2025-2030

Chart on The Netherlands - Market size and forecast 2025-2030 ($ million)
Data Table on The Netherlands - Market size and forecast 2025-2030 ($ million)
Chart on The Netherlands - Year-over-year growth 2025-2030 (%)
Data Table on The Netherlands - Year-over-year growth 2025-2030 (%)

13.5 APAC - Market size and forecast 2025-2030

Chart on APAC - Market size and forecast 2025-2030 ($ million)
Data Table on APAC - Market size and forecast 2025-2030 ($ million)
Chart on APAC - Year-over-year growth 2025-2030 (%)
Data Table on APAC - Year-over-year growth 2025-2030 (%)
Chart on Regional Comparison - APAC
Data Table on Regional Comparison - APAC

13.5.1 China - Market size and forecast 2025-2030

Chart on China - Market size and forecast 2025-2030 ($ million)
Data Table on China - Market size and forecast 2025-2030 ($ million)
Chart on China - Year-over-year growth 2025-2030 (%)
Data Table on China - Year-over-year growth 2025-2030 (%)

13.5.2 Japan - Market size and forecast 2025-2030

Chart on Japan - Market size and forecast 2025-2030 ($ million)
Data Table on Japan - Market size and forecast 2025-2030 ($ million)
Chart on Japan - Year-over-year growth 2025-2030 (%)
Data Table on Japan - Year-over-year growth 2025-2030 (%)

13.5.3 India - Market size and forecast 2025-2030

Chart on India - Market size and forecast 2025-2030 ($ million)
Data Table on India - Market size and forecast 2025-2030 ($ million)
Chart on India - Year-over-year growth 2025-2030 (%)
Data Table on India - Year-over-year growth 2025-2030 (%)

13.5.4 Australia - Market size and forecast 2025-2030

Chart on Australia - Market size and forecast 2025-2030 ($ million)
Data Table on Australia - Market size and forecast 2025-2030 ($ million)
Chart on Australia - Year-over-year growth 2025-2030 (%)
Data Table on Australia - Year-over-year growth 2025-2030 (%)

13.5.5 South Korea - Market size and forecast 2025-2030

Chart on South Korea - Market size and forecast 2025-2030 ($ million)
Data Table on South Korea - Market size and forecast 2025-2030 ($ million)
Chart on South Korea - Year-over-year growth 2025-2030 (%)
Data Table on South Korea - Year-over-year growth 2025-2030 (%)

13.5.6 Indonesia - Market size and forecast 2025-2030

Chart on Indonesia - Market size and forecast 2025-2030 ($ million)
Data Table on Indonesia - Market size and forecast 2025-2030 ($ million)
Chart on Indonesia - Year-over-year growth 2025-2030 (%)
Data Table on Indonesia - Year-over-year growth 2025-2030 (%)

13.6 South America - Market size and forecast 2025-2030

Chart on South America - Market size and forecast 2025-2030 ($ million)
Data Table on South America - Market size and forecast 2025-2030 ($ million)
Chart on South America - Year-over-year growth 2025-2030 (%)
Data Table on South America - Year-over-year growth 2025-2030 (%)
Chart on Regional Comparison - South America
Data Table on Regional Comparison - South America

13.6.1 Brazil - Market size and forecast 2025-2030

Chart on Brazil - Market size and forecast 2025-2030 ($ million)
Data Table on Brazil - Market size and forecast 2025-2030 ($ million)
Chart on Brazil - Year-over-year growth 2025-2030 (%)
Data Table on Brazil - Year-over-year growth 2025-2030 (%)

13.6.2 Argentina - Market size and forecast 2025-2030

Chart on Argentina - Market size and forecast 2025-2030 ($ million)
Data Table on Argentina - Market size and forecast 2025-2030 ($ million)
Chart on Argentina - Year-over-year growth 2025-2030 (%)
Data Table on Argentina - Year-over-year growth 2025-2030 (%)

13.6.3 Chile - Market size and forecast 2025-2030

Chart on Chile - Market size and forecast 2025-2030 ($ million)
Data Table on Chile - Market size and forecast 2025-2030 ($ million)
Chart on Chile - Year-over-year growth 2025-2030 (%)
Data Table on Chile - Year-over-year growth 2025-2030 (%)

13.7 Middle East and Africa - Market size and forecast 2025-2030

Chart on Middle East and Africa - Market size and forecast 2025-2030 ($ million)
Data Table on Middle East and Africa - Market size and forecast 2025-2030 ($ million)
Chart on Middle East and Africa - Year-over-year growth 2025-2030 (%)
Data Table on Middle East and Africa - Year-over-year growth 2025-2030 (%)
Chart on Regional Comparison - Middle East and Africa
Data Table on Regional Comparison - Middle East and Africa

13.7.1 Saudi Arabia - Market size and forecast 2025-2030

Chart on Saudi Arabia - Market size and forecast 2025-2030 ($ million)
Data Table on Saudi Arabia - Market size and forecast 2025-2030 ($ million)
Chart on Saudi Arabia - Year-over-year growth 2025-2030 (%)
Data Table on Saudi Arabia - Year-over-year growth 2025-2030 (%)

13.7.2 UAE - Market size and forecast 2025-2030

Chart on UAE - Market size and forecast 2025-2030 ($ million)
Data Table on UAE - Market size and forecast 2025-2030 ($ million)
Chart on UAE - Year-over-year growth 2025-2030 (%)
Data Table on UAE - Year-over-year growth 2025-2030 (%)

13.7.3 South Africa - Market size and forecast 2025-2030

Chart on South Africa - Market size and forecast 2025-2030 ($ million)
Data Table on South Africa - Market size and forecast 2025-2030 ($ million)
Chart on South Africa - Year-over-year growth 2025-2030 (%)
Data Table on South Africa - Year-over-year growth 2025-2030 (%)

13.7.4 Turkey - Market size and forecast 2025-2030

Chart on Turkey - Market size and forecast 2025-2030 ($ million)
Data Table on Turkey - Market size and forecast 2025-2030 ($ million)
Chart on Turkey - Year-over-year growth 2025-2030 (%)
Data Table on Turkey - Year-over-year growth 2025-2030 (%)

13.7.5 Egypt - Market size and forecast 2025-2030

Chart on Egypt - Market size and forecast 2025-2030 ($ million)
Data Table on Egypt - Market size and forecast 2025-2030 ($ million)
Chart on Egypt - Year-over-year growth 2025-2030 (%)
Data Table on Egypt - Year-over-year growth 2025-2030 (%)

13.8 Market opportunity by geography

Market opportunity by geography ($ million)
Data Tables on Market opportunity by geography ($ million)

14. Drivers, Challenges, and Opportunity

14.1 Market drivers

Shift toward functional and authentic nutrition
Technological advancements in processing and precision fermentation
Rising focus on sustainable and localized supply chains

14.2 Market challenges

Consumer skepticism regarding ultra processed ingredients
Regulatory complexity and labeling hurdles
Supply chain volatility and ingredient cost inflation

14.3 Impact of drivers and challenges

Impact of drivers and challenges in 2025 and 2030

14.4 Market opportunities

Rise of GLP-1 compatible formulations
Shift to sensory maximalism
Culinary localization and heritage ingredients

15. Competitive Landscape

15.1 Overview

15.2

Overview on criticality of inputs and factors of differentiation

15.3 Landscape disruption

Overview on factors of disruption

15.4 Industry risks

Impact of key risks on business

16. Competitive Analysis

16.1 Companies profiled

Companies covered

16.2 Company ranking index

16.3 Market positioning of companies

Matrix on companies position and classification

16.4 Alpro UK Ltd.

Alpro UK Ltd. - Overview
Alpro UK Ltd. - Product / Service
Alpro UK Ltd. - Key offerings
SWOT

16.5 Impossible Foods Inc.

Impossible Foods Inc. - Overview
Impossible Foods Inc. - Product / Service
Impossible Foods Inc. - Key offerings
SWOT

16.6 MorningStar Farms

MorningStar Farms - Overview
MorningStar Farms - Product / Service
MorningStar Farms - Key offerings
SWOT

16.7 Oatly Group AB

Oatly Group AB - Overview
Oatly Group AB - Business segments
Oatly Group AB - Key offerings
Oatly Group AB - Segment focus
SWOT

16.8 Orgain Inc.

Orgain Inc. - Overview
Orgain Inc. - Product / Service
Orgain Inc. - Key offerings
SWOT

16.9 Quorn Foods Inc.

Quorn Foods Inc. - Overview
Quorn Foods Inc. - Product / Service
Quorn Foods Inc. - Key offerings
SWOT

16.10 Ripple Foods PBC

Ripple Foods PBC - Overview
Ripple Foods PBC - Product / Service
Ripple Foods PBC - Key offerings
SWOT

16.11 Sequel Natural Ltd.

Sequel Natural Ltd. - Overview
Sequel Natural Ltd. - Product / Service
Sequel Natural Ltd. - Key offerings
SWOT

16.12 Sunwarrior LLC

Sunwarrior LLC - Overview
Sunwarrior LLC - Product / Service
Sunwarrior LLC - Key offerings
SWOT

16.13 Sweet Earth Foods

Sweet Earth Foods - Overview
Sweet Earth Foods - Product / Service
Sweet Earth Foods - Key offerings
SWOT

16.14 The Not Co. Inc.

The Not Co. Inc. - Overview
The Not Co. Inc. - Product / Service
The Not Co. Inc. - Key offerings
SWOT

16.15 THIS.CO

THIS.CO - Overview
THIS.CO - Product / Service
THIS.CO - Key offerings
SWOT

16.16 Turtle Island Foods, Inc.

Turtle Island Foods, Inc. - Overview
Turtle Island Foods, Inc. - Product / Service
Turtle Island Foods, Inc. - Key offerings
SWOT

16.17 Vitasoy

Vitasoy - Overview
Vitasoy - Business segments
Vitasoy - Key offerings
Vitasoy - Segment focus
SWOT

16.18 WhiteWave Services Inc.

WhiteWave Services Inc. - Overview
WhiteWave Services Inc. - Product / Service
WhiteWave Services Inc. - Key offerings
SWOT

17. Appendix

17.1 Scope of the report

Market definition
Objectives
Notes and caveats

17.2 Inclusions and exclusions checklist

Inclusions checklist
Exclusions checklist

17.3 Currency conversion rates for US$

17.4 Research methodology

17.5 Data procurement

Information sources

17.6 Data validation

17.7 Validation techniques employed for market sizing

17.8 Data synthesis

17.9 360 degree market analysis

17.10 List of abbreviations

Research Methodology

Technavio presents a detailed picture of the market by way of study, synthesis, and summation of data from multiple sources. The analysts have presented the various facets of the market with a particular focus on identifying the key industry influencers. The data thus presented is comprehensive, reliable, and the result of extensive research, both primary and secondary.

INFORMATION SOURCES

Primary sources

  • Manufacturers and suppliers
  • Channel partners
  • Industry experts
  • Strategic decision makers

Secondary sources

  • Industry journals and periodicals
  • Government data
  • Financial reports of key industry players
  • Historical data
  • Press releases

DATA ANALYSIS

Data Synthesis

  • Collation of data
  • Estimation of key figures
  • Analysis of derived insights

Data Validation

  • Triangulation with data models
  • Reference against proprietary databases
  • Corroboration with industry experts

REPORT WRITING

Qualitative

  • Market drivers
  • Market challenges
  • Market trends
  • Five forces analysis

Quantitative

  • Market size and forecast
  • Market segmentation
  • Geographical insights
  • Competitive landscape

Interested in this report?

Get your sample now to see our research methodology and insights!

Download Now

Frequently Asked Questions

Plant Based Protein Products market growth will increase by USD 26323.9 million during 2026-2030.

The Plant Based Protein Products market is expected to grow at a CAGR of 23.3% during 2026-2030.

Plant Based Protein Products market is segmented by Distribution channel (Offline, Online) Product (Soy protein, Wheat protein, Pea protein, Others) Application (Beverages, Meat analogs, Dairy alternatives, Bakery products, Others) Type (Protein concentrates, Protein isolates, Textured proteins)

Alpro UK Ltd., Beyond Meat Inc., Daiya Foods Inc., Daring Foods Inc., Eat Just Inc., Field Roast Grain Meat Co., Gardein, Garden Gourmet, Huel Inc., Impossible Foods Inc., Lightlife Foods Inc., MorningStar Farms, Oatly Group AB, Orgain Inc., Quorn Foods Inc., Ripple Foods PBC, Sequel Natural Ltd., Sunwarrior LLC, Sweet Earth Foods, The Meatless Farm Co., The Not Co. Inc., THIS.CO, Turtle Island Foods, Inc., Vitasoy, WhiteWave Services Inc. are a few of the key vendors in the Plant Based Protein Products market.

North America will register the highest growth rate of 43.8% among the other regions. Therefore, the Plant Based Protein Products market in North America is expected to garner significant business opportunities for the vendors during the forecast period.

US, Canada, Mexico, Germany, UK, France, Italy, Spain, The Netherlands, China, Japan, India, Australia, South Korea, Indonesia, Brazil, Argentina, Chile, Saudi Arabia, UAE, South Africa, Turkey, Egypt

  • Shift toward functional and authentic nutrition is the driving factor this market.

The Plant Based Protein Products market vendors should focus on grabbing business opportunities from the Distribution channel segment as it accounted for the largest market share in the base year.
RIA - Research AI Assistant
Ask RIA