Distributed Energy Generation Market Analysis APAC, Europe, North America, South America, Middle East and Africa - China, US, Germany, India, UK - Size and Forecast 2024-2028

Distributed Energy Generation Market Analysis APAC, Europe, North America, South America, Middle East and Africa - China, US, Germany, India, UK - Size and Forecast 2024-2028

Published: Jul 2024 178 Pages SKU: IRTNTR75540

Market Overview at a Glance

$252.1 B
Market Opportunity
13.63%
CAGR
11.71
YoY growth 2023-2024(%)

Distributed Energy Generation Market Size 2024-2028

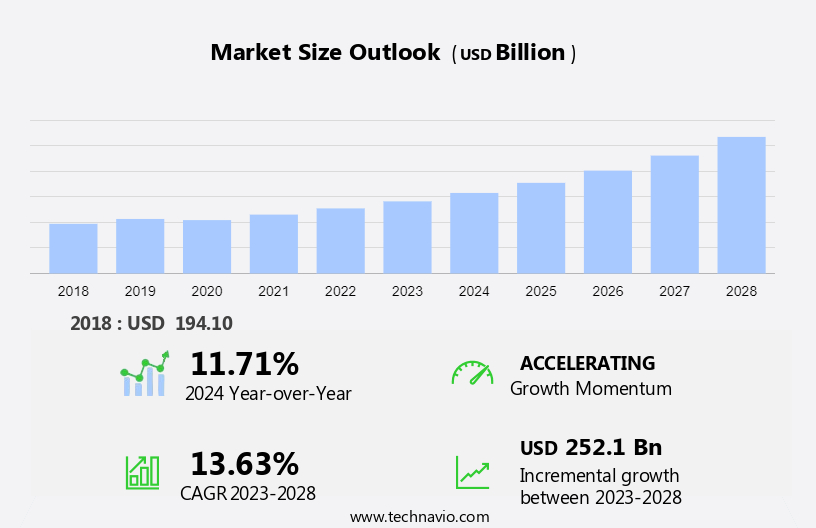
The distributed energy generation market size is forecast to increase by USD 252.1 billion at a CAGR of 13.63% between 2023 and 2028.

  • Distributed Energy Generation (DEG) is a significant segment of the global energy market, encompassing various technologies such as solar panels, wind turbines, fuel cells, and energy storage systems. Key drivers propelling the DEG market include the transition towards electric vehicles (EVs) and the increasing penetration of renewable energy sources, like solar PV and wind energy. However, challenges persist, including high equipment and installation costs, which necessitate the use of advanced semiconductor materials and digital technologies to optimize performance and reduce costs. Furthermore, the integration of DEG systems with microgrids, transformers, inverters, and batteries is crucial for ensuring grid stability and reliability. The adoption of natural gas and bioenergy as alternative fuels for electric generators is another emerging trend. Overall, the DEG market is poised for growth, driven by advancements in technology and the pressing need for sustainable and cost-effective energy solutions.

What will be the Size of the Distributed Energy Generation Market During the Forecast Period?

Distributed Energy Generation Market Size

 Request Free Sample

  • The market encompasses various technologies, including renewable energy sources such as wind, sun, and biomass, as well as reciprocating engines, turbines, and fuel cell technology. This market is driven by increasing electricity demand and the shift towards cleaner, more efficient energy sources. Renewable energy, particularly solar panel installation and wind turbines, is a significant contributor to this market's growth.
  • Moreover, microgrids and batteries play crucial roles in energy storage and grid expansion, ensuring energy availability and reliability. Environmental concerns continue to influence market dynamics, with a focus on energy efficiency standards and the adoption of green transformers and microgrid infrastructure. Technological advancements in solar panels, wind turbines, combustion engines, micro turbines, combustion turbines, and micro hydropower further propel market growth. Overall, the market is poised for continued expansion as the world seeks sustainable and efficient energy solutions.

How is this Distributed Energy Generation Industry segmented and which is the largest segment?

The distributed energy generation industry research report provides comprehensive data (region-wise segment analysis), with forecasts and estimates in "USD billion" for the period 2024-2028, as well as historical data from 2018-2022 for the following segments.
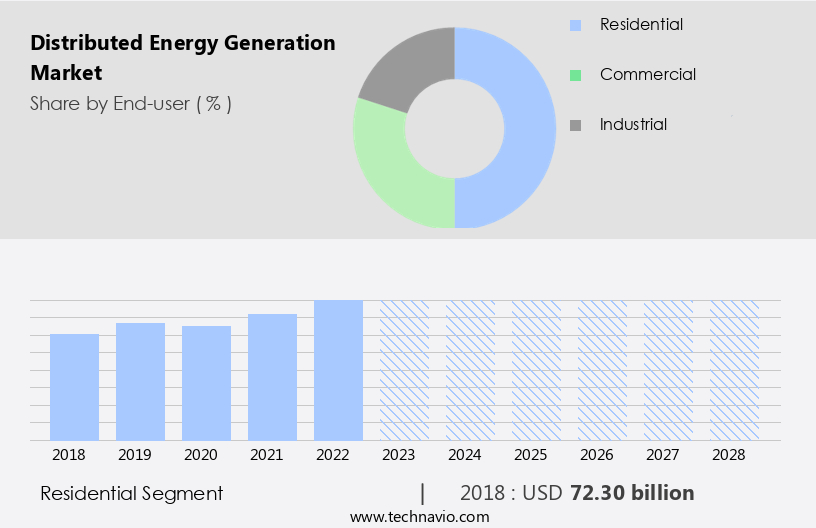
  • End-user
    • Residential
    • Commercial
    • Industrial
  • Technology
    • Solar PV
    • Hydro power
    • Fuel cells
    • Wind turbine
    • Others
  • Geography
    • APAC
      • China
      • India
    • Europe
      • Germany
      • UK
    • North America
      • US
    • South America
    • Middle East and Africa

By End-user Insights

  • The residential segment is estimated to witness significant growth during the forecast period.

Distributed energy generation in residential settings refers to the production of electricity or heat through small-scale energy systems installed in homes. This approach enables homeowners to generate their own power on-site, reducing dependence on traditional power grids and promoting the use of renewable energy sources such as wind, sun, and biomass. The increasing environmental consciousness and the desire for sustainable living have fueled the demand for distributed energy generation. Homeowners can benefit from reduced electricity bills, energy independence, lower carbon emissions, and improved resilience during power outages. Solar panel installation, microgrids, batteries, and fuel cell technology are key components of distributed energy generation systems.

Distributed Energy Generation Market Size

Get a glance at the Distributed Energy Generation Industry report of share of various segments Request Free Sample

The residential segment was valued at USD 72.30 billion in 2018 and showed a gradual increase during the forecast period.

Regional Analysis

  • APAC is estimated to contribute 34% to the growth of the global market during the forecast period.

Technavio's analysts have elaborately explained the regional trends and drivers that shape the market during the forecast period.

Distributed Energy Generation Market Share by Geography

For more insights on the market share of various regions, Request Free Sample

Distributed energy generation is a growing trend In the Asia-Pacific (APAC) region as countries prioritize energy security, reduce carbon emissions, and foster sustainable development. Renewable energy sources, particularly solar and wind, are increasingly preferred over traditional fossil fuel-based electricity generation due to their cleaner and more sustainable nature. This shift allows homeowners to decrease their carbon footprint and contribute to climate change mitigation. APAC governments have implemented supportive policies and regulations, such as China's feed-in tariffs and subsidies, to encourage distributed energy generation adoption. Microgrids, batteries, solar panel installations, and various technologies like wind turbines, reciprocating engines, turbines, biomass, fuel cells, and semiconductor materials are integral components of this transition.

Market Dynamics

Our researchers analyzed the data with 2023 as the base year, along with the key drivers, trends, and challenges. A holistic analysis of drivers will help companies refine their marketing strategies to gain a competitive advantage.

What are the key market drivers leading to the rise In the adoption of Distributed Energy Generation Industry?

Transition towards electric vehicles (EVs) is the key driver of the market.

  • Distributed energy generation, comprised of renewable energy sources such as wind, sun, reciprocating engines, turbines, biomass, and hydroelectric power, is increasingly essential for powering Electric Vehicle (EV) charging stations. Renewable energy solutions, including solar panel installation and wind turbines, coupled with battery storage, offer clean and sustainable energy for EV charging in residential, commercial, and public locations. The growing demand for electricity from EV charging can straIn the grid, particularly during peak hours. Integration of EV charging with distributed energy generation, coupled with smart charging and demand management systems, ensures optimal charging schedules, reduces peak demand, and maximizes the use of renewable energy resources.
  • Furthermore, microgrids, green transformers, fuel cell technology, and hybrid energy systems are additional components of distributed energy generation that can enhance grid efficiency and address environmental concerns. The falling costs of solar energy, wind turbines, and battery storage, coupled with urbanization and increasing environmental awareness, further fuel the adoption of distributed energy generation for EV charging infrastructure.

What are the market trends shaping the Distributed Energy Generation Industry?

Increasing renewable energy penetration is the upcoming market trend.

  • The market is experiencing significant growth due to the increasing adoption of renewable energy sources, including solar, wind, hydro, and biomass. Renewable energy installations are on the rise, driven by falling costs, supportive policies, and growing environmental awareness. Solar photovoltaic (PV) panels, wind turbines, energy storage systems, and smart grid technologies are advancing, becoming more efficient, cost-effective, and performance-driven. These advancements are expanding the market, enabling the integration of renewables into the energy mix and reducing reliance on fossil fuels. Microgrids, batteries, fuel cells, and semiconductor materials are also playing crucial roles In the transition to cleaner and more sustainable energy systems.
  • Furthermore, the trend towards distributed energy generation is expected to continue, as countries and regions strive to meet electricity demand while addressing environmental concerns and improving energy efficiency.

What challenges does the Distributed Energy Generation Industry face during its growth?

High equipment and installation costs is a key challenge affecting the industry growth.

  • Distributed energy generation, driven by electricity demand and the adoption of renewable energy sources, is a significant market trend. Renewable energy sources, such as wind, sun, and biomass, are increasingly being utilized for electricity generation due to environmental concerns and efficiency improvements. Distributed energy systems, including microgrids and batteries, enable the integration of these renewable sources into the electrical grid. Solar panel installation and wind turbine implementation involve substantial initial investments, primarily due to the cost of high-quality components, advanced technology, and skilled labor. The need for additional infrastructure, including power inverters, energy storage systems, and grid interconnection equipment, further increases the overall cost.
  • Furthermore, solar PV installations, despite reduced material costs, require a significant area for generating a large amount of electricity, contributing to increased investment rates. Distributed energy systems offer benefits such as energy efficiency, improved environmental performance, and reduced reliance on fossil fuels, making them a valuable investment for residential, commercial, and industrial applications. The falling costs of solar energy, wind turbines, batteries, fuel cells, and semiconductor materials are driving the growth of the market. Urbanization and the increasing demand for energy efficiency standards further support the market's expansion. Hybrid energy systems, such as microgrids and fuel cell technology, offer solutions for off-grid places and ensure a reliable energy supply.

Exclusive Customer Landscape

The distributed energy generation market forecasting report includes the adoption lifecycle of the market, covering from the innovator's stage to the laggard's stage. It focuses on adoption rates in different regions based on penetration. Furthermore, the distributed energy generation market report also includes key purchase criteria and drivers of price sensitivity to help companies evaluate and develop their market growth analysis strategies.

Distributed Energy Generation Market Share by Geography

 Customer Landscape

Key Companies & Market Insights

Companies are implementing various strategies, such as strategic alliances, distributed energy generation market forecast, partnerships, mergers and acquisitions, geographical expansion, and product/service launches, to enhance their presence In the industry.

The industry research and growth report includes detailed analyses of the competitive landscape of the market and information about key companies, including:

  • Ansaldo Energia Spa
  • Bloom Energy Corp.
  • Canadian Solar Inc.
  • Capstone Green Energy Corp.
  • Caterpillar Inc.
  • Cummins Inc.
  • Doosan Corp.
  • ENERCON GmbH
  • First Solar Inc.
  • FuelCell Energy Inc.
  • General Electric Co.
  • Mitsubishi Electric Corp.
  • Nextera Energy Inc.
  • Orsted AS
  • Rolls Royce Holdings Plc
  • Schneider Electric SE
  • Siemens AG
  • Sunverge Energy Inc.
  • Toyota Motor Corp.
  • Vestas Wind Systems AS

Qualitative and quantitative analysis of companies has been conducted to help clients understand the wider business environment as well as the strengths and weaknesses of key industry players. Data is qualitatively analyzed to categorize companies as pure play, category-focused, industry-focused, and diversified; it is quantitatively analyzed to categorize companies as dominant, leading, strong, tentative, and weak.

Research Analyst Overview

The market is experiencing significant growth as the global shift towards renewable energy sources continues. Renewable energy, derived from sources such as wind, sun, and biomass, is becoming increasingly competitive with traditional fossil fuel-based energy sources. This trend is driven by several factors, including environmental concerns, efficiency, and energy efficiency standards. Renewable energy sources, such as wind and solar, have seen falling costs and increasing efficiency, making them more economically viable for both residential and commercial applications. Wind energy, generated through turbines, and solar energy, captured through solar panels, are leading the charge in this transition. However, other renewable sources, such as hydropower, bioenergy, and fuel cells, are also gaining traction.

Moreover, batteries, including lithium-ion and lead-acid, play a crucial role In the market by providing energy storage solutions for renewable energy systems. Microgrids, which are localized electrical grids that can operate independently from the main grid, are also gaining popularity as they offer increased energy security and efficiency. Grid expansion is another area of focus In the market. Utilities are investing in upgrading their infrastructure to accommodate the integration of renewable energy sources and microgrids. Green transformers, which are designed to minimize energy loss and reduce emissions, are also being used to improve the efficiency of the grid. Fuel cell technology, which converts chemical energy into electricity through a chemical reaction, is another emerging technology In the market.

In addition, it offers high efficiency and low emissions, making it an attractive alternative to traditional combustion engines. Land use is an important consideration In the market, particularly in off-grid places where access to the main grid is limited. Solar panel installation and wind turbine deployment are common solutions for providing energy In these areas. The transition to renewable energy sources is not without challenges. Urbanization and the increasing demand for energy in densely populated areas present unique challenges for the market. Hybrid energy systems, which combine multiple renewable energy sources and energy storage solutions, are being explored as a potential solution to address these challenges.

Furthermore, environmental awareness and the desire to reduce air pollution are also driving the growth of the market. Renewable energy sources offer a cleaner alternative to fossil fuels, making them an attractive option for businesses and individuals looking to reduce their carbon footprint. Therefore, the market is experiencing significant growth as the world shifts towards renewable energy sources. Renewable energy sources, such as wind and solar, are becoming increasingly competitive with traditional fossil fuel-based energy sources due to falling costs and increasing efficiency. Batteries, microgrids, and grid expansion are key areas of focus In the market, and emerging technologies, such as fuel cell technology and hybrid energy systems, offer exciting possibilities for the future. The transition to renewable energy sources presents challenges, but the benefits, including environmental sustainability and energy security, make it a worthwhile endeavor.

Market Scope

Report Coverage

Details

Page number

178

Base year

2023

Historic period

2018-2022

Forecast period

2024-2028

Growth momentum & CAGR

Accelerate at a CAGR of 13.63%

Market growth 2024-2028

USD 252.1 billion

Market structure

Fragmented

YoY growth 2023-2024(%)

11.71

Key countries

China, US, Germany, India, and UK

Competitive landscape

Leading Companies, market growth and forecasting , Market Positioning of Companies, Competitive Strategies, and Industry Risks

Request Free Sample

What are the Key Data Covered in this Distributed Energy Generation Market Research and Growth Report?

  • CAGR of the Distributed Energy Generation industry during the forecast period
  • Detailed information on factors that will drive the growth and forecasting between 2024 and 2028
  • Precise estimation of the size of the market and its contribution of the industry in focus to the parent market
  • Accurate predictions about upcoming growth and trends and changes in consumer behaviour
  • Growth of the market across APAC, Europe, North America, South America, and Middle East and Africa
  • Thorough analysis of the market's competitive landscape and detailed information about companies
  • Comprehensive analysis of factors that will challenge the distributed energy generation market growth of industry companies

We can help! Our analysts can customize this distributed energy generation market research report to meet your requirements.

Get in touch

1 Executive Summary

  • 1.1 Market overview
    • Executive Summary - Chart on Market Overview
    • Executive Summary - Data Table on Market Overview
    • Executive Summary - Chart on Global Market Characteristics
    • Executive Summary - Chart on Market by Geography
    • Executive Summary - Chart on Market Segmentation by End-user
    • Executive Summary - Chart on Market Segmentation by Technology
    • Executive Summary - Chart on Incremental Growth
    • Executive Summary - Data Table on Incremental Growth
    • Executive Summary - Chart on Company Market Positioning

2 Market Landscape

  • 2.1 Market ecosystem
    • Parent Market
    • Data Table on - Parent Market
  • 2.2 Market characteristics
    • Market characteristics analysis
  • 2.3 Value chain analysis
    • Value Chain Analysis

3 Market Sizing

  • 3.1 Market definition
    • Offerings of companies included in the market definition
  • 3.2 Market segment analysis
    • Market segments
  • 3.3 Market size 2023
    • 3.4 Market outlook: Forecast for 2023-2028
      • Chart on Global - Market size and forecast 2023-2028 ($ billion)
      • Data Table on Global - Market size and forecast 2023-2028 ($ billion)
      • Chart on Global Market: Year-over-year growth 2023-2028 (%)
      • Data Table on Global Market: Year-over-year growth 2023-2028 (%)

    4 Historic Market Size

    • 4.1 Global Distributed Energy Generation Market 2018 - 2022
      • Historic Market Size - Data Table on Global Distributed Energy Generation Market 2018 - 2022 ($ billion)
    • 4.2 End-user segment analysis 2018 - 2022
      • Historic Market Size - End-user Segment 2018 - 2022 ($ billion)
    • 4.3 Technology segment analysis 2018 - 2022
      • Historic Market Size - Technology Segment 2018 - 2022 ($ billion)
    • 4.4 Geography segment analysis 2018 - 2022
      • Historic Market Size - Geography Segment 2018 - 2022 ($ billion)
    • 4.5 Country segment analysis 2018 - 2022
      • Historic Market Size - Country Segment 2018 - 2022 ($ billion)

    5 Five Forces Analysis

    • 5.1 Five forces summary
      • Five forces analysis - Comparison between 2023 and 2028
    • 5.2 Bargaining power of buyers
      • Bargaining power of buyers - Impact of key factors 2023 and 2028
    • 5.3 Bargaining power of suppliers
      • Bargaining power of suppliers - Impact of key factors in 2023 and 2028
    • 5.4 Threat of new entrants
      • Threat of new entrants - Impact of key factors in 2023 and 2028
    • 5.5 Threat of substitutes
      • Threat of substitutes - Impact of key factors in 2023 and 2028
    • 5.6 Threat of rivalry
      • Threat of rivalry - Impact of key factors in 2023 and 2028
    • 5.7 Market condition
      • Chart on Market condition - Five forces 2023 and 2028

    6 Market Segmentation by End-user

    • 6.1 Market segments
      • Chart on End-user - Market share 2023-2028 (%)
      • Data Table on End-user - Market share 2023-2028 (%)
    • 6.2 Comparison by End-user
      • Chart on Comparison by End-user
      • Data Table on Comparison by End-user
    • 6.3 Residential - Market size and forecast 2023-2028
      • Chart on Residential - Market size and forecast 2023-2028 ($ billion)
      • Data Table on Residential - Market size and forecast 2023-2028 ($ billion)
      • Chart on Residential - Year-over-year growth 2023-2028 (%)
      • Data Table on Residential - Year-over-year growth 2023-2028 (%)
    • 6.4 Commercial - Market size and forecast 2023-2028
      • Chart on Commercial - Market size and forecast 2023-2028 ($ billion)
      • Data Table on Commercial - Market size and forecast 2023-2028 ($ billion)
      • Chart on Commercial - Year-over-year growth 2023-2028 (%)
      • Data Table on Commercial - Year-over-year growth 2023-2028 (%)
    • 6.5 Industrial - Market size and forecast 2023-2028
      • Chart on Industrial - Market size and forecast 2023-2028 ($ billion)
      • Data Table on Industrial - Market size and forecast 2023-2028 ($ billion)
      • Chart on Industrial - Year-over-year growth 2023-2028 (%)
      • Data Table on Industrial - Year-over-year growth 2023-2028 (%)
    • 6.6 Market opportunity by End-user
      • Market opportunity by End-user ($ billion)
      • Data Table on Market opportunity by End-user ($ billion)

    7 Market Segmentation by Technology

    • 7.1 Market segments
      • Chart on Technology - Market share 2023-2028 (%)
      • Data Table on Technology - Market share 2023-2028 (%)
    • 7.2 Comparison by Technology
      • Chart on Comparison by Technology
      • Data Table on Comparison by Technology
    • 7.3 Solar PV - Market size and forecast 2023-2028
      • Chart on Solar PV - Market size and forecast 2023-2028 ($ billion)
      • Data Table on Solar PV - Market size and forecast 2023-2028 ($ billion)
      • Chart on Solar PV - Year-over-year growth 2023-2028 (%)
      • Data Table on Solar PV - Year-over-year growth 2023-2028 (%)
    • 7.4 Hydro power - Market size and forecast 2023-2028
      • Chart on Hydro power - Market size and forecast 2023-2028 ($ billion)
      • Data Table on Hydro power - Market size and forecast 2023-2028 ($ billion)
      • Chart on Hydro power - Year-over-year growth 2023-2028 (%)
      • Data Table on Hydro power - Year-over-year growth 2023-2028 (%)
    • 7.5 Fuel cells - Market size and forecast 2023-2028
      • Chart on Fuel cells - Market size and forecast 2023-2028 ($ billion)
      • Data Table on Fuel cells - Market size and forecast 2023-2028 ($ billion)
      • Chart on Fuel cells - Year-over-year growth 2023-2028 (%)
      • Data Table on Fuel cells - Year-over-year growth 2023-2028 (%)
    • 7.6 Wind turbine - Market size and forecast 2023-2028
      • Chart on Wind turbine - Market size and forecast 2023-2028 ($ billion)
      • Data Table on Wind turbine - Market size and forecast 2023-2028 ($ billion)
      • Chart on Wind turbine - Year-over-year growth 2023-2028 (%)
      • Data Table on Wind turbine - Year-over-year growth 2023-2028 (%)
    • 7.7 Others - Market size and forecast 2023-2028
      • Chart on Others - Market size and forecast 2023-2028 ($ billion)
      • Data Table on Others - Market size and forecast 2023-2028 ($ billion)
      • Chart on Others - Year-over-year growth 2023-2028 (%)
      • Data Table on Others - Year-over-year growth 2023-2028 (%)
    • 7.8 Market opportunity by Technology
      • Market opportunity by Technology ($ billion)
      • Data Table on Market opportunity by Technology ($ billion)

    8 Customer Landscape

    • 8.1 Customer landscape overview
      • Analysis of price sensitivity, lifecycle, customer purchase basket, adoption rates, and purchase criteria

    9 Geographic Landscape

    • 9.1 Geographic segmentation
      • Chart on Market share by geography 2023-2028 (%)
      • Data Table on Market share by geography 2023-2028 (%)
    • 9.2 Geographic comparison
      • Chart on Geographic comparison
      • Data Table on Geographic comparison
    • 9.3 APAC - Market size and forecast 2023-2028
      • Chart on APAC - Market size and forecast 2023-2028 ($ billion)
      • Data Table on APAC - Market size and forecast 2023-2028 ($ billion)
      • Chart on APAC - Year-over-year growth 2023-2028 (%)
      • Data Table on APAC - Year-over-year growth 2023-2028 (%)
    • 9.4 Europe - Market size and forecast 2023-2028
      • Chart on Europe - Market size and forecast 2023-2028 ($ billion)
      • Data Table on Europe - Market size and forecast 2023-2028 ($ billion)
      • Chart on Europe - Year-over-year growth 2023-2028 (%)
      • Data Table on Europe - Year-over-year growth 2023-2028 (%)
    • 9.5 North America - Market size and forecast 2023-2028
      • Chart on North America - Market size and forecast 2023-2028 ($ billion)
      • Data Table on North America - Market size and forecast 2023-2028 ($ billion)
      • Chart on North America - Year-over-year growth 2023-2028 (%)
      • Data Table on North America - Year-over-year growth 2023-2028 (%)
    • 9.6 South America - Market size and forecast 2023-2028
      • Chart on South America - Market size and forecast 2023-2028 ($ billion)
      • Data Table on South America - Market size and forecast 2023-2028 ($ billion)
      • Chart on South America - Year-over-year growth 2023-2028 (%)
      • Data Table on South America - Year-over-year growth 2023-2028 (%)
    • 9.7 Middle East and Africa - Market size and forecast 2023-2028
      • Chart on Middle East and Africa - Market size and forecast 2023-2028 ($ billion)
      • Data Table on Middle East and Africa - Market size and forecast 2023-2028 ($ billion)
      • Chart on Middle East and Africa - Year-over-year growth 2023-2028 (%)
      • Data Table on Middle East and Africa - Year-over-year growth 2023-2028 (%)
    • 9.8 China - Market size and forecast 2023-2028
      • Chart on China - Market size and forecast 2023-2028 ($ billion)
      • Data Table on China - Market size and forecast 2023-2028 ($ billion)
      • Chart on China - Year-over-year growth 2023-2028 (%)
      • Data Table on China - Year-over-year growth 2023-2028 (%)
    • 9.9 US - Market size and forecast 2023-2028
      • Chart on US - Market size and forecast 2023-2028 ($ billion)
      • Data Table on US - Market size and forecast 2023-2028 ($ billion)
      • Chart on US - Year-over-year growth 2023-2028 (%)
      • Data Table on US - Year-over-year growth 2023-2028 (%)
    • 9.10 Germany - Market size and forecast 2023-2028
      • Chart on Germany - Market size and forecast 2023-2028 ($ billion)
      • Data Table on Germany - Market size and forecast 2023-2028 ($ billion)
      • Chart on Germany - Year-over-year growth 2023-2028 (%)
      • Data Table on Germany - Year-over-year growth 2023-2028 (%)
    • 9.11 India - Market size and forecast 2023-2028
      • Chart on India - Market size and forecast 2023-2028 ($ billion)
      • Data Table on India - Market size and forecast 2023-2028 ($ billion)
      • Chart on India - Year-over-year growth 2023-2028 (%)
      • Data Table on India - Year-over-year growth 2023-2028 (%)
    • 9.12 UK - Market size and forecast 2023-2028
      • Chart on UK - Market size and forecast 2023-2028 ($ billion)
      • Data Table on UK - Market size and forecast 2023-2028 ($ billion)
      • Chart on UK - Year-over-year growth 2023-2028 (%)
      • Data Table on UK - Year-over-year growth 2023-2028 (%)
    • 9.13 Market opportunity by geography
      • Market opportunity by geography ($ billion)
      • Data Tables on Market opportunity by geography ($ billion)

    10 Drivers, Challenges, and Opportunity/Restraints

    • 10.1 Market drivers
      • 10.2 Market challenges
        • 10.3 Impact of drivers and challenges
          • Impact of drivers and challenges in 2023 and 2028
        • 10.4 Market opportunities/restraints

          11 Competitive Landscape

          • 11.1 Overview
            • 11.2 Competitive Landscape
              • Overview on criticality of inputs and factors of differentiation
            • 11.3 Landscape disruption
              • Overview on factors of disruption
            • 11.4 Industry risks
              • Impact of key risks on business

            12 Competitive Analysis

            • 12.1 Companies profiled
              • Companies covered
            • 12.2 Market positioning of companies
              • Matrix on companies position and classification
            • 12.3 Ansaldo Energia Spa
              • Ansaldo Energia Spa - Overview
              • Ansaldo Energia Spa - Product / Service
              • Ansaldo Energia Spa - Key offerings
            • 12.4 Capstone Green Energy Corp.
              • Capstone Green Energy Corp. - Overview
              • Capstone Green Energy Corp. - Business segments
              • Capstone Green Energy Corp. - Key news
              • Capstone Green Energy Corp. - Key offerings
              • Capstone Green Energy Corp. - Segment focus
            • 12.5 Caterpillar Inc.
              • Caterpillar Inc. - Overview
              • Caterpillar Inc. - Business segments
              • Caterpillar Inc. - Key news
              • Caterpillar Inc. - Key offerings
              • Caterpillar Inc. - Segment focus
            • 12.6 Doosan Corp.
              • Doosan Corp. - Overview
              • Doosan Corp. - Business segments
              • Doosan Corp. - Key news
              • Doosan Corp. - Key offerings
              • Doosan Corp. - Segment focus
            • 12.7 ENERCON GmbH
              • ENERCON GmbH - Overview
              • ENERCON GmbH - Product / Service
              • ENERCON GmbH - Key offerings
            • 12.8 First Solar Inc.
              • First Solar Inc. - Overview
              • First Solar Inc. - Business segments
              • First Solar Inc. - Key news
              • First Solar Inc. - Key offerings
              • First Solar Inc. - Segment focus
            • 12.9 General Electric Co.
              • General Electric Co. - Overview
              • General Electric Co. - Business segments
              • General Electric Co. - Key news
              • General Electric Co. - Key offerings
              • General Electric Co. - Segment focus
            • 12.10 Mitsubishi Electric Corp.
              • Mitsubishi Electric Corp. - Overview
              • Mitsubishi Electric Corp. - Business segments
              • Mitsubishi Electric Corp. - Key news
              • Mitsubishi Electric Corp. - Key offerings
              • Mitsubishi Electric Corp. - Segment focus
            • 12.11 Nextera Energy Inc.
              • Nextera Energy Inc. - Overview
              • Nextera Energy Inc. - Business segments
              • Nextera Energy Inc. - Key offerings
              • Nextera Energy Inc. - Segment focus
            • 12.12 Orsted AS
              • Orsted AS - Overview
              • Orsted AS - Product / Service
              • Orsted AS - Key offerings
            • 12.13 Rolls Royce Holdings Plc
              • Rolls Royce Holdings Plc - Overview
              • Rolls Royce Holdings Plc - Business segments
              • Rolls Royce Holdings Plc - Key news
              • Rolls Royce Holdings Plc - Key offerings
              • Rolls Royce Holdings Plc - Segment focus
            • 12.14 Schneider Electric SE
              • Schneider Electric SE - Overview
              • Schneider Electric SE - Business segments
              • Schneider Electric SE - Key news
              • Schneider Electric SE - Key offerings
              • Schneider Electric SE - Segment focus
            • 12.15 Siemens AG
              • Siemens AG - Overview
              • Siemens AG - Business segments
              • Siemens AG - Key news
              • Siemens AG - Key offerings
              • Siemens AG - Segment focus
            • 12.16 Toyota Motor Corp.
              • Toyota Motor Corp. - Overview
              • Toyota Motor Corp. - Business segments
              • Toyota Motor Corp. - Key news
              • Toyota Motor Corp. - Key offerings
              • Toyota Motor Corp. - Segment focus
            • 12.17 Vestas Wind Systems AS
              • Vestas Wind Systems AS - Overview
              • Vestas Wind Systems AS - Business segments
              • Vestas Wind Systems AS - Key offerings
              • Vestas Wind Systems AS - Segment focus

            13 Appendix

            • 13.1 Scope of the report
              • 13.2 Inclusions and exclusions checklist
                • Inclusions checklist
                • Exclusions checklist
              • 13.3 Currency conversion rates for US$
                • Currency conversion rates for US$
              • 13.4 Research methodology
                • Research methodology
              • 13.5 Data procurement
                • Information sources
              • 13.6 Data validation
                • Data validation
              • 13.7 Validation techniques employed for market sizing
                • Validation techniques employed for market sizing
              • 13.8 Data synthesis
                • Data synthesis
              • 13.9 360 degree market analysis
                • 360 degree market analysis
              • 13.10 List of abbreviations
                • List of abbreviations

              Research Methodology

              Technavio presents a detailed picture of the market by way of study, synthesis, and summation of data from multiple sources. The analysts have presented the various facets of the market with a particular focus on identifying the key industry influencers. The data thus presented is comprehensive, reliable, and the result of extensive research, both primary and secondary.

              INFORMATION SOURCES

              Primary sources

              • Manufacturers and suppliers
              • Channel partners
              • Industry experts
              • Strategic decision makers

              Secondary sources

              • Industry journals and periodicals
              • Government data
              • Financial reports of key industry players
              • Historical data
              • Press releases

              DATA ANALYSIS

              Data Synthesis

              • Collation of data
              • Estimation of key figures
              • Analysis of derived insights

              Data Validation

              • Triangulation with data models
              • Reference against proprietary databases
              • Corroboration with industry experts

              REPORT WRITING

              Qualitative

              • Market drivers
              • Market challenges
              • Market trends
              • Five forces analysis

              Quantitative

              • Market size and forecast
              • Market segmentation
              • Geographical insights
              • Competitive landscape

              Interested in this report?

              Get your sample now to see our research methodology and insights!

              Download Now

              Frequently Asked Questions

              Distributed Energy Generation market growth will increase by $ 252.1 bn during 2024-2028.

              The Distributed Energy Generation market is expected to grow at a CAGR of 13.63% during 2024-2028.

              Distributed Energy Generation market is segmented by End-user( Residential, Commercial, Industrial) Technology( Solar PV, Hydro power, Fuel cells, Wind turbine, Others)

              Ansaldo Energia Spa, Bloom Energy Corp., Canadian Solar Inc., Capstone Green Energy Corp., Caterpillar Inc., Cummins Inc., Doosan Corp., ENERCON GmbH, First Solar Inc., FuelCell Energy Inc., General Electric Co., Mitsubishi Electric Corp., Nextera Energy Inc., Orsted AS, Rolls Royce Holdings Plc, Schneider Electric SE, Siemens AG, Sunverge Energy Inc., Toyota Motor Corp., Vestas Wind Systems AS are a few of the key vendors in the Distributed Energy Generation market.

              APAC will register the highest growth rate of 34% among the other regions. Therefore, the Distributed Energy Generation market in APAC is expected to garner significant business opportunities for the vendors during the forecast period.

              China, US, Germany, India, UK

              • Transition towards electric vehicles (EVs)The widespread adoption of EVs requires a robust charging infrastructure.Distributed energy generation can play a crucial role in powering EV charging stations is the driving factor this market.
              • especially at residential is the driving factor this market.
              • commercial is the driving factor this market.
              • and public locations. By installing solar PV systems or wind turbines coupled with energy storage is the driving factor this market.
              • distributed energy generation can provide clean and renewable energy for EV charging is the driving factor this market.
              • reducing reliance on the grid and supporting sustainable transportation. The increased demand for electricity from EV charging can strain the grid is the driving factor this market.
              • particularly during peak hoursdistributed energy generation is the driving factor this market.
              • combined with smart charging and demand management systems is the driving factor this market.
              • can help balance the load on the grid. By integrating EV charging with distributed energy generation is the driving factor this market.
              • it becomes possible to optimize charging schedules is the driving factor this market.
              • reduce peak demand is the driving factor this market.
              • and maximize the use of renewable energy resources. This integration contributes to grid stability and promotes efficient energy management. Thus is the driving factor this market.
              • increased preference for EVs across the globe is expected to boost the growth of the global distributed energy generation market during the forecast period. is the driving factor this market.

              The Distributed Energy Generation market vendors should focus on grabbing business opportunities from the Residential segment as it accounted for the largest market share in the base year.