Microgrid Market Analysis, Size, and Forecast 2026-2030: North America (US, Canada, and Mexico), APAC (China, India, and Japan), Europe (Germany, UK, and France), South America (Brazil and Argentina), Middle East and Africa (Saudi Arabia, UAE, and South Africa), and Rest of World (ROW)

Microgrid Market Analysis, Size, and Forecast 2026-2030:
North America (US, Canada, and Mexico), APAC (China, India, and Japan), Europe (Germany, UK, and France), South America (Brazil and Argentina), Middle East and Africa (Saudi Arabia, UAE, and South Africa), and Rest of World (ROW)

Published: Mar 2026 301 Pages SKU: IRTNTR43731

Market Overview at a Glance

$47.14 B
Market Opportunity
16.5%
CAGR 2025 - 2030
30.7%
North America Growth
$16.36 B
Remote segment 2024

Microgrid Market Size 2026-2030

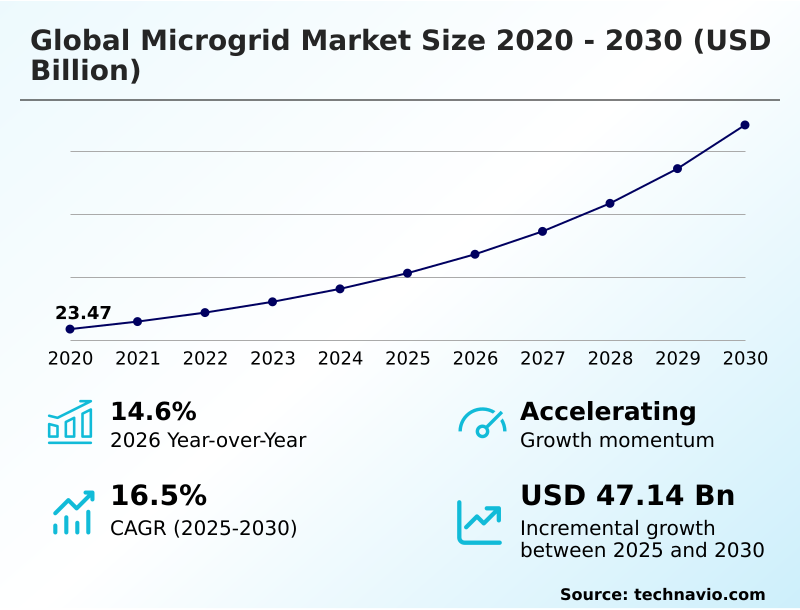
The microgrid market size is valued to increase by USD 47.14 billion, at a CAGR of 16.5% from 2025 to 2030. Increasing frequency of extreme weather events will drive the microgrid market.

Major Market Trends & Insights

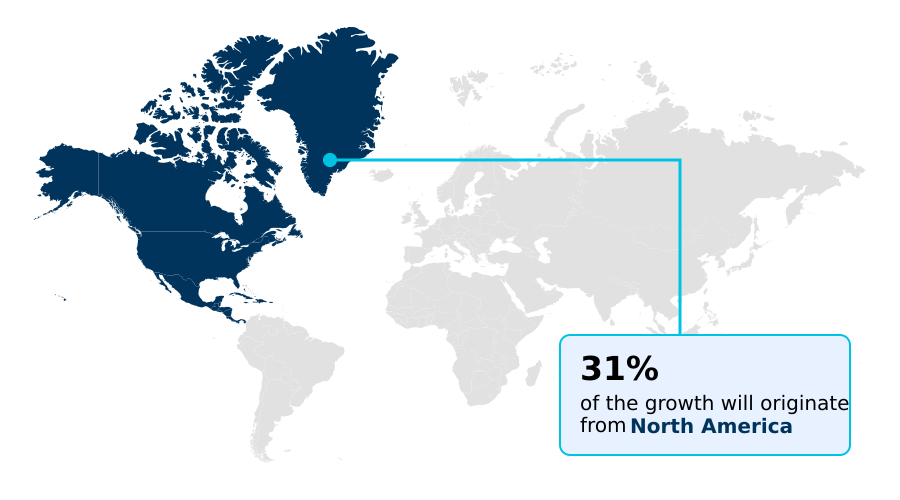
  • North America dominated the market and accounted for a 30.7% growth during the forecast period.
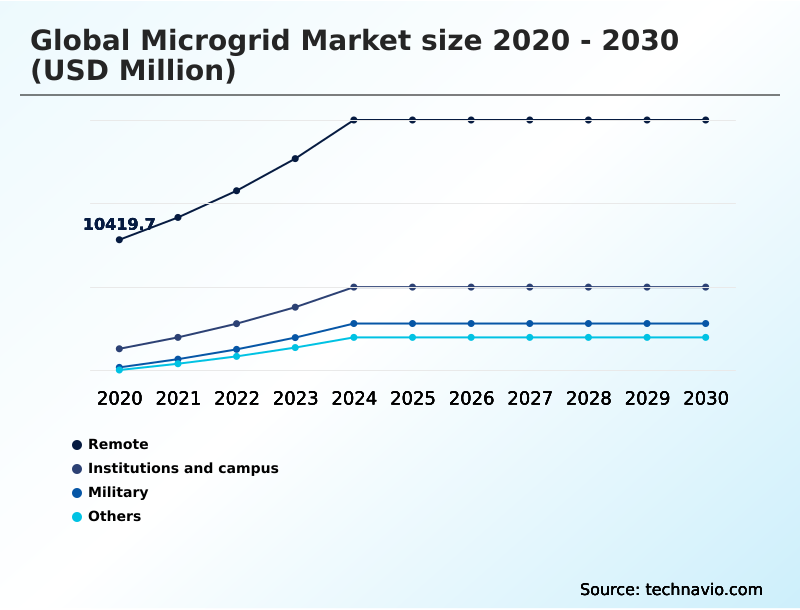
  • By Application - Remote segment was valued at USD 16.36 billion in 2024
  • By Connectivity - Grid connected segment accounted for the largest market revenue share in 2024

Market Size & Forecast

  • Market Opportunities: USD 64.94 billion
  • Market Future Opportunities: USD 47.14 billion
  • CAGR from 2025 to 2030 : 16.5%

Market Summary

  • The microgrid market is expanding as industries and communities seek greater energy independence and grid resilience. This evolution is driven by the need to integrate a higher mix of distributed energy resources and ensure power quality for sensitive operations.
  • The technology enables localized power networks to operate in a grid-connected mode or perform autonomous islanding during utility outages, a critical function for facilities where downtime is not an option. A key trend is the adoption of advanced energy management systems that optimize performance across various assets.
  • For instance, a manufacturing facility can deploy a microgrid controller to execute peak shaving strategies, charging battery storage systems when grid power is cheap and discharging during high-cost peak hours. This not only lowers operational expenses but also enhances decarbonization efforts by maximizing the use of onsite renewables.
  • While the technology offers significant benefits, challenges such as complex interconnection standards and the need for significant upfront investment remain. The development of turnkey energy systems and innovative energy as a service models is helping to lower these barriers, making decentralized energy more accessible.

What will be the Size of the Microgrid Market during the forecast period?

Get Key Insights on Market Forecast (PDF) Request Free Sample

How is the Microgrid Market Segmented?

The microgrid industry research report provides comprehensive data (region-wise segment analysis), with forecasts and estimates in "USD million" for the period 2026-2030, as well as historical data from 2020-2024 for the following segments.

  • Application
    • Remote
    • Institutions and campus
    • Military
    • Others
  • Connectivity
    • Grid connected
    • Off-grid connected
  • Type
    • AC microgrid
    • Hybrid
    • DC microgrid
  • Geography
    • North America
      • US
      • Canada
      • Mexico
    • APAC
      • China
      • India
      • Japan
    • Europe
      • Germany
      • UK
      • France
    • South America
      • Brazil
      • Argentina
    • Middle East and Africa
      • Saudi Arabia
      • UAE
      • South Africa
    • Rest of World (ROW)

By Application Insights

The remote segment is estimated to witness significant growth during the forecast period.

The remote segment addresses critical infrastructure needs for geographically isolated areas where extending traditional utility grids is technically or financially unfeasible. These off-grid systems provide energy independence by leveraging local resources like solar and wind, managed by a microgrid controller.

The adoption of localized power networks is driven by the high cost of transporting diesel fuel, with renewable microgrids offering a sustainable alternative that can lead to a 100% reduction in associated emissions.

Integration of energy storage systems ensures continuous power, supporting local economies and essential services.

This shift toward self-sufficient, resilient power network architectures is critical for mines, island communities, and remote industrial sites, enhancing operational efficiency and promoting sustainable development through advanced energy management systems.

Request Free Sample

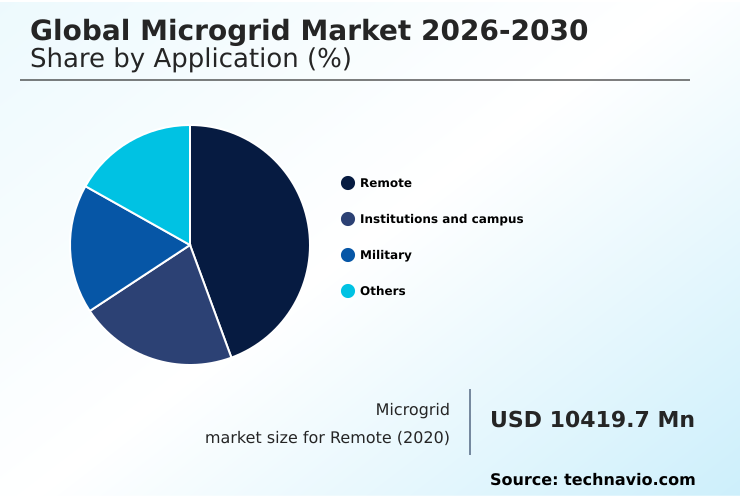
The Remote segment was valued at USD 16.36 billion in 2024 and showed a gradual increase during the forecast period.

Request Free Sample

Regional Analysis

North America is estimated to contribute 30.7% to the growth of the global market during the forecast period.Technavio’s analysts have elaborately explained the regional trends and drivers that shape the market during the forecast period.

See How Microgrid Market Demand is Rising in North America Request Free Sample

The geographic landscape of the market is diversifying, driven by distinct regional needs for energy independence and decarbonization.

In North America, the focus is on grid resilience, with the average power outage duration having doubled to nearly eight hours, making localized power networks essential for critical infrastructure.

In APAC, the emphasis is on rural off-grid electrification and supporting industrial growth, with large-scale battery projects being deployed to stabilize grids that have high renewable integration.

Europe's market is shaped by aggressive net-zero targets, promoting community microgrids and virtual power plants that leverage sophisticated energy management systems. Across regions, the use of distributed energy resources is central, with deployments of turnkey energy systems reducing project complexity.

A unified goal is achieving greater energy efficiency optimization, with facilities globally reporting significant operational gains from localized control.

Market Dynamics

Our researchers analyzed the data with 2025 as the base year, along with the key drivers, trends, and challenges. A holistic analysis of drivers will help companies refine their marketing strategies to gain a competitive advantage.

  • Strategic planning for microgrid adoption requires a comprehensive evaluation of both technical and financial variables. A key initial step involves understanding the payback period for a commercial microgrid, which is heavily influenced by the ability to implement strategies for reducing peak demand with battery storage.
  • The technical design, particularly the choice between AC vs DC microgrid efficiency, impacts overall performance and is critical for applications like ensuring microgrid for data center reliability.
  • For industrial users, integrating hydrogen storage for industrial microgrids offers a path for long-duration energy storage, while the development of a robust microgrid control system for renewables is essential for maximizing clean energy use. However, developers must navigate significant regulatory hurdles for microgrid interconnection, where the cost of microgrid interconnection studies can be a substantial barrier.
  • Cybersecurity is another paramount concern, necessitating secure microgrid cybersecurity communication protocols. For emergency applications, the mobile microgrid for disaster recovery provides crucial flexibility. As the market matures, new community microgrid business models and financing options for microgrid projects are emerging to make these systems more accessible.
  • Understanding the microgrid role in utility grid stabilization and the benefits of hybrid AC-DC microgrids is vital for long-term success, especially as supply chain risks for battery storage continue to influence project timelines and costs. In fact, facilities that have successfully navigated these complexities report reliability improvements more than double those of sites with only traditional backup systems.

What are the key market drivers leading to the rise in the adoption of Microgrid Industry?

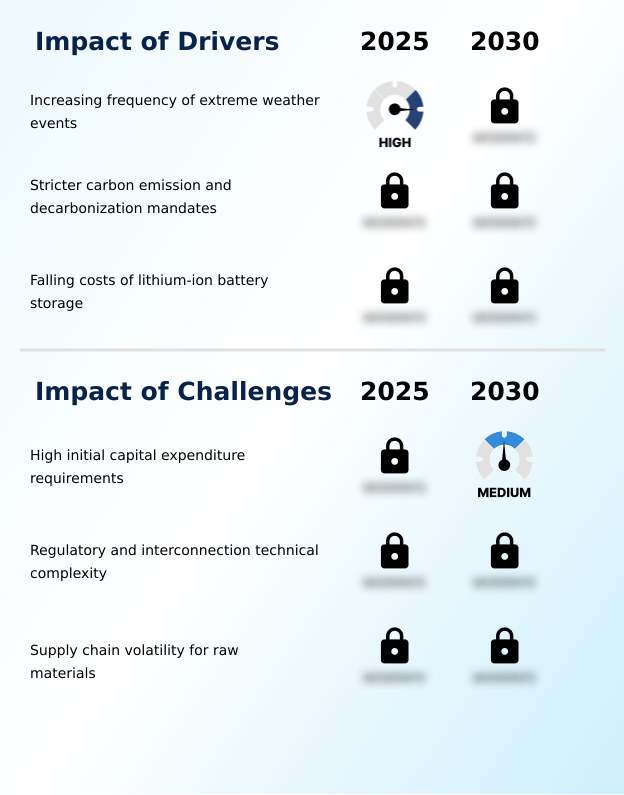
  • The increasing frequency and severity of extreme weather events is a key driver for the market, heightening the demand for resilient and reliable energy solutions.

  • Market growth is primarily driven by the urgent need for enhanced grid resilience and economic incentives tied to sustainability.
  • The increasing frequency of extreme weather has led to a 40% rise in weather-related power outages, making autonomous islanding a critical capability.
  • Simultaneously, stricter decarbonization mandates and carbon prices reaching $80 per metric ton are pushing organizations toward renewable integration and carbon footprint reduction, which can be cut by up to 60% with onsite distributed generation.
  • The most significant economic driver is the falling cost of lithium-ion battery packs, which have dropped by nearly 80%, making the payback period for technologies like peak shaving much shorter.
  • This affordability, combined with the availability of energy as a service models, is democratizing access to advanced energy storage systems.

What are the market trends shaping the Microgrid Industry?

  • The integration of hydrogen energy storage systems represents a significant upcoming market trend. This development addresses the need for long-duration storage to support intermittent renewable energy sources.

  • Key market trends are centered on enhancing system intelligence and storage capabilities. The integration of hydrogen energy storage systems is gaining traction for seasonal energy shifting, with electrolyzer and fuel cell processes offering long-duration power far exceeding the typical four-to-eight-hour discharge of lithium-ion batteries.
  • Another major trend is the shift toward autonomous edge computing control architecture, which enables peer-to-peer fashion communication between assets for millisecond-level responses to grid faults. This is critical for protecting sensitive equipment. Additionally, the deployment of hybrid mobile microgrid unit deployment is increasing for disaster recovery, featuring high-density lithium iron phosphate batteries and foldable solar arrays.
  • These containerized microgrid units, using advanced power conversion rates and inverter technology, reduce site-specific engineering costs by over 25%, accelerating access to power in critical situations.

What challenges does the Microgrid Industry face during its growth?

  • High initial capital expenditure requirements for hardware and system integration present a key challenge affecting the market's growth trajectory.

  • The market faces significant challenges related to high initial costs, regulatory complexity, and supply chain volatility. The capital expenditure for a microgrid can be prohibitive, with hardware and engineering representing nearly 70% of the total cost of ownership.
  • Regulatory and interconnection standards add another layer of complexity, as interconnection studies alone can cost upwards of $100,000 and project timelines can be delayed by months. Furthermore, the raw material supply chain for essential components like power electronics and semiconductors remains a major constraint.
  • Price volatility for materials such as lithium, which has fluctuated significantly, directly impacts the cost of battery storage. These factors make it difficult to provide stable long-term pricing, hindering investment in alternative battery chemistries and advanced decentralized energy solutions.

Exclusive Technavio Analysis on Customer Landscape

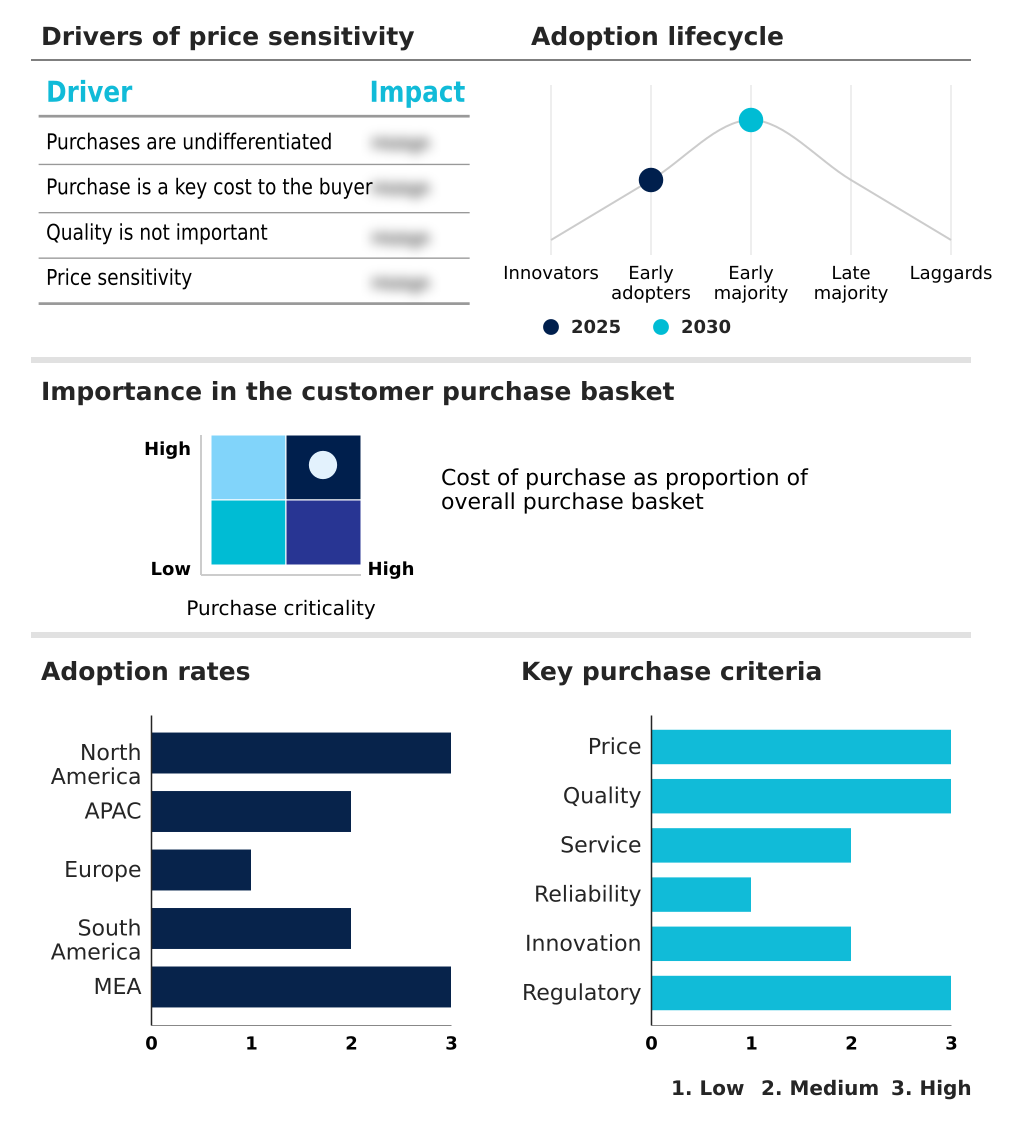
The microgrid market forecasting report includes the adoption lifecycle of the market, covering from the innovator’s stage to the laggard’s stage. It focuses on adoption rates in different regions based on penetration. Furthermore, the microgrid market report also includes key purchase criteria and drivers of price sensitivity to help companies evaluate and develop their market growth analysis strategies.

Customer Landscape of Microgrid Industry

Competitive Landscape

Companies are implementing various strategies, such as strategic alliances, microgrid market forecast, partnerships, mergers and acquisitions, geographical expansion, and product/service launches, to enhance their presence in the industry.

ABB Ltd. - Offerings include comprehensive control systems for distributed energy resources, enabling seamless grid integration, renewable power management, and enhanced operational efficiency through advanced digital services.

The industry research and growth report includes detailed analyses of the competitive landscape of the market and information about key companies, including:

  • ABB Ltd.
  • Canopy Power
  • Eaton Corp. Plc
  • Emerson Electric Co.
  • Exelon Corp.
  • GE Vernova Inc.
  • General MicroGrids
  • Honeywell International Inc.
  • Pareto Energy
  • Polaris Smart Metering Pte. Ltd
  • Power Analytics Global Corp.
  • Powerhive Inc.
  • S and C Electric Co.
  • Scale Microgrid Solutions LLC
  • Schneider Electric SE
  • Siemens AG
  • Spirae LLC
  • Tesla Inc.
  • Total Energy Solutions
  • UL LLC

Qualitative and quantitative analysis of companies has been conducted to help clients understand the wider business environment as well as the strengths and weaknesses of key industry players. Data is qualitatively analyzed to categorize companies as pure play, category-focused, industry-focused, and diversified; it is quantitatively analyzed to categorize companies as dominant, leading, strong, tentative, and weak.

Recent Development and News in Microgrid market

  • In August 2024, ABB Ltd. announced a new contract for an industrial microgrid utilizing high-capacity storage to reduce peak demand charges, which can account for up to 40% of a factory's electricity bill.
  • In January 2025, Siemens AG was involved in a large-scale project to create a carbon-neutral city district using a networked microgrid that facilitates renewable energy sharing between buildings to meet stringent local environmental regulations.
  • In March 2025, Tesla Inc. deployed a fleet of its mobile battery storage units to support a coastal region experiencing localized grid failures during a critical transition to new infrastructure.
  • In May 2025, Eaton Corp. collaborated with a regional utility to install a microgrid system specifically engineered to withstand high-wind events and ensure continuous power for a community shelter.

Dive into Technavio’s robust research methodology, blending expert interviews, extensive data synthesis, and validated models for unparalleled Microgrid Market insights. See full methodology.

Market Scope
Page number 301
Base year 2025
Historic period 2020-2024
Forecast period 2026-2030
Growth momentum & CAGR Accelerate at a CAGR of 16.5%
Market growth 2026-2030 USD 47143.5 million
Market structure Fragmented
YoY growth 2025-2026(%) 14.6%
Key countries US, Canada, Mexico, China, India, Japan, Australia, South Korea, Indonesia, Germany, UK, France, Italy, Spain, The Netherlands, Brazil, Chile, Argentina, Saudi Arabia, UAE, South Africa, Israel and Turkey
Competitive landscape Leading Companies, Market Positioning of Companies, Competitive Strategies, and Industry Risks

Request Free Sample

Research Analyst Overview

  • The microgrid market is fundamentally reshaping energy infrastructure by deploying localized power networks built on distributed energy resources. These systems are managed by a central microgrid controller, which enables critical functions like islanding and autonomous islanding to provide an uninterruptible power supply during grid failures. This capability is paramount for achieving grid resilience and ensuring power quality.
  • Boardroom decisions on capital expenditure for business continuity are increasingly influenced by the performance of these systems, as technologies like inverter technology and advanced power electronics mature. For example, implementing peak shaving strategies has been shown to reduce factory energy bills by up to 40%.
  • The integration of diverse assets, including lithium-ion battery packs, is optimized through demand response programs and sophisticated local grid management. This enhances decarbonization efforts and drives energy efficiency optimization. As the smart grid infrastructure evolves, these systems offer a scalable solution for renewable integration, critical for meeting sustainability goals and achieving long-term energy independence.

What are the Key Data Covered in this Microgrid Market Research and Growth Report?

  • What is the expected growth of the Microgrid Market between 2026 and 2030?

    • USD 47.14 billion, at a CAGR of 16.5%

  • What segmentation does the market report cover?

    • The report is segmented by Application (Remote, Institutions and campus, Military, and Others), Connectivity (Grid connected, and Off-grid connected), Type (AC microgrid, Hybrid, and DC microgrid) and Geography (North America, APAC, Europe, South America, Middle East and Africa)

  • Which regions are analyzed in the report?

    • North America, APAC, Europe, South America and Middle East and Africa

  • What are the key growth drivers and market challenges?

    • Increasing frequency of extreme weather events, High initial capital expenditure requirements

  • Who are the major players in the Microgrid Market?

    • ABB Ltd., Canopy Power, Eaton Corp. Plc, Emerson Electric Co., Exelon Corp., GE Vernova Inc., General MicroGrids, Honeywell International Inc., Pareto Energy, Polaris Smart Metering Pte. Ltd, Power Analytics Global Corp., Powerhive Inc., S and C Electric Co., Scale Microgrid Solutions LLC, Schneider Electric SE, Siemens AG, Spirae LLC, Tesla Inc., Total Energy Solutions and UL LLC

Market Research Insights

  • The market's dynamics are shaped by a definitive shift toward decentralized energy architectures that deliver enhanced grid resilience and operational efficiency. The adoption of energy as a service models is lowering entry barriers, while advanced energy management systems enable sophisticated asset optimization software.
  • This drive for smarter, localized power networks is underscored by performance metrics; for example, implementing peak shaving can reduce a factory's electricity bill by up to 40%. Concurrently, as the average duration of power outages has doubled in the last decade, the value of a resilient power network is more pronounced than ever.
  • By integrating distributed energy resources, industrial facilities can achieve a carbon footprint reduction of up to 60%, aligning with net-zero targets and demonstrating a clear return on investment beyond simple energy cost savings.

We can help! Our analysts can customize this microgrid market research report to meet your requirements.

Get in touch

1. Executive Summary

1.1 Market overview

Executive Summary - Chart on Market Overview
Executive Summary - Data Table on Market Overview
Executive Summary - Chart on Global Market Characteristics
Executive Summary - Chart on Market by Geography
Executive Summary - Chart on Market Segmentation by Application
Executive Summary - Chart on Market Segmentation by Connectivity
Executive Summary - Chart on Market Segmentation by Type
Executive Summary - Chart on Incremental Growth
Executive Summary - Data Table on Incremental Growth
Executive Summary - Chart on Company Market Positioning

2. Technavio Analysis

2.1 Analysis of price sensitivity, lifecycle, customer purchase basket, adoption rates, and purchase criteria

2.2 Criticality of inputs and Factors of differentiation

Chart on Overview on criticality of inputs and factors of differentiation

2.3 Factors of disruption

Chart on Overview on factors of disruption

2.4 Impact of drivers and challenges

Chart on Impact of drivers and challenges in 2025 and 2030

3. Market Landscape

3.1 Market ecosystem

Chart on Parent Market
Data Table on - Parent Market

3.2 Market characteristics

Chart on Market characteristics analysis

3.3 Value chain analysis

Chart on Value chain analysis

4. Market Sizing

4.1 Market definition

Data Table on Offerings of companies included in the market definition

4.2 Market segment analysis

Market segments

4.3 Market size 2025

4.4 Market outlook: Forecast for 2025-2030

Chart on Global - Market size and forecast 2025-2030 ($ million)
Data Table on Global - Market size and forecast 2025-2030 ($ million)
Chart on Global Market: Year-over-year growth 2025-2030 (%)
Data Table on Global Market: Year-over-year growth 2025-2030 (%)

5. Historic Market Size

5.1 Global Microgrid Market 2020 - 2024

Historic Market Size - Data Table on Global Microgrid Market 2020 - 2024 ($ million)

5.2 Application segment analysis 2020 - 2024

Historic Market Size - Application Segment 2020 - 2024 ($ million)

5.3 Connectivity segment analysis 2020 - 2024

Historic Market Size - Connectivity Segment 2020 - 2024 ($ million)

5.4 Type segment analysis 2020 - 2024

Historic Market Size - Type Segment 2020 - 2024 ($ million)

5.5 Geography segment analysis 2020 - 2024

Historic Market Size - Geography Segment 2020 - 2024 ($ million)

5.6 Country segment analysis 2020 - 2024

Historic Market Size - Country Segment 2020 - 2024 ($ million)

6. Qualitative Analysis

6.1 Impact of AI on Global Microgrid Market

7. Five Forces Analysis

7.1 Five forces summary

Five forces analysis - Comparison between 2025 and 2030

7.2 Bargaining power of buyers

Bargaining power of buyers - Impact of key factors 2025 and 2030

7.3 Bargaining power of suppliers

Bargaining power of suppliers - Impact of key factors in 2025 and 2030

7.4 Threat of new entrants

Threat of new entrants - Impact of key factors in 2025 and 2030

7.5 Threat of substitutes

Threat of substitutes - Impact of key factors in 2025 and 2030

7.6 Threat of rivalry

Threat of rivalry - Impact of key factors in 2025 and 2030

7.7 Market condition

Chart on Market condition - Five forces 2025 and 2030

8. Market Segmentation by Application

8.1 Market segments

Chart on Application - Market share 2025-2030 (%)
Data Table on Application - Market share 2025-2030 (%)

8.2 Comparison by Application

Chart on Comparison by Application
Data Table on Comparison by Application

8.3 Remote - Market size and forecast 2025-2030

Chart on Remote - Market size and forecast 2025-2030 ($ million)
Data Table on Remote - Market size and forecast 2025-2030 ($ million)
Chart on Remote - Year-over-year growth 2025-2030 (%)
Data Table on Remote - Year-over-year growth 2025-2030 (%)

8.4 Institutions and campus - Market size and forecast 2025-2030

Chart on Institutions and campus - Market size and forecast 2025-2030 ($ million)
Data Table on Institutions and campus - Market size and forecast 2025-2030 ($ million)
Chart on Institutions and campus - Year-over-year growth 2025-2030 (%)
Data Table on Institutions and campus - Year-over-year growth 2025-2030 (%)

8.5 Military - Market size and forecast 2025-2030

Chart on Military - Market size and forecast 2025-2030 ($ million)
Data Table on Military - Market size and forecast 2025-2030 ($ million)
Chart on Military - Year-over-year growth 2025-2030 (%)
Data Table on Military - Year-over-year growth 2025-2030 (%)

8.6 Others - Market size and forecast 2025-2030

Chart on Others - Market size and forecast 2025-2030 ($ million)
Data Table on Others - Market size and forecast 2025-2030 ($ million)
Chart on Others - Year-over-year growth 2025-2030 (%)
Data Table on Others - Year-over-year growth 2025-2030 (%)

8.7 Market opportunity by Application

Market opportunity by Application ($ million)
Data Table on Market opportunity by Application ($ million)

9. Market Segmentation by Connectivity

9.1 Market segments

Chart on Connectivity - Market share 2025-2030 (%)
Data Table on Connectivity - Market share 2025-2030 (%)

9.2 Comparison by Connectivity

Chart on Comparison by Connectivity
Data Table on Comparison by Connectivity

9.3 Grid connected - Market size and forecast 2025-2030

Chart on Grid connected - Market size and forecast 2025-2030 ($ million)
Data Table on Grid connected - Market size and forecast 2025-2030 ($ million)
Chart on Grid connected - Year-over-year growth 2025-2030 (%)
Data Table on Grid connected - Year-over-year growth 2025-2030 (%)

9.4 Off-grid connected - Market size and forecast 2025-2030

Chart on Off-grid connected - Market size and forecast 2025-2030 ($ million)
Data Table on Off-grid connected - Market size and forecast 2025-2030 ($ million)
Chart on Off-grid connected - Year-over-year growth 2025-2030 (%)
Data Table on Off-grid connected - Year-over-year growth 2025-2030 (%)

9.5 Market opportunity by Connectivity

Market opportunity by Connectivity ($ million)
Data Table on Market opportunity by Connectivity ($ million)

10. Market Segmentation by Type

10.1 Market segments

Chart on Type - Market share 2025-2030 (%)
Data Table on Type - Market share 2025-2030 (%)

10.2 Comparison by Type

Chart on Comparison by Type
Data Table on Comparison by Type

10.3 AC microgrid - Market size and forecast 2025-2030

Chart on AC microgrid - Market size and forecast 2025-2030 ($ million)
Data Table on AC microgrid - Market size and forecast 2025-2030 ($ million)
Chart on AC microgrid - Year-over-year growth 2025-2030 (%)
Data Table on AC microgrid - Year-over-year growth 2025-2030 (%)

10.4 Hybrid - Market size and forecast 2025-2030

Chart on Hybrid - Market size and forecast 2025-2030 ($ million)
Data Table on Hybrid - Market size and forecast 2025-2030 ($ million)
Chart on Hybrid - Year-over-year growth 2025-2030 (%)
Data Table on Hybrid - Year-over-year growth 2025-2030 (%)

10.5 DC microgrid - Market size and forecast 2025-2030

Chart on DC microgrid - Market size and forecast 2025-2030 ($ million)
Data Table on DC microgrid - Market size and forecast 2025-2030 ($ million)
Chart on DC microgrid - Year-over-year growth 2025-2030 (%)
Data Table on DC microgrid - Year-over-year growth 2025-2030 (%)

10.6 Market opportunity by Type

Market opportunity by Type ($ million)
Data Table on Market opportunity by Type ($ million)

11. Customer Landscape

11.1 Customer landscape overview

Analysis of price sensitivity, lifecycle, customer purchase basket, adoption rates, and purchase criteria

12. Geographic Landscape

12.1 Geographic segmentation

Chart on Market share by geography 2025-2030 (%)
Data Table on Market share by geography 2025-2030 (%)

12.2 Geographic comparison

Chart on Geographic comparison
Data Table on Geographic comparison

12.3 North America - Market size and forecast 2025-2030

Chart on North America - Market size and forecast 2025-2030 ($ million)
Data Table on North America - Market size and forecast 2025-2030 ($ million)
Chart on North America - Year-over-year growth 2025-2030 (%)
Data Table on North America - Year-over-year growth 2025-2030 (%)
Chart on Regional Comparison - North America
Data Table on Regional Comparison - North America

12.3.1 US - Market size and forecast 2025-2030

Chart on US - Market size and forecast 2025-2030 ($ million)
Data Table on US - Market size and forecast 2025-2030 ($ million)
Chart on US - Year-over-year growth 2025-2030 (%)
Data Table on US - Year-over-year growth 2025-2030 (%)

12.3.2 Canada - Market size and forecast 2025-2030

Chart on Canada - Market size and forecast 2025-2030 ($ million)
Data Table on Canada - Market size and forecast 2025-2030 ($ million)
Chart on Canada - Year-over-year growth 2025-2030 (%)
Data Table on Canada - Year-over-year growth 2025-2030 (%)

12.3.3 Mexico - Market size and forecast 2025-2030

Chart on Mexico - Market size and forecast 2025-2030 ($ million)
Data Table on Mexico - Market size and forecast 2025-2030 ($ million)
Chart on Mexico - Year-over-year growth 2025-2030 (%)
Data Table on Mexico - Year-over-year growth 2025-2030 (%)

12.4 APAC - Market size and forecast 2025-2030

Chart on APAC - Market size and forecast 2025-2030 ($ million)
Data Table on APAC - Market size and forecast 2025-2030 ($ million)
Chart on APAC - Year-over-year growth 2025-2030 (%)
Data Table on APAC - Year-over-year growth 2025-2030 (%)
Chart on Regional Comparison - APAC
Data Table on Regional Comparison - APAC

12.4.1 China - Market size and forecast 2025-2030

Chart on China - Market size and forecast 2025-2030 ($ million)
Data Table on China - Market size and forecast 2025-2030 ($ million)
Chart on China - Year-over-year growth 2025-2030 (%)
Data Table on China - Year-over-year growth 2025-2030 (%)

12.4.2 India - Market size and forecast 2025-2030

Chart on India - Market size and forecast 2025-2030 ($ million)
Data Table on India - Market size and forecast 2025-2030 ($ million)
Chart on India - Year-over-year growth 2025-2030 (%)
Data Table on India - Year-over-year growth 2025-2030 (%)

12.4.3 Japan - Market size and forecast 2025-2030

Chart on Japan - Market size and forecast 2025-2030 ($ million)
Data Table on Japan - Market size and forecast 2025-2030 ($ million)
Chart on Japan - Year-over-year growth 2025-2030 (%)
Data Table on Japan - Year-over-year growth 2025-2030 (%)

12.4.4 Australia - Market size and forecast 2025-2030

Chart on Australia - Market size and forecast 2025-2030 ($ million)
Data Table on Australia - Market size and forecast 2025-2030 ($ million)
Chart on Australia - Year-over-year growth 2025-2030 (%)
Data Table on Australia - Year-over-year growth 2025-2030 (%)

12.4.5 South Korea - Market size and forecast 2025-2030

Chart on South Korea - Market size and forecast 2025-2030 ($ million)
Data Table on South Korea - Market size and forecast 2025-2030 ($ million)
Chart on South Korea - Year-over-year growth 2025-2030 (%)
Data Table on South Korea - Year-over-year growth 2025-2030 (%)

12.4.6 Indonesia - Market size and forecast 2025-2030

Chart on Indonesia - Market size and forecast 2025-2030 ($ million)
Data Table on Indonesia - Market size and forecast 2025-2030 ($ million)
Chart on Indonesia - Year-over-year growth 2025-2030 (%)
Data Table on Indonesia - Year-over-year growth 2025-2030 (%)

12.5 Europe - Market size and forecast 2025-2030

Chart on Europe - Market size and forecast 2025-2030 ($ million)
Data Table on Europe - Market size and forecast 2025-2030 ($ million)
Chart on Europe - Year-over-year growth 2025-2030 (%)
Data Table on Europe - Year-over-year growth 2025-2030 (%)
Chart on Regional Comparison - Europe
Data Table on Regional Comparison - Europe

12.5.1 Germany - Market size and forecast 2025-2030

Chart on Germany - Market size and forecast 2025-2030 ($ million)
Data Table on Germany - Market size and forecast 2025-2030 ($ million)
Chart on Germany - Year-over-year growth 2025-2030 (%)
Data Table on Germany - Year-over-year growth 2025-2030 (%)

12.5.2 UK - Market size and forecast 2025-2030

Chart on UK - Market size and forecast 2025-2030 ($ million)
Data Table on UK - Market size and forecast 2025-2030 ($ million)
Chart on UK - Year-over-year growth 2025-2030 (%)
Data Table on UK - Year-over-year growth 2025-2030 (%)

12.5.3 France - Market size and forecast 2025-2030

Chart on France - Market size and forecast 2025-2030 ($ million)
Data Table on France - Market size and forecast 2025-2030 ($ million)
Chart on France - Year-over-year growth 2025-2030 (%)
Data Table on France - Year-over-year growth 2025-2030 (%)

12.5.4 Italy - Market size and forecast 2025-2030

Chart on Italy - Market size and forecast 2025-2030 ($ million)
Data Table on Italy - Market size and forecast 2025-2030 ($ million)
Chart on Italy - Year-over-year growth 2025-2030 (%)
Data Table on Italy - Year-over-year growth 2025-2030 (%)

12.5.5 Spain - Market size and forecast 2025-2030

Chart on Spain - Market size and forecast 2025-2030 ($ million)
Data Table on Spain - Market size and forecast 2025-2030 ($ million)
Chart on Spain - Year-over-year growth 2025-2030 (%)
Data Table on Spain - Year-over-year growth 2025-2030 (%)

12.5.6 The Netherlands - Market size and forecast 2025-2030

Chart on The Netherlands - Market size and forecast 2025-2030 ($ million)
Data Table on The Netherlands - Market size and forecast 2025-2030 ($ million)
Chart on The Netherlands - Year-over-year growth 2025-2030 (%)
Data Table on The Netherlands - Year-over-year growth 2025-2030 (%)

12.6 South America - Market size and forecast 2025-2030

Chart on South America - Market size and forecast 2025-2030 ($ million)
Data Table on South America - Market size and forecast 2025-2030 ($ million)
Chart on South America - Year-over-year growth 2025-2030 (%)
Data Table on South America - Year-over-year growth 2025-2030 (%)
Chart on Regional Comparison - South America
Data Table on Regional Comparison - South America

12.6.1 Brazil - Market size and forecast 2025-2030

Chart on Brazil - Market size and forecast 2025-2030 ($ million)
Data Table on Brazil - Market size and forecast 2025-2030 ($ million)
Chart on Brazil - Year-over-year growth 2025-2030 (%)
Data Table on Brazil - Year-over-year growth 2025-2030 (%)

12.6.2 Chile - Market size and forecast 2025-2030

Chart on Chile - Market size and forecast 2025-2030 ($ million)
Data Table on Chile - Market size and forecast 2025-2030 ($ million)
Chart on Chile - Year-over-year growth 2025-2030 (%)
Data Table on Chile - Year-over-year growth 2025-2030 (%)

12.6.3 Argentina - Market size and forecast 2025-2030

Chart on Argentina - Market size and forecast 2025-2030 ($ million)
Data Table on Argentina - Market size and forecast 2025-2030 ($ million)
Chart on Argentina - Year-over-year growth 2025-2030 (%)
Data Table on Argentina - Year-over-year growth 2025-2030 (%)

12.7 Middle East and Africa - Market size and forecast 2025-2030

Chart on Middle East and Africa - Market size and forecast 2025-2030 ($ million)
Data Table on Middle East and Africa - Market size and forecast 2025-2030 ($ million)
Chart on Middle East and Africa - Year-over-year growth 2025-2030 (%)
Data Table on Middle East and Africa - Year-over-year growth 2025-2030 (%)
Chart on Regional Comparison - Middle East and Africa
Data Table on Regional Comparison - Middle East and Africa

12.7.1 Saudi Arabia - Market size and forecast 2025-2030

Chart on Saudi Arabia - Market size and forecast 2025-2030 ($ million)
Data Table on Saudi Arabia - Market size and forecast 2025-2030 ($ million)
Chart on Saudi Arabia - Year-over-year growth 2025-2030 (%)
Data Table on Saudi Arabia - Year-over-year growth 2025-2030 (%)

12.7.2 UAE - Market size and forecast 2025-2030

Chart on UAE - Market size and forecast 2025-2030 ($ million)
Data Table on UAE - Market size and forecast 2025-2030 ($ million)
Chart on UAE - Year-over-year growth 2025-2030 (%)
Data Table on UAE - Year-over-year growth 2025-2030 (%)

12.7.3 South Africa - Market size and forecast 2025-2030

Chart on South Africa - Market size and forecast 2025-2030 ($ million)
Data Table on South Africa - Market size and forecast 2025-2030 ($ million)
Chart on South Africa - Year-over-year growth 2025-2030 (%)
Data Table on South Africa - Year-over-year growth 2025-2030 (%)

12.7.4 Israel - Market size and forecast 2025-2030

Chart on Israel - Market size and forecast 2025-2030 ($ million)
Data Table on Israel - Market size and forecast 2025-2030 ($ million)
Chart on Israel - Year-over-year growth 2025-2030 (%)
Data Table on Israel - Year-over-year growth 2025-2030 (%)

12.7.5 Turkey - Market size and forecast 2025-2030

Chart on Turkey - Market size and forecast 2025-2030 ($ million)
Data Table on Turkey - Market size and forecast 2025-2030 ($ million)
Chart on Turkey - Year-over-year growth 2025-2030 (%)
Data Table on Turkey - Year-over-year growth 2025-2030 (%)

12.8 Market opportunity by geography

Market opportunity by geography ($ million)
Data Tables on Market opportunity by geography ($ million)

13. Drivers, Challenges, and Opportunity

13.1 Market drivers

Increasing frequency of extreme weather events
Stricter carbon emission and decarbonization mandates
Falling costs of lithium-ion battery storage

13.2 Market challenges

High initial capital expenditure requirements
Regulatory and interconnection technical complexity
Supply chain volatility for raw materials

13.3 Impact of drivers and challenges

Impact of drivers and challenges in 2025 and 2030

13.4 Market opportunities

Hydrogen energy storage systems integration
Autonomous edge computing control architecture
Hybrid mobile microgrid unit deployment

14. Competitive Landscape

14.1 Overview

14.2

Overview on criticality of inputs and factors of differentiation

14.3 Landscape disruption

Overview on factors of disruption

14.4 Industry risks

Impact of key risks on business

15. Competitive Analysis

15.1 Companies profiled

Companies covered

15.2 Company ranking index

15.3 Market positioning of companies

Matrix on companies position and classification

15.4 ABB Ltd.

ABB Ltd. - Overview
ABB Ltd. - Business segments
ABB Ltd. - Key news
ABB Ltd. - Key offerings
ABB Ltd. - Segment focus
SWOT

15.5 Eaton Corp. Plc

Eaton Corp. Plc - Overview
Eaton Corp. Plc - Business segments
Eaton Corp. Plc - Key news
Eaton Corp. Plc - Key offerings
Eaton Corp. Plc - Segment focus
SWOT

15.6 Emerson Electric Co.

Emerson Electric Co. - Overview
Emerson Electric Co. - Business segments
Emerson Electric Co. - Key news
Emerson Electric Co. - Key offerings
Emerson Electric Co. - Segment focus
SWOT

15.7 Exelon Corp.

Exelon Corp. - Overview
Exelon Corp. - Business segments
Exelon Corp. - Key offerings
Exelon Corp. - Segment focus
SWOT

15.8 GE Vernova Inc.

GE Vernova Inc. - Overview
GE Vernova Inc. - Business segments
GE Vernova Inc. - Key offerings
GE Vernova Inc. - Segment focus
SWOT

15.9 General MicroGrids

General MicroGrids - Overview
General MicroGrids - Product / Service
General MicroGrids - Key offerings
SWOT

15.10 Honeywell International Inc.

Honeywell International Inc. - Overview
Honeywell International Inc. - Business segments
Honeywell International Inc. - Key news
Honeywell International Inc. - Key offerings
Honeywell International Inc. - Segment focus
SWOT

15.11 Powerhive Inc.

Powerhive Inc. - Overview
Powerhive Inc. - Product / Service
Powerhive Inc. - Key offerings
SWOT

15.12 S and C Electric Co.

S and C Electric Co. - Overview
S and C Electric Co. - Product / Service
S and C Electric Co. - Key offerings
SWOT

15.13 Schneider Electric SE

Schneider Electric SE - Overview
Schneider Electric SE - Business segments
Schneider Electric SE - Key news
Schneider Electric SE - Key offerings
Schneider Electric SE - Segment focus
SWOT

15.14 Siemens AG

Siemens AG - Overview
Siemens AG - Business segments
Siemens AG - Key news
Siemens AG - Key offerings
Siemens AG - Segment focus
SWOT

15.15 Spirae LLC

Spirae LLC - Overview
Spirae LLC - Product / Service
Spirae LLC - Key offerings
SWOT

15.16 Tesla Inc.

Tesla Inc. - Overview
Tesla Inc. - Business segments
Tesla Inc. - Key news
Tesla Inc. - Key offerings
Tesla Inc. - Segment focus
SWOT

15.17 Total Energy Solutions

Total Energy Solutions - Overview
Total Energy Solutions - Product / Service
Total Energy Solutions - Key offerings
SWOT

15.18 UL LLC

UL LLC - Overview
UL LLC - Product / Service
UL LLC - Key offerings
SWOT

16. Appendix

16.1 Scope of the report

Market definition
Objectives
Notes and caveats

16.2 Inclusions and exclusions checklist

Inclusions checklist
Exclusions checklist

16.3 Currency conversion rates for US$

16.4 Research methodology

16.5 Data procurement

Information sources

16.6 Data validation

16.7 Validation techniques employed for market sizing

16.8 Data synthesis

16.9 360 degree market analysis

16.10 List of abbreviations

Research Methodology

Technavio presents a detailed picture of the market by way of study, synthesis, and summation of data from multiple sources. The analysts have presented the various facets of the market with a particular focus on identifying the key industry influencers. The data thus presented is comprehensive, reliable, and the result of extensive research, both primary and secondary.

INFORMATION SOURCES

Primary sources

  • Manufacturers and suppliers
  • Channel partners
  • Industry experts
  • Strategic decision makers

Secondary sources

  • Industry journals and periodicals
  • Government data
  • Financial reports of key industry players
  • Historical data
  • Press releases

DATA ANALYSIS

Data Synthesis

  • Collation of data
  • Estimation of key figures
  • Analysis of derived insights

Data Validation

  • Triangulation with data models
  • Reference against proprietary databases
  • Corroboration with industry experts

REPORT WRITING

Qualitative

  • Market drivers
  • Market challenges
  • Market trends
  • Five forces analysis

Quantitative

  • Market size and forecast
  • Market segmentation
  • Geographical insights
  • Competitive landscape

Interested in this report?

Get your sample now to see our research methodology and insights!

Download Now

Frequently Asked Questions

Microgrid market growth will increase by USD 47143.5 million during 2026-2030.

The Microgrid market is expected to grow at a CAGR of 16.5% during 2026-2030.

Microgrid market is segmented by Application (Remote, Institutions and campus, Military, Others) Connectivity (Grid connected, Off-grid connected) Type (AC microgrid, Hybrid, DC microgrid)

ABB Ltd., Canopy Power, Eaton Corp. Plc, Emerson Electric Co., Exelon Corp., GE Vernova Inc., General MicroGrids, Honeywell International Inc., Pareto Energy, Polaris Smart Metering Pte. Ltd, Power Analytics Global Corp., Powerhive Inc., S and C Electric Co., Scale Microgrid Solutions LLC, Schneider Electric SE, Siemens AG, Spirae LLC, Tesla Inc., Total Energy Solutions, UL LLC are a few of the key vendors in the Microgrid market.

North America will register the highest growth rate of 30.7% among the other regions. Therefore, the Microgrid market in North America is expected to garner significant business opportunities for the vendors during the forecast period.

US, Canada, Mexico, China, India, Japan, Australia, South Korea, Indonesia, Germany, UK, France, Italy, Spain, The Netherlands, Brazil, Chile, Argentina, Saudi Arabia, UAE, South Africa, Israel, Turkey

  • Increasing frequency of extreme weather events is the driving factor this market.

The Microgrid market vendors should focus on grabbing business opportunities from the Application segment as it accounted for the largest market share in the base year.
RIA - Research AI Assistant
Ask RIA