Diversity And Inclusion Consulting Service Market Analysis North America, Europe, APAC, South America, Middle East and Africa - US, UK, Canada, Germany, Australia, France, India, China, Brazil, The Netherlands - Size and Forecast 2024-2028

Diversity And Inclusion Consulting Service Market Analysis North America, Europe, APAC, South America, Middle East and Africa - US, UK, Canada, Germany, Australia, France, India, China, Brazil, The Netherlands - Size and Forecast 2024-2028

Published: Nov 2024 202 Pages SKU: IRTNTR80381

Market Overview at a Glance

$2.89 B
Market Opportunity
12.7%
CAGR
12.5
YoY growth 2023-2024(%)

What is the Size of Diversity And Inclusion Consulting Service Market?

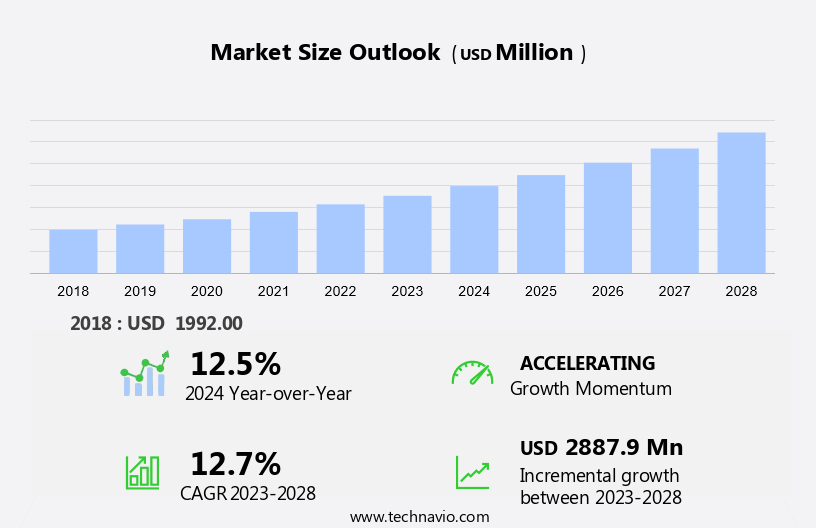
The Diversity And Inclusion Consulting Service Market size is forecast to increase by USD 2.89 billion, at a CAGR of 12.7% between 2023 and 2028.  The market is experiencing significant growth due to the increasing importance of fostering a sense of belonging and promoting social justice in the workplace. Companies are recognizing the value of diversity and inclusion as essential components of social responsibility and effective communication. Diversity strategy development, policy creation, and recruitment tools are becoming increasingly important for organizations seeking to hire and retain a diverse workforce. The integration of artificial intelligence (AI) into diversity and inclusion consulting services is also gaining traction, offering more efficient and effective solutions. However, the high cost associated with diversity and inclusion programs remains a challenge for some organizations. Remote work and gender equality are also key considerations in this market, as companies adapt to the changing work environment and strive for greater equality and inclusion. Effective diversity and inclusion initiatives can lead to increased loyalty among employees and a more productive workforce.

Diversity And Inclusion Consulting Service Market Size

Request Free Market Sample

Market Segmentation

The market research report provides comprehensive data (region-wise segment analysis), with forecasts and estimates in "USD billion" for the period 2024-2028, as well as historical data from 2018 - 2022 for the following segments.

  • Application
    • Large enterprises
    • Small and medium-sized enterprises
  • End-user
    • Private sector
    • Public sector
    • Others
  • Geography
    • North America
      • Canada
      • US
    • Europe
      • Germany
      • UK
      • France
    • APAC
      • China
      • India
    • South America
      • Brazil
    • Middle East and Africa

Which is the Largest Segment Driving Market Growth?

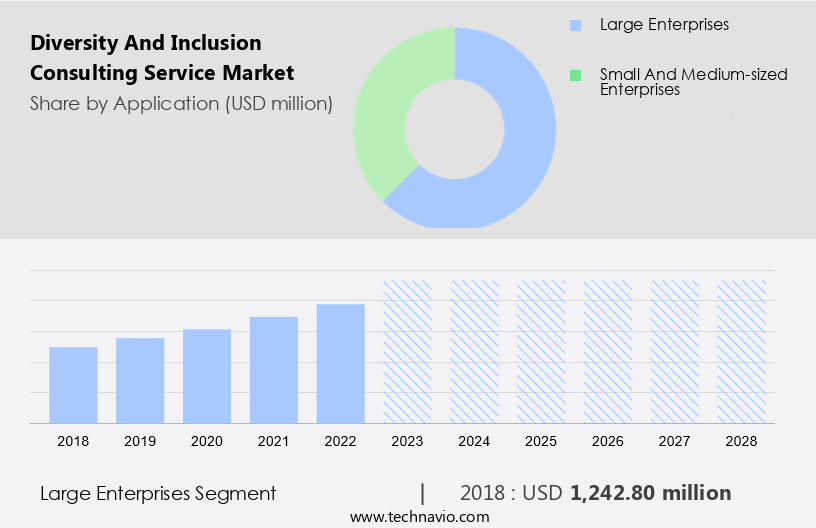
The large enterprises segment is estimated to witness significant growth during the forecast period.  Diversity and inclusion consulting services play a vital role in helping businesses establish and implement effective policies that promote equity and eliminate discrimination. In today's business landscape, regulatory pressures and customer expectations demand a commitment to diversity and inclusion (DEI). DEI consulting services assist organizations in addressing hiring practices, organizational culture, and training to ensure a workplace that values and respects all employees. By investing in DEI initiatives, companies can experience numerous benefits, including increased employee satisfaction, reduced turnover rates, and a more engaged workforce. A diverse workforce brings unique perspectives and ideas, fostering innovation and improving problem-solving capabilities.

Diversity And Inclusion Consulting Service Market Size

Get a glance at the market share of various regions Download the PDF Sample

The large enterprises segment was valued at USD 1.24 billion in 2018. Furthermore, a strong DEI program enhances a company's reputation, making it more appealing to top talent and customers who prioritize social responsibility. Effective DEI policies not only benefit the organization but also contribute to a healthier, more inclusive society. As DEI consulting services continue to gain importance, businesses that prioritize these initiatives will be better positioned to compete in the market and maintain a positive brand image.

Which Region is Leading the Market?

Diversity And Inclusion Consulting Service Market Share by Geography

For more insights on the market share of various regions Request Free Sample

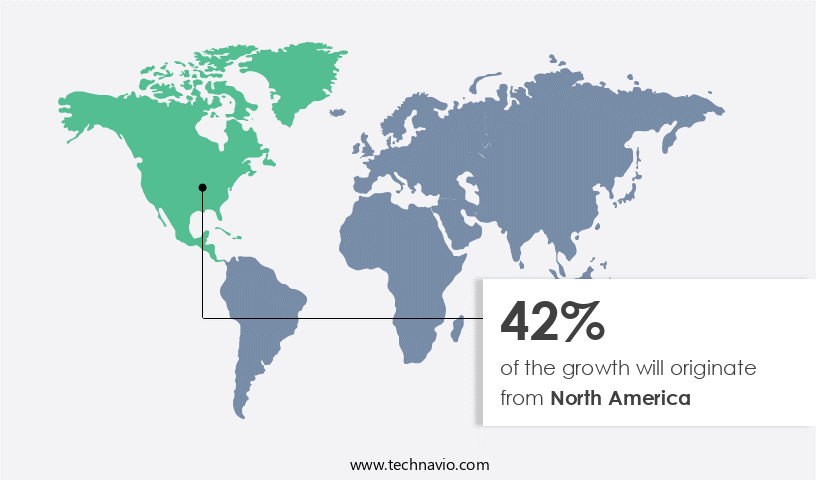
North America is estimated to contribute 42% to the growth of the global market during the forecast period. Technavio's analysts have elaborately explained the regional trends and drivers that shape the market during the forecast period.  In North America, the market is experiencing significant growth due to the increasing number of organizations recognizing the importance of inclusive business practices. The US, as part of North America, is a key contributor to this market, with over 7.6 million business entities as of Q1 2024. Approximately 83% of these entities operate in the service-providing sector, which includes industries such as finance, healthcare, and technology. These industries prioritize diversity and inclusion initiatives to attract and retain diverse talent, boost employee engagement, and enhance overall productivity.

To achieve measurable outcomes, diversity and inclusion consulting services employ various techniques, including inclusive leadership development and data-driven solutions. These approaches help organizations identify gaps and address them effectively. Seminars and training programs are also essential components of these services, providing tangible outcomes that contribute to lasting organizational change. By implementing these practices, businesses can foster an inclusive work environment, leading to a more productive and cooperative organization.

How do Technavio's company ranking index and market positioning come to your aid?

Companies are implementing various strategies, such as strategic alliances, partnerships, mergers and acquisitions, geographical expansion, and product/service launches, to enhance their presence in the market.

Accenture PLC - The company offers diversity and inclusion consulting services such as strategic alignment, data-driven insights, talent equity, and others.

Technavio provides the ranking index for the top 17 companies along with insights on the market positioning of:

  • BetterUP Inc.
  • Boston Consulting Group Inc.
  • Catalyst Inc
  • Culture Amp Pty Ltd.
  • Deloitte Touche Tohmatsu Ltd.
  • Ernst and Young Global Ltd.
  • Franklin Covey Co.
  • Inkling Group Pty Ltd
  • KPMG International Ltd.
  • McKinsey and Co.
  • Mercer LLC
  • Paradigm Strategy Inc.
  • Peoplism LLC
  • Pinnacle Consultancy Services Ltd
  • PricewaterhouseCoopers LLP
  • The Perry Consulting Group LLC

Explore our company rankings and market positioning Request Free Sample

How can Technavio Assist you in Making Critical Decisions?

Diversity And Inclusion Consulting Service Market Size

What is the Market Structure and Year-over-Year growth of the Market?

Market structure

Fragmented

YoY growth 2023-2024

12.5

Market Dynamic

Diversity and inclusion (D&I) have become essential components of modern business strategies in the US. Companies are recognizing the importance of fostering a workplace culture that values and includes individuals from diverse backgrounds. D&I consulting services play a crucial role in helping organizations identify gaps, implement best practices, and create an inclusive workplace environment. These services address various aspects of workplace diversity, equity, and inclusion, such as community engagement, talent acquisition, unconscious bias training, DEI reporting, and inclusive leadership. By promoting representation, addressing systemic inequities, and implementing sustainable D&I initiatives, consulting firms help businesses create a culture of belonging. Effective D&I strategies require a deep understanding of the communities businesses serve. Consulting services can help organizations engage with diverse communities, fostering trust and promoting positive relationships. D&I consulting services can help organizations attract, hire, and retain diverse talent. This includes implementing equitable hiring practices, addressing unconscious bias, and promoting accessibility in the recruitment process. Leadership plays a vital role in creating an inclusive workplace culture.

Consulting services can provide training and guidance on inclusive leadership practices, promoting diversity at all levels of the organization. Measuring the impact of D&I initiatives is essential for continuous improvement. Consulting services can help organizations evaluate their D&I programs, providing measurable results and recommendations for improvement. Creating inclusive teams is crucial for business success. D&I consulting services can help organizations build diverse teams, addressing gaps and promoting cultural competency. Inclusive product development ensures that products meet the needs of diverse customer bases. Consulting services can help organizations incorporate accessibility features, promote ethical business practices, and address representation gaps. Resource groups and inclusive work environments foster a sense of belonging and support for underrepresented groups. Consulting services can help organizations establish and optimize these initiatives, promoting a more inclusive workplace culture. Systemic inequities can hinder organizational progress. D&I consulting services can help organizations identify and address these issues, promoting a more equitable workplace. Diversity and inclusion consulting services are essential for businesses seeking to create a more inclusive and equitable workplace. By addressing various aspects of workplace diversity, equity, and inclusion, consulting firms help organizations build sustainable D&I strategies, foster a culture of belonging, and drive business success. Our researchers analyzed the data with 2023 as the base year, along with the key drivers, trends, and challenges. A holistic analysis of drivers will help companies refine their marketing strategies to gain a competitive advantage.

What are the Primary Factors Driving the Market Growth?

Improved employee retention and satisfaction is notably driving market growth. Diversity and inclusion consulting services are essential for fostering inclusive workplaces and cultures within organizations. These initiatives promote a sense of belonging among employees, leading to increased engagement, motivation, and commitment. By implementing diversity and inclusion strategies, organizations can enhance employee well-being through inclusive physical and psychological programs. Moreover, prioritizing diversity and inclusion can yield significant financial benefits, such as improved business outcomes, increased profitability, and innovation.

Additionally, inclusive work environments can boost an organization's reputation and customer satisfaction, making it an attractive place to work and do business with. Consulting services offer assessment and benchmarking, training programs, and measurable outcomes to help organizations address systemic inequalities and improve cultural competency. Open dialogues and ongoing training are crucial components of these efforts, facilitated by regulatory bodies to ensure compliance and continuous improvement. Thus, such factors are driving the growth of the market during the forecast period.

What are the Significant Trends being Witnessed in the Market?

Integration of AI into diversity and inclusion consulting services is the key trend in the market. Artificial intelligence (AI) is revolutionizing diversity and inclusion consulting services in the United States by addressing biases, fostering fairness, and providing equitable opportunities. In the realm of Inclusive Design and User Experience, AI technologies like natural language processing and computer vision are being employed to create solutions that cater to diverse user groups, including individuals with disabilities and varying cognitive abilities. These advancements enable the development of more accessible interfaces and assistive tools, ensuring digital products and services are inclusive for all.

Additionally, AI offers decision support tools that minimize biases in human decision-making processes, enhancing overall fairness and transparency within organizations. By integrating AI into diversity and inclusion initiatives, companies can make significant strides towards creating a more inclusive and equitable workforce and customer base. Thus, such trends will shape the growth of the market during the forecast period.


What are the Major Market Challenges?

The high cost associated with diversity and inclusion programs is the major challenge that affects the growth of the market. The implementation of diversity and inclusion programs in organizations comes with substantial expenses, posing a notable challenge to the market in the United States. Diversity training costs can significantly vary, with instructor-led sessions priced between USD 500 and USD 10,000, eLearning modules ranging from USD 200 to USD 5,000, and keynote speeches costing between USD 1,000 and USD 30,000. Furthermore, quantitative research can amount to between USD 25,000 and USD 80,000, while qualitative research may cost between USD 10,000 and USD 40,000.

Beyond training, other expenses include policy development, communication strategies, and social responsibility initiatives. Creating a sense of belonging and promoting gender equality in the workplace is essential for organizational loyalty and social justice. Implementing remote work policies can also contribute to a more inclusive work environment. Effective diversity strategy development is crucial for businesses seeking to attract and retain top talent while fostering a culture of inclusion. Hence, the above factors will impede the growth of the market during the forecast period.

Exclusive Customer Landscape

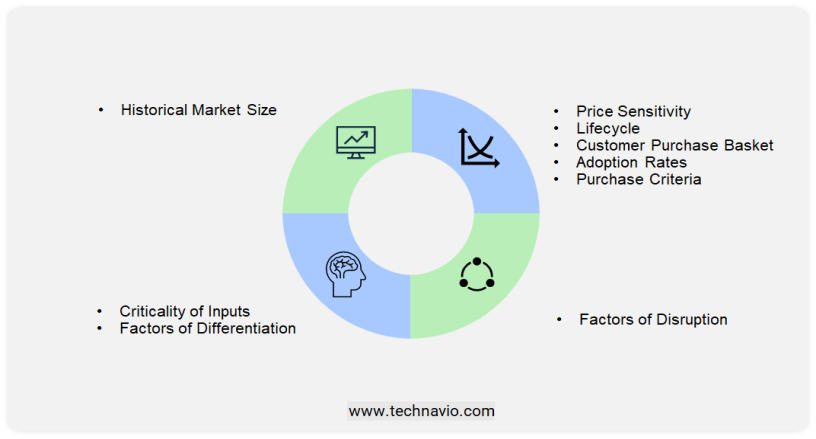
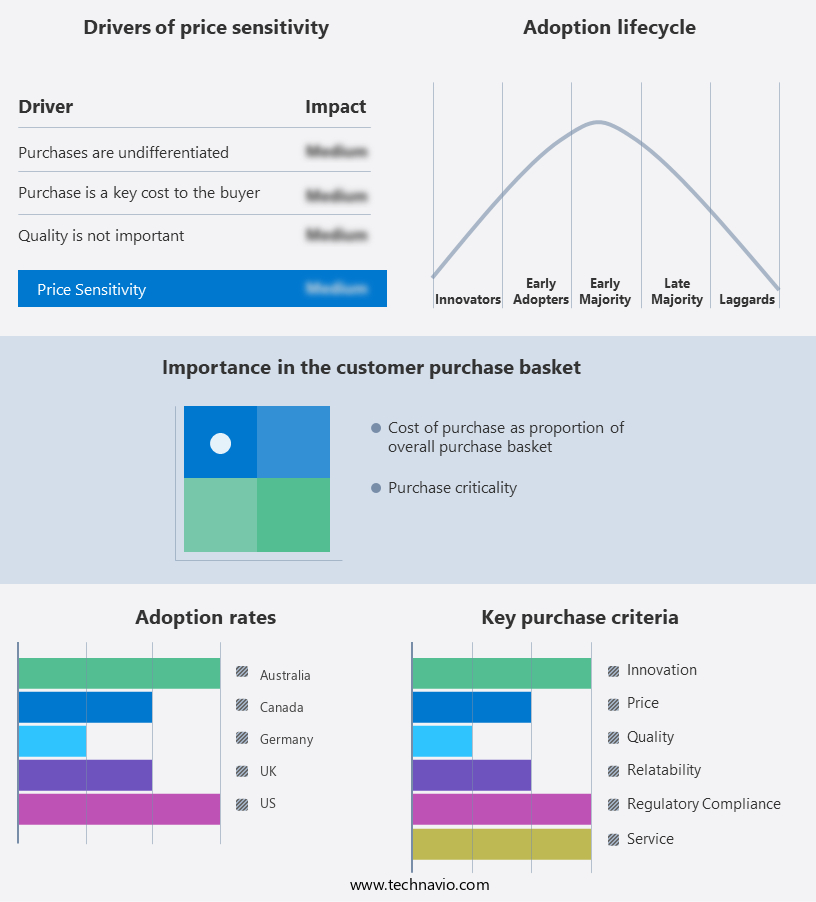
The market forecasting report includes the adoption lifecycle of the market research and growth, covering from the innovator's stage to the laggard's stage. It focuses on adoption rates in different regions based on penetration. Furthermore, the report also includes key purchase criteria and drivers of price sensitivity to help companies evaluate and develop their market growth analysis strategies.

Diversity And Inclusion Consulting Service Market Share by Geography

 Customer Landscape

Market Analyst Overview

Diversity and inclusion consulting services have gained significant importance in today's business landscape as societal values continue to evolve. These services help organizations address social awareness and education on DEI concepts, ensuring effective policies that promote representation and equity. Investors and customers increasingly demand businesses to prioritize DEI initiatives to mitigate reputational damage and legal ramifications. DEI consulting services offer comprehensive strategies to bridge gaps in hiring practices, employee engagement, and organizational culture. They provide training programs to address systemic biases and promote inclusive leadership development. DEI investments lead to measurable outcomes, including increased productivity, improved satisfaction, and lower turnover rates. Regulatory pressures and workforce expectations necessitate DEI policies that cater to a variety of viewpoints and identities. DEI techniques include data-driven solutions, cultural competency training, and recruitment tools.

DEI consulting services help organizations develop policies that foster an inclusive workplace and working cultures, ensuring a sense of belonging for all employees. Effective DEI policies address intersectionality and fairness, leading to tangible outcomes such as hiring results, staff engagement, and recruiting diverse candidates. Open dialogues and communication are essential components of DEI consulting services, allowing organizations to address performative acts and systemic inequalities. DEI consulting services enable businesses to navigate the complexities of DEI initiatives, ensuring a lasting impact on organizational change. They provide customized solutions to meet the unique needs of each organization, promoting social responsibility and creating a more inclusive business environment.

Market Scope

Report Coverage

Details

Page number

202

Base year

2023

Historic period

2018 - 2022

Forecast period

2024-2028

Growth momentum & CAGR

Accelerate at a CAGR of 12.7%

Market Growth 2024-2028

USD 2.89 billion

Regional analysis

North America, Europe, APAC, South America, and Middle East and Africa

Performing market contribution

North America at 42%

Key countries

US, UK, Canada, Germany, Australia, France, India, China, Brazil, and The Netherlands

Competitive landscape

Leading Companies, Market Positioning of Companies, Competitive Strategies, and Industry Risks

Key companies profiled

Accenture PLC, BetterUP Inc., Boston Consulting Group Inc., Catalyst Inc, Culture Amp Pty Ltd., Deloitte Touche Tohmatsu Ltd., Ernst and Young Global Ltd., Franklin Covey Co., Inkling Group Pty Ltd, KPMG International Ltd., McKinsey and Co., Mercer LLC, Paradigm Strategy Inc., Peoplism LLC, Pinnacle Consultancy Services Ltd, PricewaterhouseCoopers LLP, and The Perry Consulting Group LLC

Market dynamics

Parent market analysis, market growth inducers and obstacles, fast-growing and slow-growing segment analysis, AI impact on market trends, COVID-19 impact and recovery analysis and future consumer dynamics, market condition analysis for the market forecast period

Customization purview

If our market report has not included the data that you are looking for, you can reach out to our analysts and get segments customized.

Download PDF Sample

What are the Key Data Covered in this Market Research Report?

  • CAGR of the market during the forecast period
  • Detailed information on factors that will drive the market growth and forecasting between 2024 and 2028
  • Precise estimation of the size of the market  and its contribution of the market in focus to the parent market
  • Accurate predictions about upcoming market growth and trends and changes in consumer behaviour
  • Growth of the market across North America, Europe, APAC, South America, and Middle East and Africa
  • Thorough analysis of the market's competitive landscape and detailed information about companies
  • Comprehensive analysis of factors that will challenge the growth of market companies

1 Executive Summary

  • 1.1 Market overview
    • Executive Summary - Chart on Market Overview
    • Executive Summary - Data Table on Market Overview
    • Executive Summary - Chart on Global Market Characteristics
    • Executive Summary - Chart on Market by Geography
    • Executive Summary - Chart on Market Segmentation by Application
    • Executive Summary - Chart on Market Segmentation by End-user
    • Executive Summary - Chart on Incremental Growth
    • Executive Summary - Data Table on Incremental Growth
    • Executive Summary - Chart on Company Market Positioning

2 Technavio Analysis

  • 2.1 Analysis of price sensitivity, lifecycle, customer purchase basket, adoption rates, and purchase criteria
    • Analysis of price sensitivity, lifecycle, customer purchase basket, adoption rates, and purchase criteria
  • 2.2 Criticality of inputs and Factors of differentiation
    • Overview on criticality of inputs and factors of differentiation
  • 2.3 Factors of disruption
    • Overview on factors of disruption
  • 2.4 Impact of drivers and challenges
    • Impact of drivers and challenges in 2023 and 2028

3 Market Landscape

  • 3.1 Market ecosystem
    • Parent Market
    • Data Table on - Parent Market
  • 3.2 Market characteristics
    • Market characteristics analysis
  • 3.3 Value chain analysis
    • Value Chain Analysis

4 Market Sizing

  • 4.1 Market definition
    • Offerings of companies included in the market definition
  • 4.2 Market segment analysis
    • Market segments
  • 4.3 Market size 2023
    • 4.4 Market outlook: Forecast for 2023-2028
      • Chart on Global - Market size and forecast 2023-2028 ($ million)
      • Data Table on Global - Market size and forecast 2023-2028 ($ million)
      • Chart on Global Market: Year-over-year growth 2023-2028 (%)
      • Data Table on Global Market: Year-over-year growth 2023-2028 (%)

    5 Historic Market Size

    • 5.1 Global Diversity And Inclusion Consulting Service Market 2018 - 2022
      • Historic Market Size - Data Table on Global Diversity And Inclusion Consulting Service Market 2018 - 2022 ($ million)
    • 5.2 Application segment analysis 2018 - 2022
      • Historic Market Size - Application Segment 2018 - 2022 ($ million)
    • 5.3 End-user segment analysis 2018 - 2022
      • Historic Market Size - End-user Segment 2018 - 2022 ($ million)
    • 5.4 Geography segment analysis 2018 - 2022
      • Historic Market Size - Geography Segment 2018 - 2022 ($ million)
    • 5.5 Country segment analysis 2018 - 2022
      • Historic Market Size - Country Segment 2018 - 2022 ($ million)

    6 Qualitative Analysis

    • 6.1 Impact of AI on the Global Diversity and Inclusion Consulting Service Market

      7 Five Forces Analysis

      • 7.1 Five forces summary
        • Five forces analysis - Comparison between 2023 and 2028
      • 7.2 Bargaining power of buyers
        • Bargaining power of buyers - Impact of key factors 2023 and 2028
      • 7.3 Bargaining power of suppliers
        • Bargaining power of suppliers - Impact of key factors in 2023 and 2028
      • 7.4 Threat of new entrants
        • Threat of new entrants - Impact of key factors in 2023 and 2028
      • 7.5 Threat of substitutes
        • Threat of substitutes - Impact of key factors in 2023 and 2028
      • 7.6 Threat of rivalry
        • Threat of rivalry - Impact of key factors in 2023 and 2028
      • 7.7 Market condition
        • Chart on Market condition - Five forces 2023 and 2028

      8 Market Segmentation by Application

      • 8.1 Market segments
        • Chart on Application - Market share 2023-2028 (%)
        • Data Table on Application - Market share 2023-2028 (%)
      • 8.2 Comparison by Application
        • Chart on Comparison by Application
        • Data Table on Comparison by Application
      • 8.3 Large enterprises - Market size and forecast 2023-2028
        • Chart on Large enterprises - Market size and forecast 2023-2028 ($ million)
        • Data Table on Large enterprises - Market size and forecast 2023-2028 ($ million)
        • Chart on Large enterprises - Year-over-year growth 2023-2028 (%)
        • Data Table on Large enterprises - Year-over-year growth 2023-2028 (%)
      • 8.4 Small and medium-sized enterprises - Market size and forecast 2023-2028
        • Chart on Small and medium-sized enterprises - Market size and forecast 2023-2028 ($ million)
        • Data Table on Small and medium-sized enterprises - Market size and forecast 2023-2028 ($ million)
        • Chart on Small and medium-sized enterprises - Year-over-year growth 2023-2028 (%)
        • Data Table on Small and medium-sized enterprises - Year-over-year growth 2023-2028 (%)
      • 8.5 Market opportunity by Application
        • Market opportunity by Application ($ million)
        • Data Table on Market opportunity by Application ($ million)

      9 Market Segmentation by End-user

      • 9.1 Market segments
        • Chart on End-user - Market share 2023-2028 (%)
        • Data Table on End-user - Market share 2023-2028 (%)
      • 9.2 Comparison by End-user
        • Chart on Comparison by End-user
        • Data Table on Comparison by End-user
      • 9.3 Private sector - Market size and forecast 2023-2028
        • Chart on Private sector - Market size and forecast 2023-2028 ($ million)
        • Data Table on Private sector - Market size and forecast 2023-2028 ($ million)
        • Chart on Private sector - Year-over-year growth 2023-2028 (%)
        • Data Table on Private sector - Year-over-year growth 2023-2028 (%)
      • 9.4 Public sector - Market size and forecast 2023-2028
        • Chart on Public sector - Market size and forecast 2023-2028 ($ million)
        • Data Table on Public sector - Market size and forecast 2023-2028 ($ million)
        • Chart on Public sector - Year-over-year growth 2023-2028 (%)
        • Data Table on Public sector - Year-over-year growth 2023-2028 (%)
      • 9.5 Others - Market size and forecast 2023-2028
        • Chart on Others - Market size and forecast 2023-2028 ($ million)
        • Data Table on Others - Market size and forecast 2023-2028 ($ million)
        • Chart on Others - Year-over-year growth 2023-2028 (%)
        • Data Table on Others - Year-over-year growth 2023-2028 (%)
      • 9.6 Market opportunity by End-user
        • Market opportunity by End-user ($ million)
        • Data Table on Market opportunity by End-user ($ million)

      10 Customer Landscape

      • 10.1 Customer landscape overview
        • Analysis of price sensitivity, lifecycle, customer purchase basket, adoption rates, and purchase criteria

      11 Geographic Landscape

      • 11.1 Geographic segmentation
        • Chart on Market share by geography 2023-2028 (%)
        • Data Table on Market share by geography 2023-2028 (%)
      • 11.2 Geographic comparison
        • Chart on Geographic comparison
        • Data Table on Geographic comparison
      • 11.3 North America - Market size and forecast 2023-2028
        • Chart on North America - Market size and forecast 2023-2028 ($ million)
        • Data Table on North America - Market size and forecast 2023-2028 ($ million)
        • Chart on North America - Year-over-year growth 2023-2028 (%)
        • Data Table on North America - Year-over-year growth 2023-2028 (%)
      • 11.4 Europe - Market size and forecast 2023-2028
        • Chart on Europe - Market size and forecast 2023-2028 ($ million)
        • Data Table on Europe - Market size and forecast 2023-2028 ($ million)
        • Chart on Europe - Year-over-year growth 2023-2028 (%)
        • Data Table on Europe - Year-over-year growth 2023-2028 (%)
      • 11.5 APAC - Market size and forecast 2023-2028
        • Chart on APAC - Market size and forecast 2023-2028 ($ million)
        • Data Table on APAC - Market size and forecast 2023-2028 ($ million)
        • Chart on APAC - Year-over-year growth 2023-2028 (%)
        • Data Table on APAC - Year-over-year growth 2023-2028 (%)
      • 11.6 South America - Market size and forecast 2023-2028
        • Chart on South America - Market size and forecast 2023-2028 ($ million)
        • Data Table on South America - Market size and forecast 2023-2028 ($ million)
        • Chart on South America - Year-over-year growth 2023-2028 (%)
        • Data Table on South America - Year-over-year growth 2023-2028 (%)
      • 11.7 Middle East and Africa - Market size and forecast 2023-2028
        • Chart on Middle East and Africa - Market size and forecast 2023-2028 ($ million)
        • Data Table on Middle East and Africa - Market size and forecast 2023-2028 ($ million)
        • Chart on Middle East and Africa - Year-over-year growth 2023-2028 (%)
        • Data Table on Middle East and Africa - Year-over-year growth 2023-2028 (%)
      • 11.8 US - Market size and forecast 2023-2028
        • Chart on US - Market size and forecast 2023-2028 ($ million)
        • Data Table on US - Market size and forecast 2023-2028 ($ million)
        • Chart on US - Year-over-year growth 2023-2028 (%)
        • Data Table on US - Year-over-year growth 2023-2028 (%)
      • 11.9 UK - Market size and forecast 2023-2028
        • Chart on UK - Market size and forecast 2023-2028 ($ million)
        • Data Table on UK - Market size and forecast 2023-2028 ($ million)
        • Chart on UK - Year-over-year growth 2023-2028 (%)
        • Data Table on UK - Year-over-year growth 2023-2028 (%)
      • 11.10 Canada - Market size and forecast 2023-2028
        • Chart on Canada - Market size and forecast 2023-2028 ($ million)
        • Data Table on Canada - Market size and forecast 2023-2028 ($ million)
        • Chart on Canada - Year-over-year growth 2023-2028 (%)
        • Data Table on Canada - Year-over-year growth 2023-2028 (%)
      • 11.11 Germany - Market size and forecast 2023-2028
        • Chart on Germany - Market size and forecast 2023-2028 ($ million)
        • Data Table on Germany - Market size and forecast 2023-2028 ($ million)
        • Chart on Germany - Year-over-year growth 2023-2028 (%)
        • Data Table on Germany - Year-over-year growth 2023-2028 (%)
      • 11.12 Australia - Market size and forecast 2023-2028
        • Chart on Australia - Market size and forecast 2023-2028 ($ million)
        • Data Table on Australia - Market size and forecast 2023-2028 ($ million)
        • Chart on Australia - Year-over-year growth 2023-2028 (%)
        • Data Table on Australia - Year-over-year growth 2023-2028 (%)
      • 11.13 France - Market size and forecast 2023-2028
        • Chart on France - Market size and forecast 2023-2028 ($ million)
        • Data Table on France - Market size and forecast 2023-2028 ($ million)
        • Chart on France - Year-over-year growth 2023-2028 (%)
        • Data Table on France - Year-over-year growth 2023-2028 (%)
      • 11.14 India - Market size and forecast 2023-2028
        • Chart on India - Market size and forecast 2023-2028 ($ million)
        • Data Table on India - Market size and forecast 2023-2028 ($ million)
        • Chart on India - Year-over-year growth 2023-2028 (%)
        • Data Table on India - Year-over-year growth 2023-2028 (%)
      • 11.15 China - Market size and forecast 2023-2028
        • Chart on China - Market size and forecast 2023-2028 ($ million)
        • Data Table on China - Market size and forecast 2023-2028 ($ million)
        • Chart on China - Year-over-year growth 2023-2028 (%)
        • Data Table on China - Year-over-year growth 2023-2028 (%)
      • 11.16 Brazil - Market size and forecast 2023-2028
        • Chart on Brazil - Market size and forecast 2023-2028 ($ million)
        • Data Table on Brazil - Market size and forecast 2023-2028 ($ million)
        • Chart on Brazil - Year-over-year growth 2023-2028 (%)
        • Data Table on Brazil - Year-over-year growth 2023-2028 (%)
      • 11.17 The Netherlands - Market size and forecast 2023-2028
        • Chart on The Netherlands - Market size and forecast 2023-2028 ($ million)
        • Data Table on The Netherlands - Market size and forecast 2023-2028 ($ million)
        • Chart on The Netherlands - Year-over-year growth 2023-2028 (%)
        • Data Table on The Netherlands - Year-over-year growth 2023-2028 (%)
      • 11.18 Market opportunity by geography
        • Market opportunity by geography ($ million)
        • Data Tables on Market opportunity by geography ($ million)

      12 Drivers, Challenges, and Opportunity/Restraints

      • 12.1 Market drivers
        • 12.2 Market challenges
          • 12.3 Impact of drivers and challenges
            • Impact of drivers and challenges in 2023 and 2028
          • 12.4 Market opportunities/restraints

            13 Competitive Landscape

            • 13.1 Overview
              • 13.2 Competitive Landscape
                • Overview on criticality of inputs and factors of differentiation
              • 13.3 Landscape disruption
                • Overview on factors of disruption
              • 13.4 Industry risks
                • Impact of key risks on business

              14 Competitive Analysis

              • 14.1 Companies profiled
                • Companies covered
              • 14.2 Company ranking index
                • Company ranking index
              • 14.3 Market positioning of companies
                • Matrix on companies position and classification
              • 14.4 Accenture PLC
                • Accenture PLC - Overview
                • Accenture PLC - Business segments
                • Accenture PLC - Key news
                • Accenture PLC - Key offerings
                • Accenture PLC - Segment focus
                • SWOT
              • 14.5 BetterUP Inc.
                • BetterUP Inc. - Overview
                • BetterUP Inc. - Product / Service
                • BetterUP Inc. - Key offerings
                • SWOT
              • 14.6 Boston Consulting Group Inc.
                • Boston Consulting Group Inc. - Overview
                • Boston Consulting Group Inc. - Product / Service
                • Boston Consulting Group Inc. - Key offerings
                • SWOT
              • 14.7 Catalyst Inc
                • Catalyst Inc - Overview
                • Catalyst Inc - Product / Service
                • Catalyst Inc - Key offerings
                • SWOT
              • 14.8 Culture Amp Pty Ltd.
                • Culture Amp Pty Ltd. - Overview
                • Culture Amp Pty Ltd. - Product / Service
                • Culture Amp Pty Ltd. - Key offerings
                • SWOT
              • 14.9 Deloitte Touche Tohmatsu Ltd.
                • Deloitte Touche Tohmatsu Ltd. - Overview
                • Deloitte Touche Tohmatsu Ltd. - Product / Service
                • Deloitte Touche Tohmatsu Ltd. - Key news
                • Deloitte Touche Tohmatsu Ltd. - Key offerings
                • SWOT
              • 14.10 Ernst and Young Global Ltd.
                • Ernst and Young Global Ltd. - Overview
                • Ernst and Young Global Ltd. - Product / Service
                • Ernst and Young Global Ltd. - Key offerings
                • SWOT
              • 14.11 Franklin Covey Co.
                • Franklin Covey Co. - Overview
                • Franklin Covey Co. - Business segments
                • Franklin Covey Co. - Key offerings
                • Franklin Covey Co. - Segment focus
                • SWOT
              • 14.12 KPMG International Ltd.
                • KPMG International Ltd. - Overview
                • KPMG International Ltd. - Product / Service
                • KPMG International Ltd. - Key offerings
                • SWOT
              • 14.13 McKinsey and Co.
                • McKinsey and Co. - Overview
                • McKinsey and Co. - Product / Service
                • McKinsey and Co. - Key offerings
                • SWOT
              • 14.14 Mercer LLC
                • Mercer LLC - Overview
                • Mercer LLC - Product / Service
                • Mercer LLC - Key offerings
                • SWOT
              • 14.15 Paradigm Strategy Inc.
                • Paradigm Strategy Inc. - Overview
                • Paradigm Strategy Inc. - Product / Service
                • Paradigm Strategy Inc. - Key offerings
                • SWOT
              • 14.16 Pinnacle Consultancy Services Ltd
                • Pinnacle Consultancy Services Ltd - Overview
                • Pinnacle Consultancy Services Ltd - Product / Service
                • Pinnacle Consultancy Services Ltd - Key offerings
                • SWOT
              • 14.17 PricewaterhouseCoopers LLP
                • PricewaterhouseCoopers LLP - Overview
                • PricewaterhouseCoopers LLP - Product / Service
                • PricewaterhouseCoopers LLP - Key offerings
                • SWOT
              • 14.18 The Perry Consulting Group LLC
                • The Perry Consulting Group LLC - Overview
                • The Perry Consulting Group LLC - Product / Service
                • The Perry Consulting Group LLC - Key offerings
                • SWOT

              15 Appendix

              • 15.1 Scope of the report
                • 15.2 Inclusions and exclusions checklist
                  • Inclusions checklist
                  • Exclusions checklist
                • 15.3 Currency conversion rates for US$
                  • Currency conversion rates for US$
                • 15.4 Research methodology
                  • Research methodology
                • 15.5 Data procurement
                  • Information sources
                • 15.6 Data validation
                  • Data validation
                • 15.7 Validation techniques employed for market sizing
                  • Validation techniques employed for market sizing
                • 15.8 Data synthesis
                  • Data synthesis
                • 15.9 360 degree market analysis
                  • 360 degree market analysis
                • 15.10 List of abbreviations
                  • List of abbreviations

                Research Methodology

                Technavio presents a detailed picture of the market by way of study, synthesis, and summation of data from multiple sources. The analysts have presented the various facets of the market with a particular focus on identifying the key industry influencers. The data thus presented is comprehensive, reliable, and the result of extensive research, both primary and secondary.

                INFORMATION SOURCES

                Primary sources

                • Manufacturers and suppliers
                • Channel partners
                • Industry experts
                • Strategic decision makers

                Secondary sources

                • Industry journals and periodicals
                • Government data
                • Financial reports of key industry players
                • Historical data
                • Press releases

                DATA ANALYSIS

                Data Synthesis

                • Collation of data
                • Estimation of key figures
                • Analysis of derived insights

                Data Validation

                • Triangulation with data models
                • Reference against proprietary databases
                • Corroboration with industry experts

                REPORT WRITING

                Qualitative

                • Market drivers
                • Market challenges
                • Market trends
                • Five forces analysis

                Quantitative

                • Market size and forecast
                • Market segmentation
                • Geographical insights
                • Competitive landscape

                Interested in this report?

                Get your sample now to see our research methodology and insights!

                Download Now

                Frequently Asked Questions

                Diversity And Inclusion Consulting Service market growth will increase by $ 2887.9 mn during 2024-2028 .

                The Diversity And Inclusion Consulting Service market is expected to grow at a CAGR of 12.7% during 2024-2028 .

                Diversity And Inclusion Consulting Service market is segmented by Application( Large enterprises, Small and medium-sized enterprises) End-user( Private sector, Public sector, Others)

                Accenture PLC, BetterUP Inc., Boston Consulting Group Inc., Catalyst Inc, Culture Amp Pty Ltd., Deloitte Touche Tohmatsu Ltd., Ernst and Young Global Ltd., Franklin Covey Co., Inkling Group Pty Ltd, KPMG International Ltd., McKinsey and Co., Mercer LLC, Paradigm Strategy Inc., Peoplism LLC, Pinnacle Consultancy Services Ltd, PricewaterhouseCoopers LLP, The Perry Consulting Group LLC are a few of the key vendors in the Diversity And Inclusion Consulting Service market.

                North America will register the highest growth rate of 42% among the other regions. Therefore, the Diversity And Inclusion Consulting Service market in North America is expected to garner significant business opportunities for the vendors during the forecast period.

                US, UK, Canada, Germany, Australia, France, India, China, Brazil, The Netherlands

                • Improved employee retention and satisfactionDiversity and inclusion consulting services play a crucial role in enhancing employee retention and satisfaction. By cultivating a sense of belonging is the driving factor this market.
                • diversity and inclusion initiatives help create a welcoming workplace environment that enhances employee engagement is the driving factor this market.
                • motivation is the driving factor this market.
                • and commitment. These initiatives support inclusive physical and psychological well-being programs is the driving factor this market.
                • which further enhance employee engagement and overall satisfaction.Implementing diversity and inclusion strategies can also lead to significant financial benefits for organizations. Companies that prioritize diversity and inclusion often see better business outcomes is the driving factor this market.
                • including increased profitability and innovation. Additionally is the driving factor this market.
                • diversity and inclusion efforts can enhance the reputation and customer satisfaction of an organization is the driving factor this market.
                • making it a more attractive place to work and do business with.The impact of diversity and inclusion on employee retention is evident in various regions. In the US is the driving factor this market.
                • voluntary quits dropped significantly to 2.4% is the driving factor this market.
                • with total job quits declining to 44.5 million in 2023 from 50.6 million in 2022. This indicates that employees are more likely to stay with companies that prioritize diversity and inclusion. In Canada is the driving factor this market.
                • the turnover rate increased to 15.5% in 2023 is the driving factor this market.
                • an 88% rise since 2010 is the driving factor this market.
                • highlighting the need for effective diversity and inclusion strategies to retain talent. In Japan is the driving factor this market.
                • 54% of companies reported taking action to reduce employee turnover in 2023 is the driving factor this market.
                • up from 48% in 2022 is the driving factor this market.
                • demonstrating a growing recognition of the importance of diversity and inclusion in employee retention. In France is the driving factor this market.
                • employee retention has improved is the driving factor this market.
                • with the average employee tenure rising from 9.76 years in 2022 to 10.8 years in 2024. is the driving factor this market.

                The Diversity And Inclusion Consulting Service market vendors should focus on grabbing business opportunities from the Large enterprises segment as it accounted for the largest market share in the base year.