Drayage Services Market Size 2026-2030
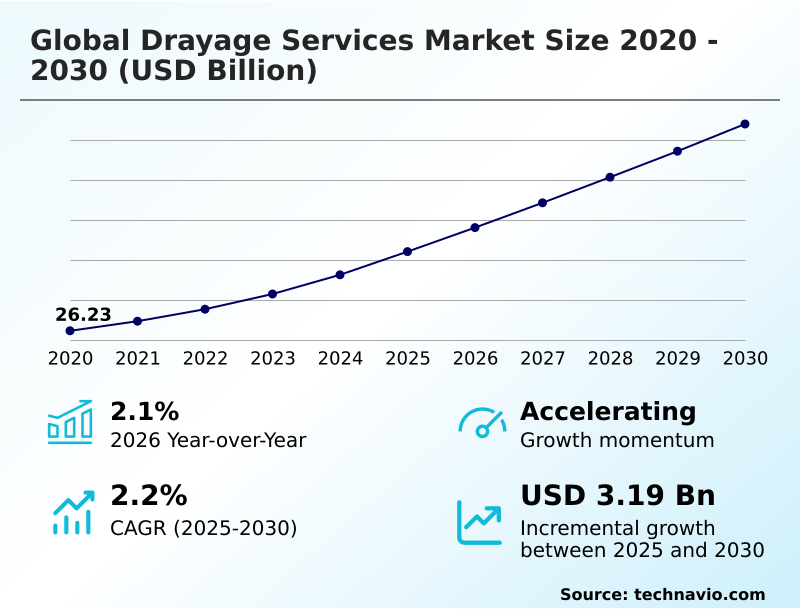
The drayage services market size is valued to increase by USD 3.19 billion, at a CAGR of 2.2% from 2025 to 2030. Proliferation of e-commerce and evolution of last-mile logistics integration will drive the drayage services market.
Major Market Trends & Insights
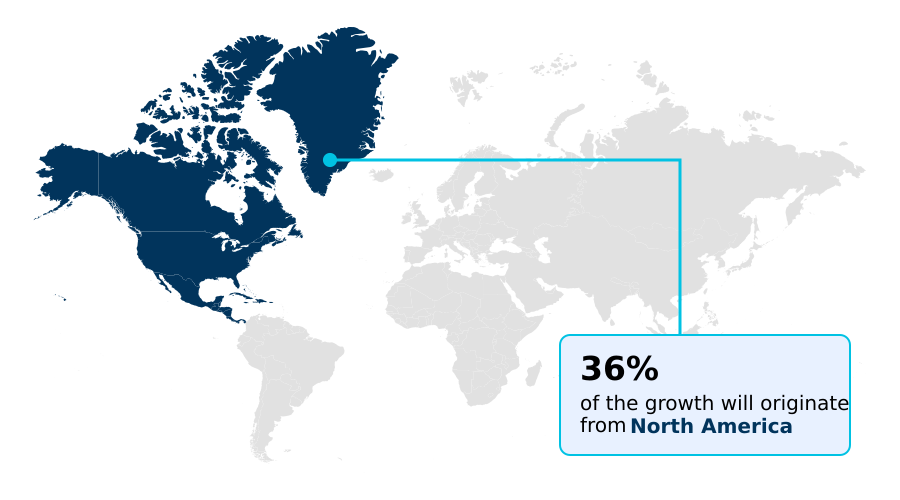
- North America dominated the market and accounted for a 36.3% growth during the forecast period.
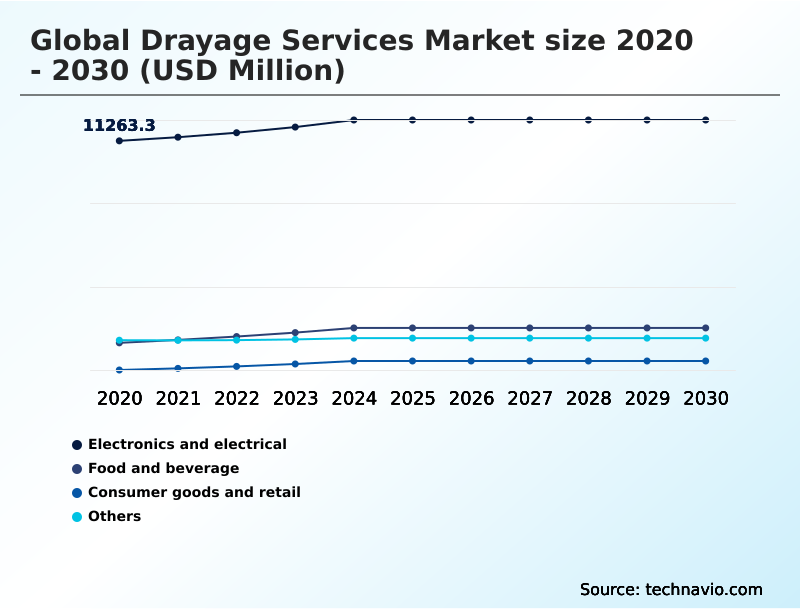
- By End-user - Electronics and electrical segment was valued at USD 11.89 billion in 2024
- By Type - Inter-carrier drayage segment accounted for the largest market revenue share in 2024
Market Size & Forecast
- Market Opportunities: USD 5.17 billion
- Market Future Opportunities: USD 3.19 billion
- CAGR from 2025 to 2030 : 2.2%
Market Summary
- The drayage services market is a critical artery in global trade, facilitating the short-haul logistics required to move containerized goods between major maritime gateways and inland distribution hubs. Market dynamics are heavily influenced by the push for decarbonization, leading to investments in zero-emission fleets and alternative-fuel vehicles to mitigate environmental impact.
- Simultaneously, the rise of digital marketplaces and digital freight matching is transforming the sector from a fragmented network into a more connected ecosystem, enhancing supply chain transparency. For instance, a logistics provider integrating real-time visibility platforms can optimize driver turn times and reduce port congestion, directly improving intermodal connectivity.
- However, the industry grapples with significant challenges, including the high capital cost of zero-emission equipment and systemic interoperability issues between disparate terminal operating systems. Balancing sustainability mandates, technological adoption, and workforce stability defines the competitive landscape, where efficiency in intermodal drayage and container transport dictates success.
- This complex interplay ensures the continuous evolution of services like pier drayage and shuttle drayage to meet the demands of a fast-paced global economy.
What will be the Size of the Drayage Services Market during the forecast period?
Get Key Insights on Market Forecast (PDF) Get Free Sample
How is the Drayage Services Market Segmented?
The drayage services industry research report provides comprehensive data (region-wise segment analysis), with forecasts and estimates in "USD million" for the period 2026-2030, as well as historical data from 2020-2024 for the following segments.
- End-user
- Electronics and electrical
- Food and beverage
- Consumer goods and retail
- Others
- Type
- Inter-carrier drayage
- Expedited drayage
- Intra-carrier drayage
- Pier drayage
- Others
- Mode of transportation
- Truck
- Rail
- Ship
- Geography
- APAC
- China
- Japan
- India
- North America
- US
- Canada
- Mexico
- Europe
- Germany
- UK
- France
- Middle East and Africa
- Saudi Arabia
- UAE
- South Africa
- South America
- Brazil
- Argentina
- Rest of World (ROW)
- APAC
By End-user Insights
The electronics and electrical segment is estimated to witness significant growth during the forecast period.
The electronics and electrical segment's reliance on drayage services is intensifying, driven by the need for secure and punctual short-haul logistics for high-value goods.
Success in this vertical depends on sophisticated supply chain services and robust freight management to support just-in-time manufacturing models.
Companies require seamless port to door logistics, where integrated logistics solutions combine port drayage and intermodal logistics services to ensure container transport from maritime gateways to inland facilities without delay.
The complexity of these supply chains has led to the adoption of advanced freight brokerage, with top-tier providers achieving over a 15% improvement in on-time delivery rates through optimized trucking-based drayage and coordinated intermodal drayage, enhancing overall supply chain integrity and responsiveness.
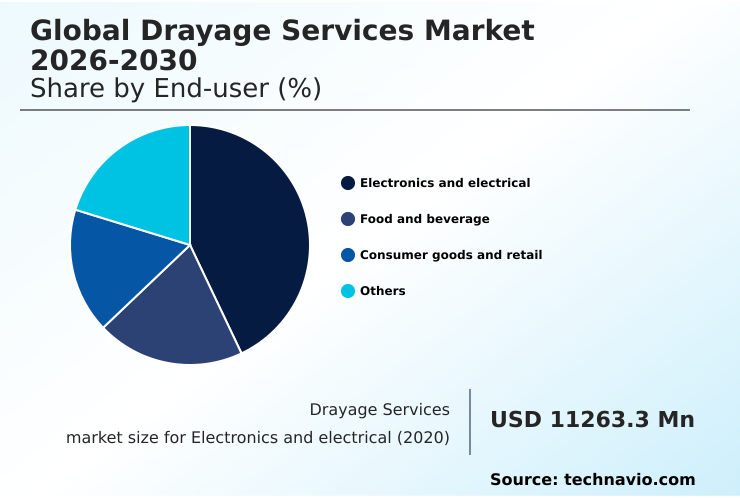
The Electronics and electrical segment was valued at USD 11.89 billion in 2024 and showed a gradual increase during the forecast period.
Regional Analysis
North America is estimated to contribute 36.3% to the growth of the global market during the forecast period.Technavio’s analysts have elaborately explained the regional trends and drivers that shape the market during the forecast period.
See How Drayage Services Market Demand is Rising in North America Get Free Sample
The geographic landscape of the drayage services market is heavily influenced by the flow of containerized trade through major maritime gateways.
North America is poised to contribute over 36% of the market's incremental growth, driven by robust intermodal connectivity and the modernization of terminal operating systems at key ports.
In this region, the seamless coordination of pier drayage with inland rail-to-truck interfaces is critical for providing efficient door-to-door service for containerized goods.
Meanwhile, the APAC region is leveraging technology to accelerate its container transport operations, with major ports achieving a 10% faster processing of cargo through automation.
The development of new mega-ports and inland clearance depots in this region is expanding the scope of regional intermodal services and solidifying its role as a global transshipment hub, with a focus on streamlining cross-border drayage.
Market Dynamics
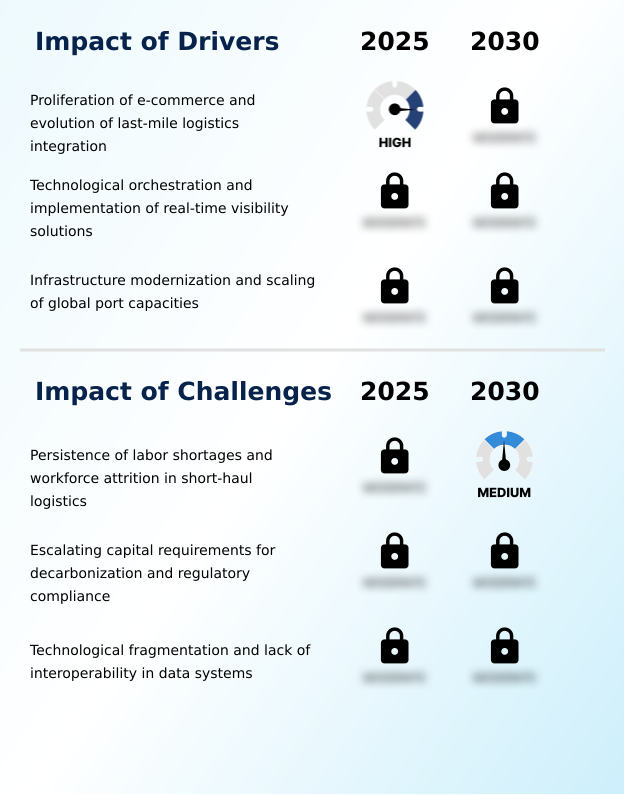
Our researchers analyzed the data with 2025 as the base year, along with the key drivers, trends, and challenges. A holistic analysis of drivers will help companies refine their marketing strategies to gain a competitive advantage.
- The future of the drayage services market is being shaped by specialized applications and technological integration. The rapid expansion of online retail has amplified the need for drayage services for e-commerce fulfillment, which demands last-mile drayage for retail distribution.
- Central to this evolution is the demand for real-time visibility in short-haul logistics, a key factor in managing port congestion with predictive analytics. A significant boardroom focus is the decarbonization of port drayage fleets, driven by stringent zero-emission drayage vehicle regulations. This shift introduces challenges around the capital requirements for electric drayage trucks.
- Operationally, the industry is exploring the use of autonomous trucks in geofenced port areas while refining the role of drayage in intermodal networks. For providers, success hinges on integrating drayage with terminal operating systems and offering specialized solutions, including drayage services for temperature-controlled containers and the complex logistics of pier drayage for oversized industrial cargo.
- Furthermore, the rise of digital freight brokerage for drayage platforms is critical for addressing the interoperability challenges in drayage data systems and improving drayage chassis pool management strategies. The industry must also address the persistent workforce attrition in the drayage industry and consider the impact of nearshoring on drayage demand.
- Finally, ensuring robust security protocols for high-value drayage and optimizing drayage turn times at terminals remain fundamental to maintaining a competitive edge, with firms adopting these strategies reporting a 15% higher asset utilization rate compared to laggards. The crucial link of intermodal drayage between port and rail continues to be a cornerstone of efficient supply chains.
What are the key market drivers leading to the rise in the adoption of Drayage Services Industry?
- The proliferation of e-commerce, coupled with the evolution of integrated last-mile logistics, stands as a key driver propelling growth in the drayage services market.
- Market growth is significantly driven by digitalization and e-commerce expansion. The surge in online retail has intensified the demand for efficient last-mile logistics and time-sensitive freight services, leading to a 30% rise in shipment volumes requiring rapid warehouse transportation.
- This has elevated the importance of real-time visibility across intermodal networks, which is achieved through advanced logistics management systems. These platforms enhance supply chain transparency and facilitate digital freight matching, improving the container turnaround process.
- The development of dedicated freight corridors and the offering of flexible power-only services further support this growth. As a result, firms utilizing integrated digital tools report a 20% reduction in vehicle idle times at global freight forwarding hubs.
What are the market trends shaping the Drayage Services Industry?
- The proliferation of zero-emission fleets, supported by the development of sustainable port infrastructure, is emerging as a primary market trend. This shift is fundamentally reshaping operational standards and investment priorities within the logistics sector.
- Key market trends are centered on sustainability and automation. The push for zero-emission fleets is accelerating, with the adoption of battery-electric vehicles and alternative-fuel vehicles for shuttle drayage increasing by over 25% in major port areas. This transition is supported by advancements in automated port orchestration and broader port automation, which improve the efficiency of intermodal transport.
- The integration of autonomous technologies is also redefining last-mile delivery, with high productivity freight vehicles enhancing logistical capabilities. Digital marketplaces are further enabling circular economy logistics and improving managed transportation. These innovations collectively aim to create a more efficient and sustainable logistics ecosystem, with some ports reporting a 15% improvement in throughput.
What challenges does the Drayage Services Industry face during its growth?
- Persistent labor shortages and high workforce attrition rates in the short-haul logistics sector present a significant challenge that impacts industry growth and operational stability.
- The market faces significant operational and financial challenges. Persistent port congestion and inefficient driver turn times continue to strain short-haul logistics networks. The industry-wide push for decarbonization presents a major hurdle, with capital requirements for new zero-emission equipment increasing by up to 40% for many operators.
- This affects not only standard container hauling but also specialized services like hazardous materials transport and the movement of oversized cargo. Fragmented logistics networks and high logistics costs add complexity, particularly for firms engaged in contract logistics.
- Furthermore, driver vacancy rates are approaching 15% in key regions, exacerbating the difficulties in short-haul transportation and impacting overall service reliability and regulatory compliance.
Exclusive Technavio Analysis on Customer Landscape
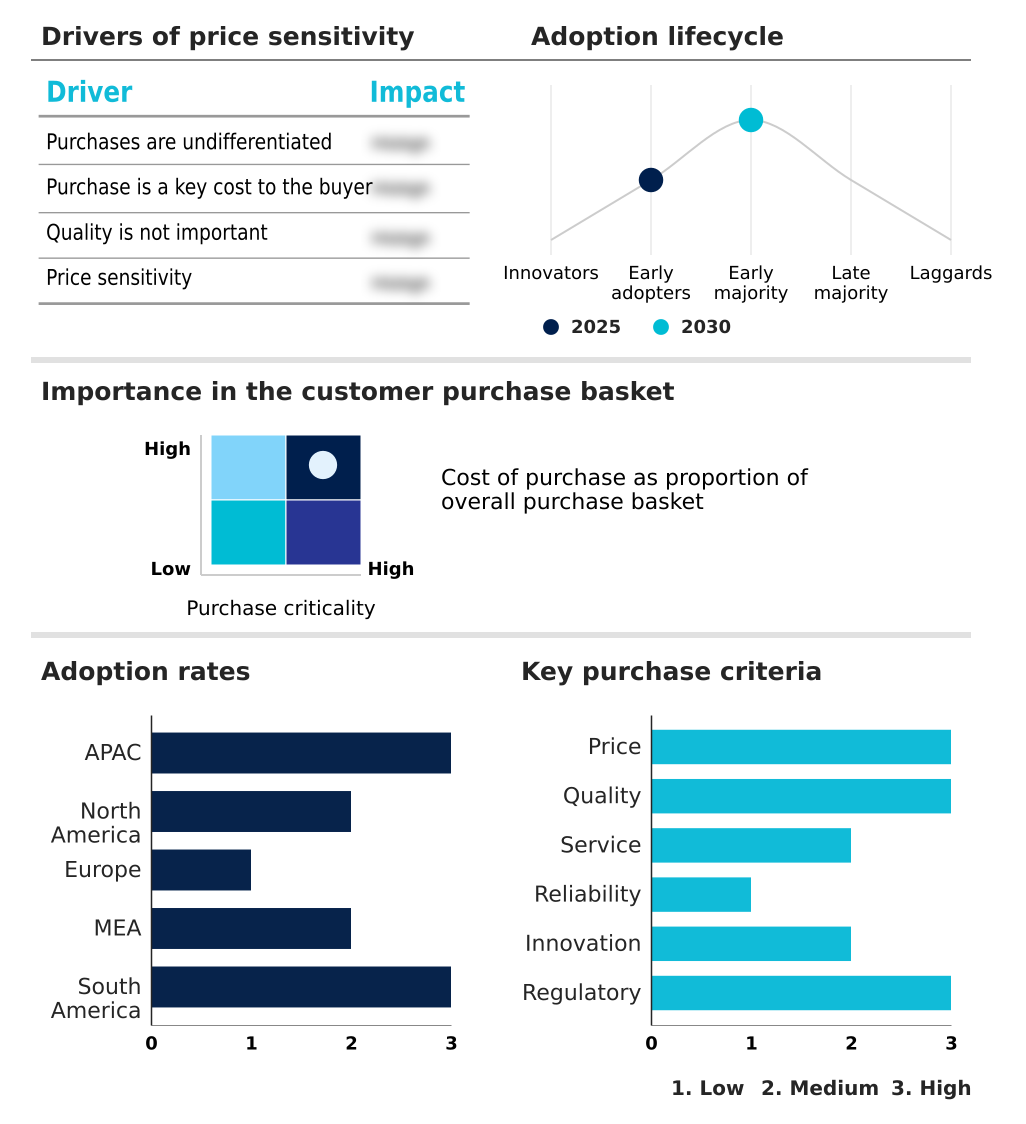
The drayage services market forecasting report includes the adoption lifecycle of the market, covering from the innovator’s stage to the laggard’s stage. It focuses on adoption rates in different regions based on penetration. Furthermore, the drayage services market report also includes key purchase criteria and drivers of price sensitivity to help companies evaluate and develop their market growth analysis strategies.
Customer Landscape of Drayage Services Industry
Competitive Landscape
Companies are implementing various strategies, such as strategic alliances, drayage services market forecast, partnerships, mergers and acquisitions, geographical expansion, and product/service launches, to enhance their presence in the industry.
Averitt Express Inc - Key offerings center on specialized intermodal drayage, port transportation, and integrated supply chain services designed to optimize short-haul logistics and enhance supply chain efficiency.
The industry research and growth report includes detailed analyses of the competitive landscape of the market and information about key companies, including:
- Averitt Express Inc
- Best Drayage Company LLC
- C H Robinson Worldwide Inc.
- ConGlobal Industries LLC
- ContainerPort Group Inc.
- Evans Delivery Co. Inc.
- F M International Inc
- Forward Air Corporation
- GEODIS
- Headwall Logistics LLC
- IMC Co. LLC
- InTek Freight and Logistics Inc
- JB Hunt Transport Services
- NFI Industries Inc.
- Old Dominion Freight Line
- RoadOne IntermodaLogistics Inc.
- RXO Inc.
- Schneider National Inc.
- Trinity Logistics Inc.
- United Drayage Co. Inc.
Qualitative and quantitative analysis of companies has been conducted to help clients understand the wider business environment as well as the strengths and weaknesses of key industry players. Data is qualitatively analyzed to categorize companies as pure play, category-focused, industry-focused, and diversified; it is quantitatively analyzed to categorize companies as dominant, leading, strong, tentative, and weak.
Recent Development and News in Drayage services market
- In February 2025, FedEx Logistics expanded the specialized drayage fleet of the organization to support the newly constructed regional distribution hubs that handle high-volume seasonal retail traffic.
- In April 2025, Oracle Cloud Infrastructure introduced a dedicated logistics module that utilizes predictive analytics to synchronize the arrivals of drayage trucks with crane operations at global maritime gateways.
- In May 2025, Flexport launched an integrated digital drayage platform that utilizes machine learning to provide instant freight quotes and real-time container status updates across a global network of independent short-haul carriers.
- In June 2025, DP World completed a major berth expansion at a primary international terminal which included dedicated lanes for high-capacity drayage vehicles to reduce the turnaround time for cargo movement.
Dive into Technavio’s robust research methodology, blending expert interviews, extensive data synthesis, and validated models for unparalleled Drayage Services Market insights. See full methodology.
| Market Scope | |
|---|---|
| Page number | 307 |
| Base year | 2025 |
| Historic period | 2020-2024 |
| Forecast period | 2026-2030 |
| Growth momentum & CAGR | Accelerate at a CAGR of 2.2% |
| Market growth 2026-2030 | USD 3188.6 million |
| Market structure | Fragmented |
| YoY growth 2025-2026(%) | 2.1% |
| Key countries | China, Japan, India, South Korea, Australia, Indonesia, US, Canada, Mexico, Germany, UK, France, Italy, The Netherlands, Spain, Saudi Arabia, UAE, South Africa, Turkey, Israel, Brazil, Argentina and Chile |
| Competitive landscape | Leading Companies, Market Positioning of Companies, Competitive Strategies, and Industry Risks |
Research Analyst Overview
- The drayage services market is pivotal to the global maritime supply chain. The journey begins with port drayage and pier drayage, moving containerized goods via container transport. This process relies on efficient intermodal drayage and strong intermodal connectivity to link with inland rail ramps through optimized rail-to-truck interfaces.
- Modern operations demand real-time visibility and supply chain transparency, facilitated by integrated terminal operating systems and digital marketplaces. The adoption of autonomous technologies and automated port orchestration aims to reduce port congestion and improve driver turn times. A major industry shift involves decarbonization, pushing for zero-emission fleets comprised of battery-electric vehicles and alternative-fuel vehicles.
- This transition requires significant investment in zero-emission equipment and specialized chassis for handling standard, oversized cargo, or even hazardous materials transport. Services have evolved to include trucking-based drayage for flexible door-to-door service, power-only services, shuttle drayage for empty container repositioning, and complex regional intermodal services.
- Achieving seamless interoperability through digital freight matching and improving the container turnaround process are key focus areas for this critical short-haul logistics sector, with successful implementation reducing processing times by over 20%.
What are the Key Data Covered in this Drayage Services Market Research and Growth Report?
-
What is the expected growth of the Drayage Services Market between 2026 and 2030?
-
USD 3.19 billion, at a CAGR of 2.2%
-
-
What segmentation does the market report cover?
-
The report is segmented by End-user (Electronics and electrical, Food and beverage, Consumer goods and retail, and Others), Type (Inter-carrier drayage, Expedited drayage, Intra-carrier drayage, Pier drayage, and Others), Mode of Transportation (Truck, Rail, and Ship) and Geography (APAC, North America, Europe, Middle East and Africa, South America)
-
-
Which regions are analyzed in the report?
-
APAC, North America, Europe, Middle East and Africa and South America
-
-
What are the key growth drivers and market challenges?
-
Proliferation of e-commerce and evolution of last-mile logistics integration, Persistence of labor shortages and workforce attrition in short-haul logistics
-
-
Who are the major players in the Drayage Services Market?
-
Averitt Express Inc, Best Drayage Company LLC, C H Robinson Worldwide Inc., ConGlobal Industries LLC, ContainerPort Group Inc., Evans Delivery Co. Inc., F M International Inc, Forward Air Corporation, GEODIS, Headwall Logistics LLC, IMC Co. LLC, InTek Freight and Logistics Inc, JB Hunt Transport Services, NFI Industries Inc., Old Dominion Freight Line, RoadOne IntermodaLogistics Inc., RXO Inc., Schneider National Inc., Trinity Logistics Inc. and United Drayage Co. Inc.
-
Market Research Insights
- The drayage services market is evolving through the strategic adoption of integrated logistics solutions and sophisticated freight management. Providers are focusing on enhancing supply chain services to offer seamless warehouse transportation and port to door logistics, which has improved container hauling efficiency by over 18%.
- The integration of intermodal logistics services with digital platforms allows for better coordination of time-sensitive freight and contract logistics. This shift toward managed transportation and global freight forwarding capabilities enables a reduction in empty miles by up to 12%, optimizing asset utilization.
- As a result, the market is moving beyond basic short-haul transportation, creating more resilient and transparent supply chains for global clients.
We can help! Our analysts can customize this drayage services market research report to meet your requirements.
 RIA -
RIA - 
