E-gates Market Analysis, Size, and Forecast 2026-2030: Europe (Germany, UK, and France), North America (US, Canada, and Mexico), APAC (China, Japan, and India), Middle East and Africa (Saudi Arabia, UAE, and South Africa), South America (Brazil and Argentina), and Rest of World (ROW)

E-gates Market Analysis, Size, and Forecast 2026-2030:
Europe (Germany, UK, and France), North America (US, Canada, and Mexico), APAC (China, Japan, and India), Middle East and Africa (Saudi Arabia, UAE, and South Africa), South America (Brazil and Argentina), and Rest of World (ROW)

Published: Dec 2025 290 Pages SKU: IRTNTR74211

Market Overview at a Glance

$13.18 B
Market Opportunity
40.6%
CAGR 2025 - 2030
38.5%
Europe Growth
$1.66 B
Hardware segment 2024

E-gates Market Size 2026-2030

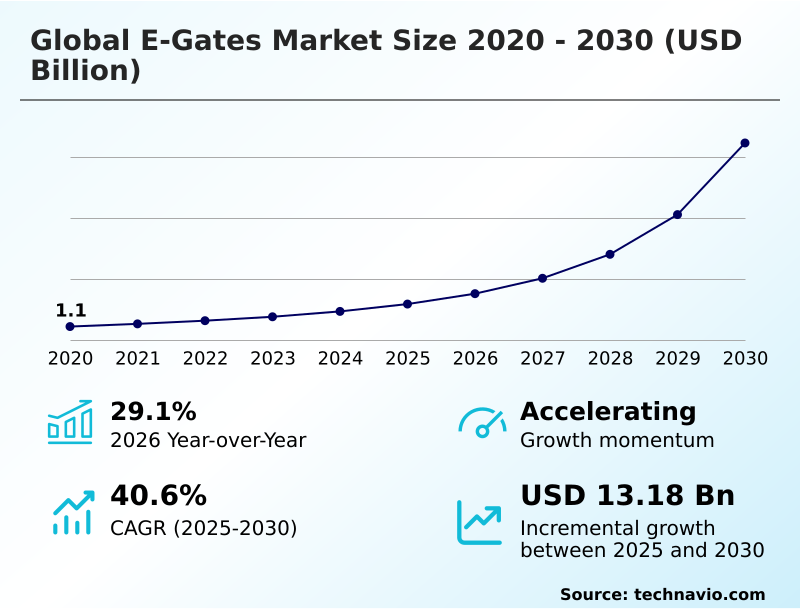
The e-gates market size is valued to increase by USD 13.18 billion, at a CAGR of 40.6% from 2025 to 2030. Reduced airport operating expenses will drive the e-gates market.

Major Market Trends & Insights

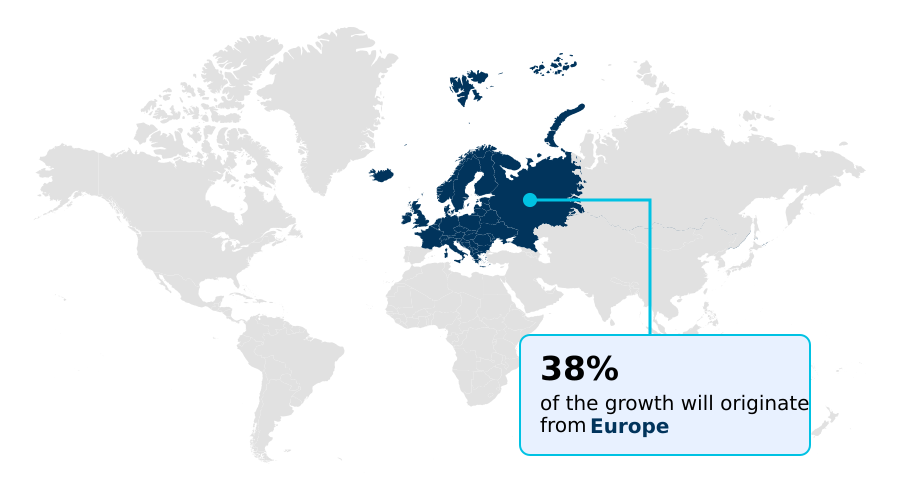
  • Europe dominated the market and accounted for a 38.5% growth during the forecast period.
  • By Type - Hardware segment was valued at USD 1.66 billion in 2024
  • By Application - Airport segment accounted for the largest market revenue share in 2024

Market Size & Forecast

  • Market Opportunities: USD 15.02 billion
  • Market Future Opportunities: USD 13.18 billion
  • CAGR from 2025 to 2030 : 40.6%

Market Summary

  • The e-gates market is rapidly transforming border security and passenger management by leveraging automated immigration systems to enhance both efficiency and safety. At its core, the industry is driven by the need to reduce airport operational expenses and accelerate passenger processing times, replacing time-consuming manual checks with sophisticated biometric verification technologies.
  • A significant trend is the increasing reliance on facial recognition technology, iris recognition, and fingerprint scanning to create a seamless passenger journey. For instance, a major international airport operator can deploy an end-to-end biometric identity management system, allowing travelers to use their biometrics as a biometric single token from check-in to boarding.
  • This not only streamlines passenger flow management but also enables security personnel to be reallocated from routine identity verification to higher-value threat analysis and passenger screening. However, the market is not without challenges; ensuring the security of biometric data management and overcoming interoperability issues between disparate hardware and software components remain critical hurdles for sustained growth.

What will be the Size of the E-gates Market during the forecast period?

Get Key Insights on Market Forecast (PDF) Request Free Sample

How is the E-gates Market Segmented?

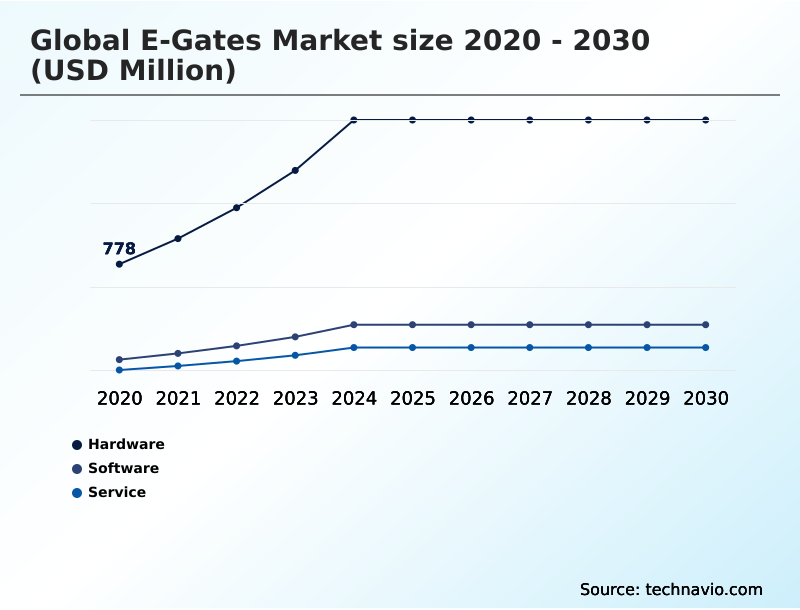
The e-gates industry research report provides comprehensive data (region-wise segment analysis), with forecasts and estimates in "USD million" for the period 2026-2030, as well as historical data from 2020-2024 for the following segments.

  • Type
    • Hardware
    • Software
    • Service
  • Application
    • Airport
    • Government
  • Product type
    • Automated e-gates
    • Traditional e-gates
  • Geography
    • Europe
      • Germany
      • UK
      • France
    • North America
      • US
      • Canada
      • Mexico
    • APAC
      • China
      • Japan
      • India
    • Middle East and Africa
      • Saudi Arabia
      • UAE
      • South Africa
    • South America
      • Brazil
      • Argentina
    • Rest of World (ROW)

By Type Insights

The hardware segment is estimated to witness significant growth during the forecast period.

The hardware segment is foundational to the Global E-Gates Market 2026-2030, encompassing the physical components that enable automated passenger processing.

This includes biometric hardware such as cameras for facial recognition technology, specialized scanners for fingerprint scanning and iris recognition, and the automated gate systems themselves.

Reliability is paramount, as this equipment must function flawlessly to support passenger flow management and queue management systems.

The high cost of these durable components, which use radio-frequency identification and must be resistant to security breaches, is justified by performance gains.

Advanced hardware, a key part of traveler identity management, improves identity verification accuracy by over 99.5%, forming the backbone of secure and efficient automated border crossing infrastructure worldwide.

Request Free Sample

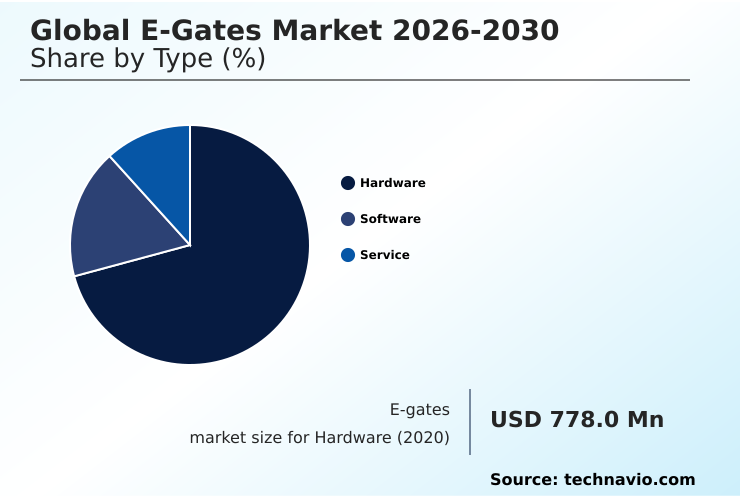
The Hardware segment was valued at USD 1.66 billion in 2024 and showed a gradual increase during the forecast period.

Request Free Sample

Regional Analysis

Europe is estimated to contribute 38.5% to the growth of the global market during the forecast period.Technavio’s analysts have elaborately explained the regional trends and drivers that shape the market during the forecast period.

See How E-gates Market Demand is Rising in Europe Request Free Sample

The geographic landscape is characterized by diverse adoption rates, with Europe leading in incremental growth, contributing 38.5% of the market's expansion.

This is driven by large-scale initiatives like the EU's Entry/Exit System, which mandates biometric entry-exit systems and the adoption of the digital travel credential. In contrast, the APAC region is notable for its rapid technological modernization.

For instance, Singapore's passport-less clearance system, a pinnacle of self-service border control, has reduced processing times by approximately 40%.

These regional deployments showcase the global move from physical document checks to fully digital identity assurance platforms and liveness detection technologies, setting new standards for international travel and security.

Market Dynamics

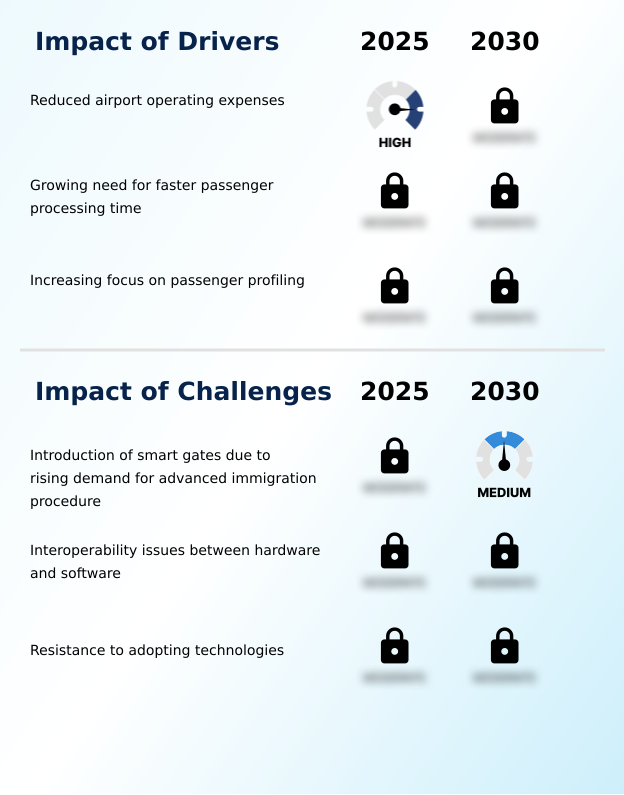
Our researchers analyzed the data with 2025 as the base year, along with the key drivers, trends, and challenges. A holistic analysis of drivers will help companies refine their marketing strategies to gain a competitive advantage.

  • The successful implementation of e-gate systems extends beyond hardware installation, demanding a strategic approach to technology integration and operational design. A critical factor is the cost-benefit analysis of airport e-gates, where the initial ROI of automated gate installation must be weighed against long-term maintenance and upgrade costs.
  • For instance, a key consideration is the comparison of facial recognition vs iris scanning accuracy, as the chosen modality affects both user experience and security robustness. A major operational hurdle involves the challenges in upgrading legacy e-gate systems to be compatible with new interoperability standards and security protocols.
  • Moreover, the integration of biometrics with security databases is a complex task, requiring seamless data exchange to prevent vulnerabilities in automated border control. The ultimate goal is to achieve biometric single token travel implementation, where a passenger's identity is verified once and then used across all airport touchpoints.
  • This approach has a significant impact of e-gates on passenger flow, with airports deploying such systems reporting operational staff reallocations that are three times more effective than those relying on manual checks alone. Navigating e-gate compliance with data privacy regulations and understanding the future of biometric border management are crucial for long-term success and preventing spoofing attacks on e-gates.

What are the key market drivers leading to the rise in the adoption of E-gates Industry?

  • The reduction of airport operating expenses is a key driver for the market's growth.

  • The primary driver for market expansion is the compelling financial and operational case for automated border control.
  • The deployment of automated gate systems delivers substantial cost savings, with analyses showing that a single e-gate can supplant the need for up to six manual inspection officers.
  • This allows for strategic reallocation of personnel to more complex security tasks, optimizing workforce efficiency. For passengers, this translates to faster passenger processing and shorter queues, a key component of biometric-enabled self-service.
  • The passport control automation offered by these systems increases passenger throughput by over 25% during peak hours, directly improving airport operational capacity and traveler satisfaction through enhanced biometric single token travel.

What are the market trends shaping the E-gates Industry?

  • The growing demand for cost-efficient security solutions is emerging as a significant market trend. This is driven by the need to optimize security personnel allocation while enhancing passenger screening protocols.

  • A key trend shaping the market is the pivot towards a completely contactless passenger journey, driven by demand for both hygiene and efficiency. The adoption of advanced facial recognition technology is central to this shift, with new systems performing identity verification in under two seconds. This enhances the seamless passenger journey and aligns with smart airport solutions.
  • This evolution is not just about speed; it is about integration. Leading airports are now connecting e-gates with passenger profiling algorithms and broader security platforms, creating a unified security network. This integrated approach has proven to improve real-time threat detection capabilities by more than 20% compared to siloed legacy systems, establishing a new benchmark for border security technology.

What challenges does the E-gates Industry face during its growth?

  • The introduction of smart gates, driven by the rising demand for advanced immigration procedures, presents a key challenge to the industry's growth.

  • Despite strong growth drivers, the market faces significant challenges, primarily interoperability standards between hardware and software. A lack of cohesion between different vendors' biometric middleware and biometric software can lead to system failures, reducing processing efficiency by up to 20% during outages. Furthermore, ensuring robust biometric data security is a persistent hurdle.
  • A single data breach could erode public trust in automated identity verification and the biometric data management processes. The emergence of next-generation smart gates, which promise even faster processing, also poses a competitive threat, while cultural resistance to technology replacing human interaction hinders adoption in certain key markets.

Exclusive Technavio Analysis on Customer Landscape

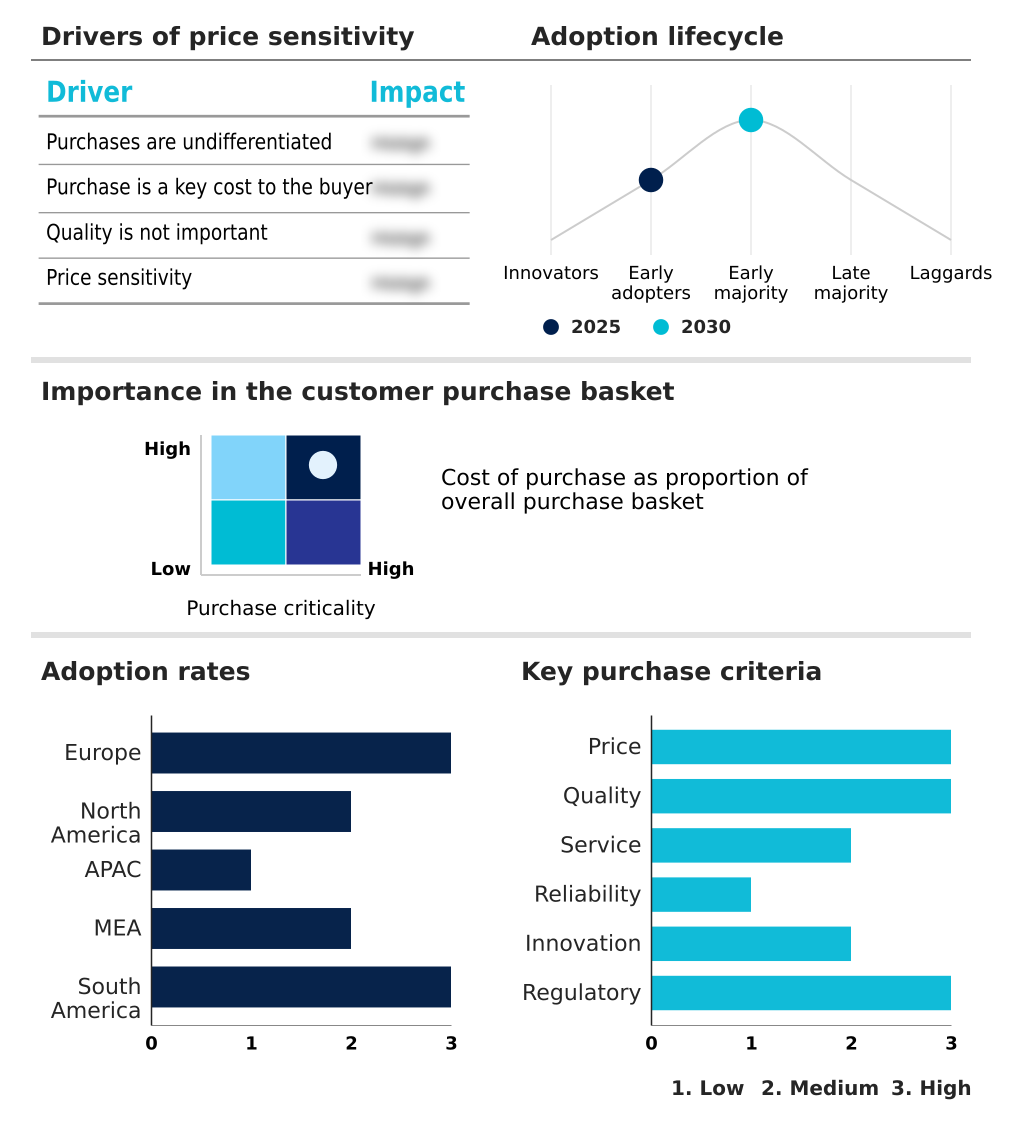
The e-gates market forecasting report includes the adoption lifecycle of the market, covering from the innovator’s stage to the laggard’s stage. It focuses on adoption rates in different regions based on penetration. Furthermore, the e-gates market report also includes key purchase criteria and drivers of price sensitivity to help companies evaluate and develop their market growth analysis strategies.

Customer Landscape of E-gates Industry

Competitive Landscape

Companies are implementing various strategies, such as strategic alliances, e-gates market forecast, partnerships, mergers and acquisitions, geographical expansion, and product/service launches, to enhance their presence in the industry.

Amadeus IT Group SA - Offering automated passenger handling solutions that integrate advanced e-gate technology to streamline airport operations and enhance traveler throughput.

The industry research and growth report includes detailed analyses of the competitive landscape of the market and information about key companies, including:

  • Amadeus IT Group SA
  • Atos SE
  • Cognitec Systems GmbH
  • COMINFO a.s
  • DERMALOG Systems GmbH
  • E Gates Technologies Pvt. Ltd.
  • Giesecke Devrient GmbH
  • Gunnebo AB
  • IDEMIA France SAS
  • IN Groupe
  • Indra Sistemas SA
  • Magnetic Autocontrol GmbH
  • NEC Corp.
  • RTX Corp.
  • secunet Security Networks AG
  • SITA
  • Thales Group
  • Wanzl GmbH and Co. KGaA

Qualitative and quantitative analysis of companies has been conducted to help clients understand the wider business environment as well as the strengths and weaknesses of key industry players. Data is qualitatively analyzed to categorize companies as pure play, category-focused, industry-focused, and diversified; it is quantitatively analyzed to categorize companies as dominant, leading, strong, tentative, and weak.

Recent Development and News in E-gates market

  • In December 2024, Thales deployed new biometric e-gates featuring advanced facial and fingerprint recognition at the Ceuta and Melilla land borders in Spain to manage high-volume crossings.
  • In December 2024, IDEMIA Public Security secured a ten-year contract extension with the Australian Department of Home Affairs to support and upgrade smart gates across eight international airports.
  • In November 2024, Vision-Box, an Amadeus company, announced the successful deployment of its Seamless Border Programme at Princess Juliana International Airport in Sint Maarten, featuring a new generation of biometric gates.
  • In March 2025, NEC Corp. was awarded a major contract by the Immigration Services Agency of Japan to install new facial recognition walkthrough gates at Haneda, Kansai, and Narita airports.

Dive into Technavio’s robust research methodology, blending expert interviews, extensive data synthesis, and validated models for unparalleled E-gates Market insights. See full methodology.

Market Scope
Page number 290
Base year 2025
Historic period 2020-2024
Forecast period 2026-2030
Growth momentum & CAGR Accelerate at a CAGR of 40.6%
Market growth 2026-2030 USD 13180.4 million
Market structure Fragmented
YoY growth 2025-2026(%) 29.1%
Key countries Germany, UK, France, Italy, Spain, The Netherlands, US, Canada, Mexico, China, Japan, India, South Korea, Australia, Indonesia, Saudi Arabia, UAE, South Africa, Israel, Turkey, Brazil, Argentina and Chile
Competitive landscape Leading Companies, Market Positioning of Companies, Competitive Strategies, and Industry Risks

Request Free Sample

Research Analyst Overview

  • The Global E-Gates Market 2026-2030 is maturing beyond standalone automated gate systems into deeply integrated biometric identity management ecosystems. The core technology, once focused on simple biometric passport scans using a machine readable zone, now centers on multi-modal biometric verification, including advanced facial recognition technology and liveness detection to prevent fraud.
  • This evolution presents a critical boardroom decision: investing heavily in next-generation border security technology to create a seamless passenger journey versus managing the significant costs and compliance risks associated with biometric data management and privacy regulations. The business case is compelling, as modern deployments have demonstrated a 30% reduction in passenger processing times.
  • As airports and governments prioritize both security and traveler experience, the strategic adoption of these automated immigration systems for comprehensive passenger screening and identity verification is becoming a competitive necessity rather than an optional upgrade.

What are the Key Data Covered in this E-gates Market Research and Growth Report?

  • What is the expected growth of the E-gates Market between 2026 and 2030?

    • USD 13.18 billion, at a CAGR of 40.6%

  • What segmentation does the market report cover?

    • The report is segmented by Type (Hardware, Software, and Service), Application (Airport, and Government), Product Type (Automated e-gates, and Traditional e-gates) and Geography (Europe, North America, APAC, Middle East and Africa, South America)

  • Which regions are analyzed in the report?

    • Europe, North America, APAC, Middle East and Africa and South America

  • What are the key growth drivers and market challenges?

    • Reduced airport operating expenses, Introduction of smart gates due to rising demand for advanced immigration procedure

  • Who are the major players in the E-gates Market?

    • Amadeus IT Group SA, Atos SE, Cognitec Systems GmbH, COMINFO a.s, DERMALOG Systems GmbH, E Gates Technologies Pvt. Ltd., Giesecke Devrient GmbH, Gunnebo AB, IDEMIA France SAS, IN Groupe, Indra Sistemas SA, Magnetic Autocontrol GmbH, NEC Corp., RTX Corp., secunet Security Networks AG, SITA, Thales Group and Wanzl GmbH and Co. KGaA

Market Research Insights

  • The market's dynamics are dictated by a convergence of technological innovation and pressing operational demands. The shift toward a frictionless border control experience is accelerating, with automated identity verification adoption rates increasing by over 30% in key airports. This is enabled by biometric-enabled self-service platforms that create a contactless passenger journey.
  • These smart airport solutions do more than just speed up lines; they enhance security, with some systems demonstrating a 15% improvement in anomaly detection over manual processes. As traveler identity management evolves with the digital travel credential, the focus is on creating interoperable identity assurance platforms that provide a single, secure token for the entire travel process.

We can help! Our analysts can customize this e-gates market research report to meet your requirements.

Get in touch

1. Executive Summary

1.1 Market overview

Executive Summary - Chart on Market Overview
Executive Summary - Data Table on Market Overview
Executive Summary - Chart on Global Market Characteristics
Executive Summary - Chart on Market by Geography
Executive Summary - Chart on Market Segmentation by Type
Executive Summary - Chart on Market Segmentation by Application
Executive Summary - Chart on Market Segmentation by Product Type
Executive Summary - Chart on Incremental Growth
Executive Summary - Data Table on Incremental Growth
Executive Summary - Chart on Company Market Positioning

2. Technavio Analysis

2.1 Analysis of price sensitivity, lifecycle, customer purchase basket, adoption rates, and purchase criteria

2.2 Criticality of inputs and Factors of differentiation

Chart on Overview on criticality of inputs and factors of differentiation

2.3 Factors of disruption

Chart on Overview on factors of disruption

2.4 Impact of drivers and challenges

Chart on Impact of drivers and challenges in 2025 and 2030

3. Market Landscape

3.1 Market ecosystem

Chart on Parent Market
Data Table on - Parent Market

3.2 Market characteristics

Chart on Market characteristics analysis

3.3 Value chain analysis

Chart on Value chain analysis

4. Market Sizing

4.1 Market definition

Data Table on Offerings of companies included in the market definition

4.2 Market segment analysis

Market segments

4.3 Market size 2025

4.4 Market outlook: Forecast for 2025-2030

Chart on Global - Market size and forecast 2025-2030 ($ million)
Data Table on Global - Market size and forecast 2025-2030 ($ million)
Chart on Global Market: Year-over-year growth 2025-2030 (%)
Data Table on Global Market: Year-over-year growth 2025-2030 (%)

5. Historic Market Size

5.1 Global E-Gates Market 2020 - 2024

Historic Market Size - Data Table on Global E-Gates Market 2020 - 2024 ($ million)

5.2 Type segment analysis 2020 - 2024

Historic Market Size - Type Segment 2020 - 2024 ($ million)

5.3 Application segment analysis 2020 - 2024

Historic Market Size - Application Segment 2020 - 2024 ($ million)

5.4 Product Type segment analysis 2020 - 2024

Historic Market Size - Product Type Segment 2020 - 2024 ($ million)

5.5 Geography segment analysis 2020 - 2024

Historic Market Size - Geography Segment 2020 - 2024 ($ million)

5.6 Country segment analysis 2020 - 2024

Historic Market Size - Country Segment 2020 - 2024 ($ million)

6. Qualitative Analysis

6.1 The AI impact on Global E-gates Market

7. Five Forces Analysis

7.1 Five forces summary

Five forces analysis - Comparison between 2025 and 2030

7.2 Bargaining power of buyers

Bargaining power of buyers - Impact of key factors 2025 and 2030

7.3 Bargaining power of suppliers

Bargaining power of suppliers - Impact of key factors in 2025 and 2030

7.4 Threat of new entrants

Threat of new entrants - Impact of key factors in 2025 and 2030

7.5 Threat of substitutes

Threat of substitutes - Impact of key factors in 2025 and 2030

7.6 Threat of rivalry

Threat of rivalry - Impact of key factors in 2025 and 2030

7.7 Market condition

Chart on Market condition - Five forces 2025 and 2030

8. Market Segmentation by Type

8.1 Market segments

Chart on Type - Market share 2025-2030 (%)
Data Table on Type - Market share 2025-2030 (%)

8.2 Comparison by Type

Chart on Comparison by Type
Data Table on Comparison by Type

8.3 Hardware - Market size and forecast 2025-2030

Chart on Hardware - Market size and forecast 2025-2030 ($ million)
Data Table on Hardware - Market size and forecast 2025-2030 ($ million)
Chart on Hardware - Year-over-year growth 2025-2030 (%)
Data Table on Hardware - Year-over-year growth 2025-2030 (%)

8.4 Software - Market size and forecast 2025-2030

Chart on Software - Market size and forecast 2025-2030 ($ million)
Data Table on Software - Market size and forecast 2025-2030 ($ million)
Chart on Software - Year-over-year growth 2025-2030 (%)
Data Table on Software - Year-over-year growth 2025-2030 (%)

8.5 Service - Market size and forecast 2025-2030

Chart on Service - Market size and forecast 2025-2030 ($ million)
Data Table on Service - Market size and forecast 2025-2030 ($ million)
Chart on Service - Year-over-year growth 2025-2030 (%)
Data Table on Service - Year-over-year growth 2025-2030 (%)

8.6 Market opportunity by Type

Market opportunity by Type ($ million)
Data Table on Market opportunity by Type ($ million)

9. Market Segmentation by Application

9.1 Market segments

Chart on Application - Market share 2025-2030 (%)
Data Table on Application - Market share 2025-2030 (%)

9.2 Comparison by Application

Chart on Comparison by Application
Data Table on Comparison by Application

9.3 Airport - Market size and forecast 2025-2030

Chart on Airport - Market size and forecast 2025-2030 ($ million)
Data Table on Airport - Market size and forecast 2025-2030 ($ million)
Chart on Airport - Year-over-year growth 2025-2030 (%)
Data Table on Airport - Year-over-year growth 2025-2030 (%)

9.4 Government - Market size and forecast 2025-2030

Chart on Government - Market size and forecast 2025-2030 ($ million)
Data Table on Government - Market size and forecast 2025-2030 ($ million)
Chart on Government - Year-over-year growth 2025-2030 (%)
Data Table on Government - Year-over-year growth 2025-2030 (%)

9.5 Market opportunity by Application

Market opportunity by Application ($ million)
Data Table on Market opportunity by Application ($ million)

10. Market Segmentation by Product Type

10.1 Market segments

Chart on Product Type - Market share 2025-2030 (%)
Data Table on Product Type - Market share 2025-2030 (%)

10.2 Comparison by Product Type

Chart on Comparison by Product Type
Data Table on Comparison by Product Type

10.3 Automated e-gates - Market size and forecast 2025-2030

Chart on Automated e-gates - Market size and forecast 2025-2030 ($ million)
Data Table on Automated e-gates - Market size and forecast 2025-2030 ($ million)
Chart on Automated e-gates - Year-over-year growth 2025-2030 (%)
Data Table on Automated e-gates - Year-over-year growth 2025-2030 (%)

10.4 Traditional e-gates - Market size and forecast 2025-2030

Chart on Traditional e-gates - Market size and forecast 2025-2030 ($ million)
Data Table on Traditional e-gates - Market size and forecast 2025-2030 ($ million)
Chart on Traditional e-gates - Year-over-year growth 2025-2030 (%)
Data Table on Traditional e-gates - Year-over-year growth 2025-2030 (%)

10.5 Market opportunity by Product Type

Market opportunity by Product Type ($ million)
Data Table on Market opportunity by Product Type ($ million)

11. Customer Landscape

11.1 Customer landscape overview

Analysis of price sensitivity, lifecycle, customer purchase basket, adoption rates, and purchase criteria

12. Geographic Landscape

12.1 Geographic segmentation

Chart on Market share by geography 2025-2030 (%)
Data Table on Market share by geography 2025-2030 (%)

12.2 Geographic comparison

Chart on Geographic comparison
Data Table on Geographic comparison

12.3 Europe - Market size and forecast 2025-2030

Chart on Europe - Market size and forecast 2025-2030 ($ million)
Data Table on Europe - Market size and forecast 2025-2030 ($ million)
Chart on Europe - Year-over-year growth 2025-2030 (%)
Data Table on Europe - Year-over-year growth 2025-2030 (%)
Chart on Regional Comparison - Europe
Data Table on Regional Comparison - Europe

12.3.1 Germany - Market size and forecast 2025-2030

Chart on Germany - Market size and forecast 2025-2030 ($ million)
Data Table on Germany - Market size and forecast 2025-2030 ($ million)
Chart on Germany - Year-over-year growth 2025-2030 (%)
Data Table on Germany - Year-over-year growth 2025-2030 (%)

12.3.2 UK - Market size and forecast 2025-2030

Chart on UK - Market size and forecast 2025-2030 ($ million)
Data Table on UK - Market size and forecast 2025-2030 ($ million)
Chart on UK - Year-over-year growth 2025-2030 (%)
Data Table on UK - Year-over-year growth 2025-2030 (%)

12.3.3 France - Market size and forecast 2025-2030

Chart on France - Market size and forecast 2025-2030 ($ million)
Data Table on France - Market size and forecast 2025-2030 ($ million)
Chart on France - Year-over-year growth 2025-2030 (%)
Data Table on France - Year-over-year growth 2025-2030 (%)

12.3.4 Italy - Market size and forecast 2025-2030

Chart on Italy - Market size and forecast 2025-2030 ($ million)
Data Table on Italy - Market size and forecast 2025-2030 ($ million)
Chart on Italy - Year-over-year growth 2025-2030 (%)
Data Table on Italy - Year-over-year growth 2025-2030 (%)

12.3.5 Spain - Market size and forecast 2025-2030

Chart on Spain - Market size and forecast 2025-2030 ($ million)
Data Table on Spain - Market size and forecast 2025-2030 ($ million)
Chart on Spain - Year-over-year growth 2025-2030 (%)
Data Table on Spain - Year-over-year growth 2025-2030 (%)

12.3.6 The Netherlands - Market size and forecast 2025-2030

Chart on The Netherlands - Market size and forecast 2025-2030 ($ million)
Data Table on The Netherlands - Market size and forecast 2025-2030 ($ million)
Chart on The Netherlands - Year-over-year growth 2025-2030 (%)
Data Table on The Netherlands - Year-over-year growth 2025-2030 (%)

12.4 North America - Market size and forecast 2025-2030

Chart on North America - Market size and forecast 2025-2030 ($ million)
Data Table on North America - Market size and forecast 2025-2030 ($ million)
Chart on North America - Year-over-year growth 2025-2030 (%)
Data Table on North America - Year-over-year growth 2025-2030 (%)
Chart on Regional Comparison - North America
Data Table on Regional Comparison - North America

12.4.1 US - Market size and forecast 2025-2030

Chart on US - Market size and forecast 2025-2030 ($ million)
Data Table on US - Market size and forecast 2025-2030 ($ million)
Chart on US - Year-over-year growth 2025-2030 (%)
Data Table on US - Year-over-year growth 2025-2030 (%)

12.4.2 Canada - Market size and forecast 2025-2030

Chart on Canada - Market size and forecast 2025-2030 ($ million)
Data Table on Canada - Market size and forecast 2025-2030 ($ million)
Chart on Canada - Year-over-year growth 2025-2030 (%)
Data Table on Canada - Year-over-year growth 2025-2030 (%)

12.4.3 Mexico - Market size and forecast 2025-2030

Chart on Mexico - Market size and forecast 2025-2030 ($ million)
Data Table on Mexico - Market size and forecast 2025-2030 ($ million)
Chart on Mexico - Year-over-year growth 2025-2030 (%)
Data Table on Mexico - Year-over-year growth 2025-2030 (%)

12.5 APAC - Market size and forecast 2025-2030

Chart on APAC - Market size and forecast 2025-2030 ($ million)
Data Table on APAC - Market size and forecast 2025-2030 ($ million)
Chart on APAC - Year-over-year growth 2025-2030 (%)
Data Table on APAC - Year-over-year growth 2025-2030 (%)
Chart on Regional Comparison - APAC
Data Table on Regional Comparison - APAC

12.5.1 China - Market size and forecast 2025-2030

Chart on China - Market size and forecast 2025-2030 ($ million)
Data Table on China - Market size and forecast 2025-2030 ($ million)
Chart on China - Year-over-year growth 2025-2030 (%)
Data Table on China - Year-over-year growth 2025-2030 (%)

12.5.2 Japan - Market size and forecast 2025-2030

Chart on Japan - Market size and forecast 2025-2030 ($ million)
Data Table on Japan - Market size and forecast 2025-2030 ($ million)
Chart on Japan - Year-over-year growth 2025-2030 (%)
Data Table on Japan - Year-over-year growth 2025-2030 (%)

12.5.3 India - Market size and forecast 2025-2030

Chart on India - Market size and forecast 2025-2030 ($ million)
Data Table on India - Market size and forecast 2025-2030 ($ million)
Chart on India - Year-over-year growth 2025-2030 (%)
Data Table on India - Year-over-year growth 2025-2030 (%)

12.5.4 South Korea - Market size and forecast 2025-2030

Chart on South Korea - Market size and forecast 2025-2030 ($ million)
Data Table on South Korea - Market size and forecast 2025-2030 ($ million)
Chart on South Korea - Year-over-year growth 2025-2030 (%)
Data Table on South Korea - Year-over-year growth 2025-2030 (%)

12.5.5 Australia - Market size and forecast 2025-2030

Chart on Australia - Market size and forecast 2025-2030 ($ million)
Data Table on Australia - Market size and forecast 2025-2030 ($ million)
Chart on Australia - Year-over-year growth 2025-2030 (%)
Data Table on Australia - Year-over-year growth 2025-2030 (%)

12.5.6 Indonesia - Market size and forecast 2025-2030

Chart on Indonesia - Market size and forecast 2025-2030 ($ million)
Data Table on Indonesia - Market size and forecast 2025-2030 ($ million)
Chart on Indonesia - Year-over-year growth 2025-2030 (%)
Data Table on Indonesia - Year-over-year growth 2025-2030 (%)

12.6 Middle East and Africa - Market size and forecast 2025-2030

Chart on Middle East and Africa - Market size and forecast 2025-2030 ($ million)
Data Table on Middle East and Africa - Market size and forecast 2025-2030 ($ million)
Chart on Middle East and Africa - Year-over-year growth 2025-2030 (%)
Data Table on Middle East and Africa - Year-over-year growth 2025-2030 (%)
Chart on Regional Comparison - Middle East and Africa
Data Table on Regional Comparison - Middle East and Africa

12.6.1 Saudi Arabia - Market size and forecast 2025-2030

Chart on Saudi Arabia - Market size and forecast 2025-2030 ($ million)
Data Table on Saudi Arabia - Market size and forecast 2025-2030 ($ million)
Chart on Saudi Arabia - Year-over-year growth 2025-2030 (%)
Data Table on Saudi Arabia - Year-over-year growth 2025-2030 (%)

12.6.2 UAE - Market size and forecast 2025-2030

Chart on UAE - Market size and forecast 2025-2030 ($ million)
Data Table on UAE - Market size and forecast 2025-2030 ($ million)
Chart on UAE - Year-over-year growth 2025-2030 (%)
Data Table on UAE - Year-over-year growth 2025-2030 (%)

12.6.3 South Africa - Market size and forecast 2025-2030

Chart on South Africa - Market size and forecast 2025-2030 ($ million)
Data Table on South Africa - Market size and forecast 2025-2030 ($ million)
Chart on South Africa - Year-over-year growth 2025-2030 (%)
Data Table on South Africa - Year-over-year growth 2025-2030 (%)

12.6.4 Israel - Market size and forecast 2025-2030

Chart on Israel - Market size and forecast 2025-2030 ($ million)
Data Table on Israel - Market size and forecast 2025-2030 ($ million)
Chart on Israel - Year-over-year growth 2025-2030 (%)
Data Table on Israel - Year-over-year growth 2025-2030 (%)

12.6.5 Turkey - Market size and forecast 2025-2030

Chart on Turkey - Market size and forecast 2025-2030 ($ million)
Data Table on Turkey - Market size and forecast 2025-2030 ($ million)
Chart on Turkey - Year-over-year growth 2025-2030 (%)
Data Table on Turkey - Year-over-year growth 2025-2030 (%)

12.7 South America - Market size and forecast 2025-2030

Chart on South America - Market size and forecast 2025-2030 ($ million)
Data Table on South America - Market size and forecast 2025-2030 ($ million)
Chart on South America - Year-over-year growth 2025-2030 (%)
Data Table on South America - Year-over-year growth 2025-2030 (%)
Chart on Regional Comparison - South America
Data Table on Regional Comparison - South America

12.7.1 Brazil - Market size and forecast 2025-2030

Chart on Brazil - Market size and forecast 2025-2030 ($ million)
Data Table on Brazil - Market size and forecast 2025-2030 ($ million)
Chart on Brazil - Year-over-year growth 2025-2030 (%)
Data Table on Brazil - Year-over-year growth 2025-2030 (%)

12.7.2 Argentina - Market size and forecast 2025-2030

Chart on Argentina - Market size and forecast 2025-2030 ($ million)
Data Table on Argentina - Market size and forecast 2025-2030 ($ million)
Chart on Argentina - Year-over-year growth 2025-2030 (%)
Data Table on Argentina - Year-over-year growth 2025-2030 (%)

12.7.3 Chile - Market size and forecast 2025-2030

Chart on Chile - Market size and forecast 2025-2030 ($ million)
Data Table on Chile - Market size and forecast 2025-2030 ($ million)
Chart on Chile - Year-over-year growth 2025-2030 (%)
Data Table on Chile - Year-over-year growth 2025-2030 (%)

12.8 Market opportunity by geography

Market opportunity by geography ($ million)
Data Tables on Market opportunity by geography ($ million)

13. Drivers, Challenges, and Opportunity

13.1 Market drivers

Reduced airport operating expenses
Growing need for faster passenger processing time
Increasing focus on passenger profiling

13.2 Market challenges

Introduction of smart gates due to rising demand for advanced immigration procedure
Interoperability issues between hardware and software
Resistance to adopting technologies

13.3 Impact of drivers and challenges

Impact of drivers and challenges in 2025 and 2030

13.4 Market opportunities

Growing demand for cost-efficient security solutions
Increasing need for on-time accuracy of aircraft
Growing demand for facial recognition border control gates

14. Competitive Landscape

14.1 Overview

14.2

Overview on criticality of inputs and factors of differentiation

14.3 Landscape disruption

Overview on factors of disruption

14.4 Industry risks

Impact of key risks on business

15. Competitive Analysis

15.1 Companies profiled

Companies covered

15.2 Company ranking index

15.3 Market positioning of companies

Matrix on companies position and classification

15.4 Amadeus IT Group SA

Amadeus IT Group SA - Overview
Amadeus IT Group SA - Business segments
Amadeus IT Group SA - Key offerings
Amadeus IT Group SA - Segment focus
SWOT

15.5 Atos SE

Atos SE - Overview
Atos SE - Business segments
Atos SE - Key news
Atos SE - Key offerings
Atos SE - Segment focus
SWOT

15.6 Cognitec Systems GmbH

Cognitec Systems GmbH - Overview
Cognitec Systems GmbH - Product / Service
Cognitec Systems GmbH - Key offerings
SWOT

15.7 DERMALOG Systems GmbH

DERMALOG Systems GmbH - Overview
DERMALOG Systems GmbH - Product / Service
DERMALOG Systems GmbH - Key offerings
SWOT

15.8 Giesecke Devrient GmbH

Giesecke Devrient GmbH - Overview
Giesecke Devrient GmbH - Product / Service
Giesecke Devrient GmbH - Key news
Giesecke Devrient GmbH - Key offerings
SWOT

15.9 Gunnebo AB

Gunnebo AB - Overview
Gunnebo AB - Product / Service
Gunnebo AB - Key offerings
SWOT

15.10 IDEMIA France SAS

IDEMIA France SAS - Overview
IDEMIA France SAS - Product / Service
IDEMIA France SAS - Key news
IDEMIA France SAS - Key offerings
SWOT

15.11 IN Groupe

IN Groupe - Overview
IN Groupe - Product / Service
IN Groupe - Key offerings
SWOT

15.12 Indra Sistemas SA

Indra Sistemas SA - Overview
Indra Sistemas SA - Business segments
Indra Sistemas SA - Key news
Indra Sistemas SA - Key offerings
Indra Sistemas SA - Segment focus
SWOT

15.13 NEC Corp.

NEC Corp. - Overview
NEC Corp. - Business segments
NEC Corp. - Key news
NEC Corp. - Key offerings
NEC Corp. - Segment focus
SWOT

15.14 RTX Corp.

RTX Corp. - Overview
RTX Corp. - Business segments
RTX Corp. - Key news
RTX Corp. - Key offerings
RTX Corp. - Segment focus
SWOT

15.15 secunet Security Networks AG

secunet Security Networks AG - Overview
secunet Security Networks AG - Business segments
secunet Security Networks AG - Key offerings
secunet Security Networks AG - Segment focus
SWOT

15.16 SITA

SITA - Overview
SITA - Product / Service
SITA - Key offerings
SWOT

15.17 Thales Group

Thales Group - Overview
Thales Group - Business segments
Thales Group - Key news
Thales Group - Key offerings
Thales Group - Segment focus
SWOT

15.18 Wanzl GmbH and Co. KGaA

Wanzl GmbH and Co. KGaA - Overview
Wanzl GmbH and Co. KGaA - Product / Service
Wanzl GmbH and Co. KGaA - Key offerings
SWOT

16. Appendix

16.1 Scope of the report

Market definition
Objectives
Notes and caveats

16.2 Inclusions and exclusions checklist

Inclusions checklist
Exclusions checklist

16.3 Currency conversion rates for US$

16.4 Research methodology

16.5 Data procurement

Information sources

16.6 Data validation

16.7 Validation techniques employed for market sizing

16.8 Data synthesis

16.9 360 degree market analysis

16.10 List of abbreviations

Research Methodology

Technavio presents a detailed picture of the market by way of study, synthesis, and summation of data from multiple sources. The analysts have presented the various facets of the market with a particular focus on identifying the key industry influencers. The data thus presented is comprehensive, reliable, and the result of extensive research, both primary and secondary.

INFORMATION SOURCES

Primary sources

  • Manufacturers and suppliers
  • Channel partners
  • Industry experts
  • Strategic decision makers

Secondary sources

  • Industry journals and periodicals
  • Government data
  • Financial reports of key industry players
  • Historical data
  • Press releases

DATA ANALYSIS

Data Synthesis

  • Collation of data
  • Estimation of key figures
  • Analysis of derived insights

Data Validation

  • Triangulation with data models
  • Reference against proprietary databases
  • Corroboration with industry experts

REPORT WRITING

Qualitative

  • Market drivers
  • Market challenges
  • Market trends
  • Five forces analysis

Quantitative

  • Market size and forecast
  • Market segmentation
  • Geographical insights
  • Competitive landscape

Interested in this report?

Get your sample now to see our research methodology and insights!

Download Now

Frequently Asked Questions

E-gates market growth will increase by USD 13180.4 million during 2026-2030.

The E-gates market is expected to grow at a CAGR of 40.6% during 2026-2030.

E-gates market is segmented by Type (Hardware, Software, Service) Application (Airport, Government) Product type (Automated e-gates, Traditional e-gates)

Amadeus IT Group SA, Atos SE, Cognitec Systems GmbH, COMINFO a.s, DERMALOG Systems GmbH, E Gates Technologies Pvt. Ltd., Giesecke Devrient GmbH, Gunnebo AB, IDEMIA France SAS, IN Groupe, Indra Sistemas SA, Magnetic Autocontrol GmbH, NEC Corp., RTX Corp., secunet Security Networks AG, SITA, Thales Group, Wanzl GmbH and Co. KGaA are a few of the key vendors in the E-gates market.

Europe will register the highest growth rate of 38.5% among the other regions. Therefore, the E-gates market in Europe is expected to garner significant business opportunities for the vendors during the forecast period.

Germany, UK, France, Italy, Spain, The Netherlands, US, Canada, Mexico, China, Japan, India, South Korea, Australia, Indonesia, Saudi Arabia, UAE, South Africa, Israel, Turkey, Brazil, Argentina, Chile

  • Reduced airport operating expenses is the driving factor this market.

The E-gates market vendors should focus on grabbing business opportunities from the Type segment as it accounted for the largest market share in the base year.