Border Security Market Size 2025-2029
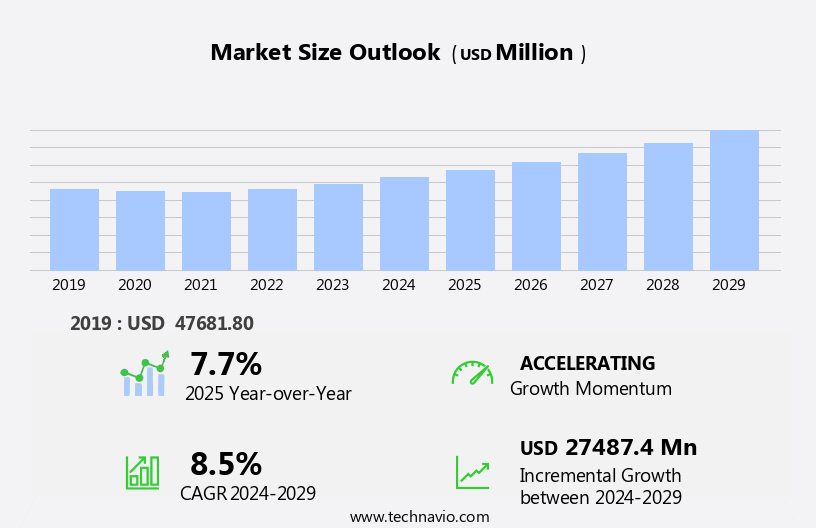
The border security market size is forecast to increase by USD 27.49 billion at a CAGR of 8.5% between 2024 and 2029.
- The market is driven by the increasing concern for data breaches and the modernization of maritime border security. With the proliferation of digital technologies, the risk of cyber attacks and data breaches at borders is a significant concern for governments worldwide. This has led to a rise in investments in advanced border security solutions, including biometric identification systems and surveillance technologies. Moreover, the modernization of maritime border security is another key driver for the market. The market encompasses platforms such as patrol aircraft, ground attack helicopters, transport helicopters, amphibious aircraft, marine vessels, and submarines. With the rise in maritime trade and the increasing number of migrants entering countries through sea routes, there is a growing need for advanced security systems to ensure the safety and security of coastal areas.
- However, the market faces challenges such as strict government rules and regulations, which can hinder the adoption of new technologies and the implementation of border security initiatives. Additionally, the high cost of implementing these solutions can be a significant barrier for many countries, particularly those with limited budgets. Companies seeking to capitalize on market opportunities must navigate these challenges effectively by collaborating with governments and offering cost-effective, innovative solutions that comply with regulations. The DoD is also reallocating funds from its internal budget to bolster shipbuilding efforts in response to China's expanding naval fleet.
What will be the Size of the Border Security Market during the forecast period?
Explore in-depth regional segment analysis with market size data - historical 2019-2023 and forecasts 2025-2029 - in the full report.
Request Free Sample
- The market is witnessing significant advancements, driven by the integration of technology and international cooperation. Predictive modeling and data analytics platforms are revolutionizing threat identification, while unmanned aerial vehicles and autonomous vehicles enhance surveillance capabilities. Biometric identification and psychological profiling are becoming standard for border control, with artificial intelligence and machine learning powering these systems. Interagency coordination is essential for effective border security strategies, and international treaties establish legal frameworks for information sharing. Advanced surveillance systems employ behavioral analysis, quantum computing, and encryption standards to secure borders. Counter-terrorism strategies incorporate open source intelligence and cyber warfare. Training and development in human factors and security standards are crucial for border security personnel.
- Simulation and modeling tools help optimize field operations, and automated border control streamlines the traveler processing experience. Biometric passports and blockchain technology ensure secure document authentication. The market's future trends include the adoption of advanced technologies like AI, biometrics, and encryption to strengthen border security policies.
How is this Border Security Industry segmented?
The border security industry research report provides comprehensive data (region-wise segment analysis), with forecasts and estimates in "USD million" for the period 2025-2029, as well as historical data from 2019-2023 for the following segments.
- Platform
- Air
- Land
- Sea
- Component
- Laser
- Radar
- Camera
- Perimeter intrusion
- Others
- Type
- Platform-based systems
- Stationary systems
- Portable systems
- Geography
- North America
- US
- Canada
- Mexico
- Europe
- France
- Germany
- UK
- APAC
- China
- India
- Japan
- South Korea
- Rest of World (ROW)
- North America
By Platform Insights
The air segment is estimated to witness significant growth during the forecast period. The market encompasses a range of technologies and strategies aimed at safeguarding national territories from various threats, including illegal immigration, weapons trafficking, and cross-border crime. Access control and immigration control are crucial components, with advanced systems employing biometric authentication and facial recognition for efficient identification. Intelligence gathering is integral, utilizing data analysis, threat analysis, and information sharing among law enforcement agencies. Physical barriers, such as fence systems and physical barriers, are complemented by surveillance systems, including security cameras, motion detection, and night vision. Remote sensing and vulnerability assessment help in identifying potential weaknesses, while border agents and security personnel ensure an effective response and emergency management.
Advanced technologies like thermal imaging, drone surveillance, and explosive detection further bolster border security. Cloud-based security and data encryption are essential for securing sensitive information, while perimeter security solutions, such as perimeter intrusion detection and wireless sensors, protect against unauthorized access. Security software, security training, and border management systems ensure optimal performance and preparedness. The market is continuously evolving, with ongoing advancements in security technologies, border patrol technology, and border patrol strategies. The need for effective border security remains a top priority in today's complex and dynamic security landscape.
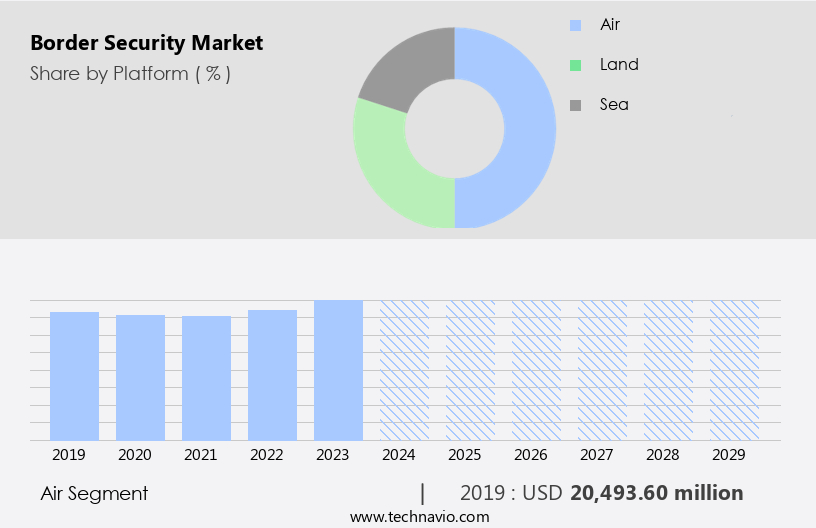
The Air segment was valued at USD 20.49 billion in 2019 and showed a gradual increase during the forecast period.
The Border Security Market is evolving with advanced technologies and strategies to enhance protection. High-speed optical fiber cables enable secure and efficient communication across border checkpoints. Smart underground sensors detect unauthorized movements, aiding in smuggling prevention and stopping illicit activities. Strategically placed guard towers provide enhanced surveillance, assisting security guards in monitoring and responding to threats effectively. Governments invest in border solutions to combat drug trafficking, ensuring strict controls and intelligence-led operations. Strong security frameworks also contribute to terrorism prevention, leveraging advanced detection and rapid response systems. Air security solutions encompass advanced technologies such as air radars, coastal radars, ground radars, thermal cameras, lasers, unmanned vehicles, and radio frequency jammers.
Regional Analysis
North America is estimated to contribute 38% to the growth of the global market during the forecast period. Technavio's analysts have elaborately explained the regional trends and drivers that shape the market during the forecast period.
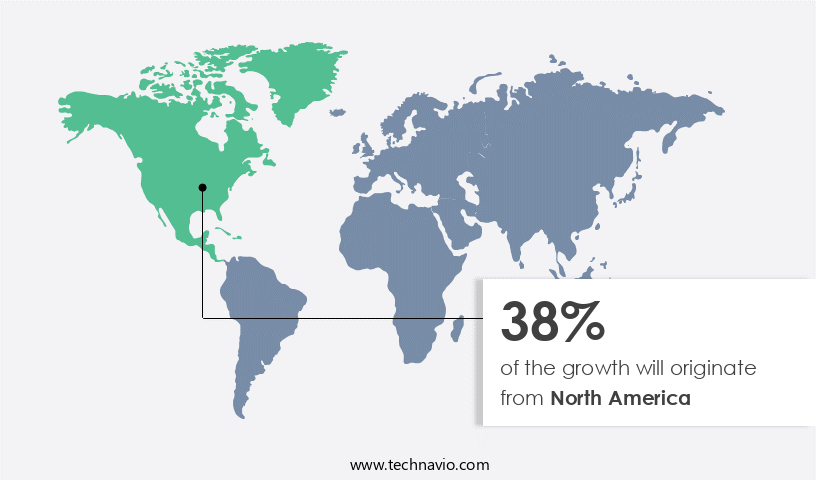
In the market, North America dominates with the United States and Canada spearheading advancements through substantial investment and research. Companies prioritize innovation and continuous improvement in security technologies, such as access control, intelligence gathering, and threat analysis. The U.S. Department of Defense (DoD) invests heavily in modernizing naval capabilities, acquiring advanced ground, aviation, and maritime vehicles, and shipbuilding programs to counteract growing naval challenges. Simultaneously, the U.S. remains committed to fortifying border security systems, integrating perimeter breach detectors, coastal surveillance technologies, and advanced sensors to mitigate illegal immigration, trafficking, drug smuggling, and terrorism threats.
Law enforcement agencies collaborate on information sharing and border management strategies, employing security personnel, security cameras, and facial recognition systems for enhanced security. Border patrol technology, including X-ray scanners, metal detectors, and explosive detection, plays a crucial role in securing borders. Perimeter intrusion detection, drone surveillance, and network intrusion detection systems provide additional layers of protection. The market continues to evolve, with cloud-based security, wireless sensors, and security software becoming increasingly prevalent. Cloud computing, artificial intelligence, and machine learning further augment border security capabilities.
Market Dynamics
Our researchers analyzed the data with 2024 as the base year, along with the key drivers, trends, and challenges. A holistic analysis of drivers will help companies refine their marketing strategies to gain a competitive advantage.
What are the Border Security market drivers leading to the rise in the adoption of Industry?
- The escalating worry over data breaches serves as the primary catalyst for market growth. The market is experiencing significant growth due to increasing geopolitical and territorial conflicts, leading to heightened demand for advanced security technologies. These conflicts pose a threat to national security and privacy, resulting in the adoption of advanced security solutions. Night vision, motion detection, and thermal imaging technologies are increasingly being used for border surveillance to enhance security and prevent terrorism. Cloud-based security systems, data encryption, and IP cameras are essential components of modern border control systems, ensuring effective information sharing between law enforcement agencies. PTZ cameras and lighting systems are also crucial for enhancing the capabilities of border security personnel.
- The integration of X-ray scanners and emergency response systems further strengthens border security. The rising incidences of cyberattacks and data breaches necessitate the use of advanced cybersecurity solutions, such as thermal imaging and motion detection, to protect sensitive information. Overall, the market is expected to continue its growth trajectory, driven by the need for advanced security technologies to address the evolving security landscape.
What are the Border Security market trends shaping the Industry?
- Maritime border security modernization is currently a significant market trend. This involves the implementation of advanced technologies and strategies to enhance security measures at sea borders. The market is experiencing significant growth, particularly in the maritime segment, due to escalating geopolitical tensions, transnational crime, and territorial disputes. Advanced maritime surveillance technologies, such as unmanned surface and underwater vehicles, AI-powered threat detection systems, and integrated coastal radar networks, are driving this trend. These innovations enhance real-time situational awareness, improve response times, and reduce human risk in patrolling vast and often contested maritime zones. The need to combat piracy, smuggling, human trafficking, and illegal fishing is fueling this market's expansion.
- Additionally, network video recorders, explosive detection systems, perimeter security solutions, wireless sensors, network intrusion detection, and biometric authentication are essential components of comprehensive border security systems. Infrared sensors, metal detectors, surveillance systems, threat analysis, and cross-border crime prevention are other critical areas of focus. The market's growth is underpinned by the increasing importance of securing borders and protecting national sovereignty.
How does Border Security market face challenges during its growth?
- The strict adherence to government rules and regulations poses a significant challenge to the industry's growth trajectory. The market faces regulatory hurdles as enterprises must adhere to stringent government regulations to ensure safety and security. These regulations include approvals from the Federal Aviation Administration (FAA) for drone surveillance, commercial unmanned aerial system (UAS) licenses, European Defense Agency (EDA) approvals, and International Maritime Organization (IMO) compliance for maritime security. Compliance with these regulations is essential for border personnel and vehicle safety. Border security solutions play a crucial role in helping companies meet these requirements. For instance, SOLAS is an international maritime treaty that sets minimum safety standards for shipping equipment and operations.
- Incorporating advanced technologies like facial recognition, ground penetrating radar, perimeter intrusion detection, security software, and anti-virus software into border security systems can enhance security and efficiency while adhering to regulatory requirements. Security audits, security personnel training, and response planning are also integral components of effective border security strategies.
Exclusive Customer Landscape
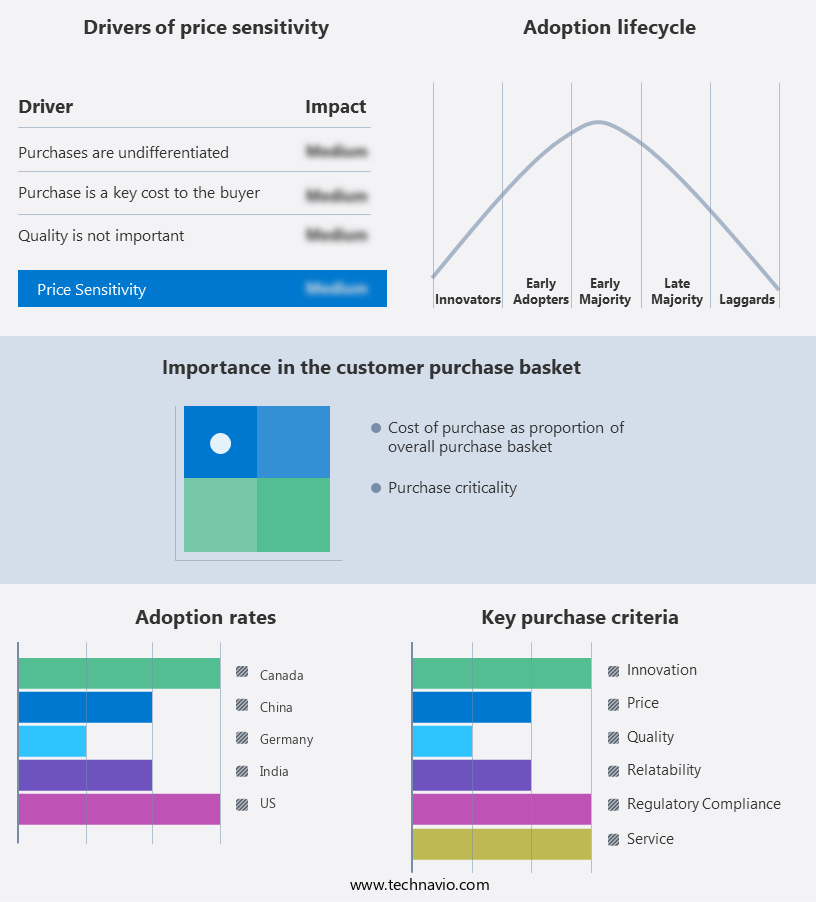
The border security market forecasting report includes the adoption lifecycle of the market, covering from the innovator's stage to the laggard's stage. It focuses on adoption rates in different regions based on penetration. Furthermore, the border security market report also includes key purchase criteria and drivers of price sensitivity to help companies evaluate and develop their market growth analysis strategies.
Customer Landscape
Key Companies & Market Insights
Companies are implementing various strategies, such as strategic alliances, border security market forecast, partnerships, mergers and acquisitions, geographical expansion, and product/service launches, to enhance their presence in the industry.
Airbus SE - This company specializes in border security services, ensuring the protection of critical infrastructure against potential threats while maintaining the integrity and security of essential assets.
The industry research and growth report includes detailed analyses of the competitive landscape of the market and information about key companies, including:
- Airbus SE
- BAE Systems Plc
- Blighter Surveillance Systems Ltd.
- Cobham Ltd.
- Dignia Systems Ltd.
- Elbit Systems Ltd.
- General Dynamics Corp.
- Indra Sistemas SA
- Inmarsat Global Ltd.
- Israel Aerospace Industries Ltd.
- Moog Inc.
- Northrop Grumman Corp.
- Rafael Advanced Defense Systems Ltd.
- RTX Corp.
- Safe Security Solutions
- Safran SA
- Teledyne Technologies Inc.
- Textron Inc.
- Thales Group
- The Boeing Co.
Qualitative and quantitative analysis of companies has been conducted to help clients understand the wider business environment as well as the strengths and weaknesses of key industry players. Data is qualitatively analyzed to categorize companies as pure play, category-focused, industry-focused, and diversified; it is quantitatively analyzed to categorize companies as dominant, leading, strong, tentative, and weak.
Recent Development and News in Border Security Market
- In March 2024, Safran Identity & Security, a leading global provider of secure identity and border management solutions, announced the launch of Morpheus, an innovative biometric border control system. Morpheus uses artificial intelligence and machine learning algorithms to analyze travelers' biometric data in real-time, significantly enhancing border security and reducing processing times (Safran Identity & Security press release, 2024).
- In June 2024, Thales and Gemalto, two major players in the market, announced their merger, creating a global leader in digital security. The combined entity, Thales Gemalto, will offer a comprehensive range of border control solutions, from identity verification to secure communication systems (Thales press release, 2024).
- In November 2024, the European Union (EU) and the European Border and Coast Guard Agency (Frontex) signed a â¬4.3 billion (USD4.8 billion) budget for the 2021-2027 period, focusing on enhancing EU's external border security and strengthening cooperation with neighboring countries (European Commission press release, 2024).
- In February 2025, IDEMIA, a global leader in identity and security, showcased its MorphoWave Compact, a contactless, high-speed biometric scanner, at the World Economic Forum in Davos. The device can capture and authenticate a traveler's identity in just seconds, significantly improving border control efficiency (IDEMIA press release, 2025).
Research Analyst Overview
The market continues to evolve, with dynamic market activities unfolding across various sectors. Entities involved in border management face ongoing challenges, requiring the integration of advanced technologies to address issues such as access control, intelligence gathering, and weapons trafficking. Physical barriers, fence systems, and surveillance technologies, including security cameras, night vision, and thermal imaging, are essential components of border infrastructure. Remote sensing technologies, such as ground penetrating radar and drone surveillance, offer valuable insights for vulnerability assessment and cross-border crime prevention. Border agents rely on data analysis and real-time information sharing to enhance their response planning capabilities.
Security personnel are trained in the latest security technologies, including video analytics, motion detection, and facial recognition, to identify potential threats and prevent smuggling and human trafficking. X-ray scanners and explosive detection systems ensure the safety of travelers and cargo. Border security solutions encompass cloud-based security, network video recorders, and network intrusion detection systems, providing law enforcement agencies with the ability to monitor and secure their networks from cyber threats. Biometric authentication and security software offer enhanced security measures, while perimeter intrusion detection and wireless sensors provide early warning systems for potential breaches. The ongoing development of border security technologies reflects the continuous nature of market dynamics, with ongoing innovation and integration of new technologies to address evolving threats and challenges.
The integration of these technologies into comprehensive border management strategies is crucial for effective border security.
Dive into Technavio's robust research methodology, blending expert interviews, extensive data synthesis, and validated models for unparalleled Border Security Market insights. See full methodology.
|
Market Scope |
|
|
Report Coverage |
Details |
|
Page number |
229 |
|
Base year |
2024 |
|
Historic period |
2019-2023 |
|
Forecast period |
2025-2029 |
|
Growth momentum & CAGR |
Accelerate at a CAGR of 8.5% |
|
Market growth 2025-2029 |
USD 27.49 billion |
|
Market structure |
Fragmented |
|
YoY growth 2024-2025(%) |
7.7 |
|
Key countries |
US, Canada, China, India, Germany, UK, Japan, Mexico, South Korea, and France |
|
Competitive landscape |
Leading Companies, Market Positioning of Companies, Competitive Strategies, and Industry Risks |
What are the Key Data Covered in this Border Security Market Research and Growth Report?
- CAGR of the Border Security industry during the forecast period
- Detailed information on factors that will drive the growth and forecasting between 2025 and 2029
- Precise estimation of the size of the market and its contribution of the industry in focus to the parent market
- Accurate predictions about upcoming growth and trends and changes in consumer behaviour
- Growth of the market across North America, APAC, Europe, South America, and Middle East and Africa
- Thorough analysis of the market's competitive landscape and detailed information about companies
- Comprehensive analysis of factors that will challenge the border security market growth of industry companies
We can help! Our analysts can customize this border security market research report to meet your requirements.
 RIA -
RIA - 
