E-wallet Market Analysis, Size, and Forecast 2026-2030: APAC (China, Japan, and India), North America (US, Canada, and Mexico), Europe (Germany, UK, and France), South America (Brazil and Argentina), Middle East and Africa (Saudi Arabia, UAE, and South Africa), and Rest of World (ROW)

E-wallet Market Analysis, Size, and Forecast 2026-2030:
APAC (China, Japan, and India), North America (US, Canada, and Mexico), Europe (Germany, UK, and France), South America (Brazil and Argentina), Middle East and Africa (Saudi Arabia, UAE, and South Africa), and Rest of World (ROW)

Published: Apr 2026 294 Pages SKU: IRTNTR75273

Market Overview at a Glance

$203.40 B
Market Opportunity
22.1%
CAGR 2025 - 2030
36.9%
APAC Growth
$66.74 B
Proximity segment 2024

E-wallet Market Size 2026-2030

The e-wallet market size is valued to increase by USD 203.40 billion, at a CAGR of 22.1% from 2025 to 2030. Rising number of online transactions will drive the e-wallet market.

Major Market Trends & Insights

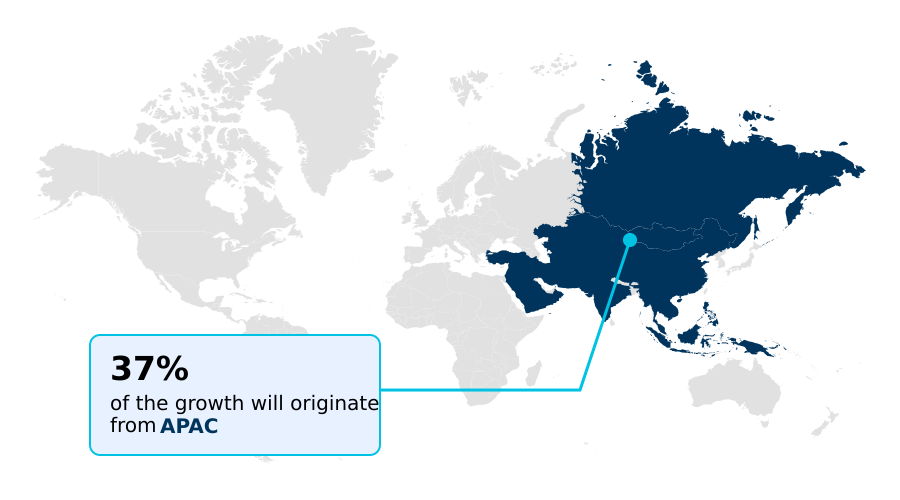
  • APAC dominated the market and accounted for a 36.9% growth during the forecast period.
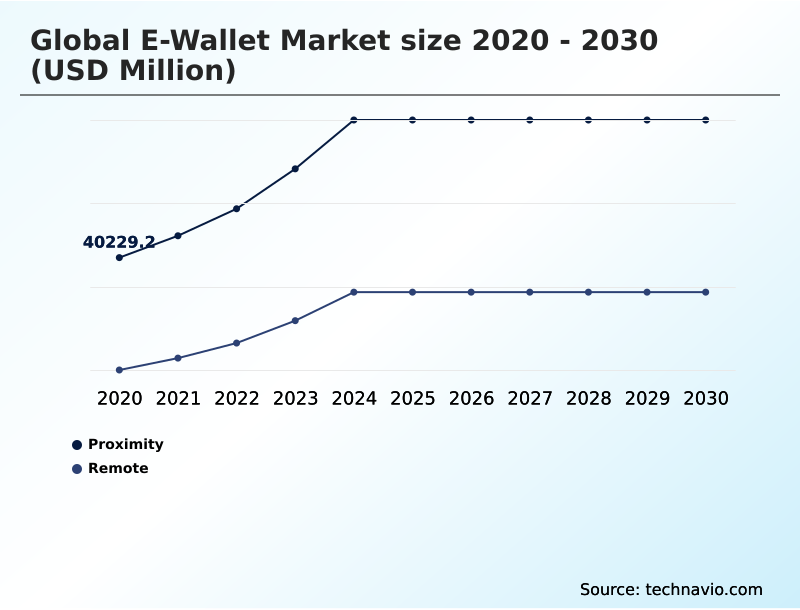
  • By Technology - Proximity segment was valued at USD 66.74 billion in 2024
  • By Application - Retail and e-commerce segment accounted for the largest market revenue share in 2024

Market Size & Forecast

  • Market Opportunities: USD 263.63 billion
  • Market Future Opportunities: USD 203.40 billion
  • CAGR from 2025 to 2030 : 22.1%

Market Summary

  • The e-wallet market is undergoing a significant transformation, driven by the global shift toward a cashless economy and the widespread adoption of smartphones. This evolution is supported by key technological advancements, including the implementation of robust digital payment gateway architecture and sophisticated payment processing software.
  • Trends such as the integration of biometric authentication and AI for fraud detection are enhancing security and building consumer trust. A primary driver is the demand for convenience in e-commerce checkout and peer-to-peer transfers, which has become essential for both consumers and businesses.
  • For instance, a retail enterprise can leverage omnichannel retail payments to create a seamless customer journey, integrating digital loyalty programs and in-app purchasing to boost engagement and sales. However, the market faces challenges related to e-wallet regulatory compliance and the high costs of maintaining a secure cloud-based payment infrastructure.
  • The development of open banking APIs is helping to address interoperability issues, fostering a more connected digital financial services ecosystem.

What will be the Size of the E-wallet Market during the forecast period?

Get Key Insights on Market Forecast (PDF) Request Free Sample

How is the E-wallet Market Segmented?

The e-wallet industry research report provides comprehensive data (region-wise segment analysis), with forecasts and estimates in "USD million" for the period 2026-2030, as well as historical data from 2020-2024 for the following segments.

  • Technology
    • Proximity
    • Remote
  • Application
    • Retail and e-commerce
    • Media and entertainment
    • Hospitality and transportation
    • Telecommunication
    • Others
  • Type
    • Semi-closed wallets
    • Open wallets
    • Closed wallets
  • Geography
    • APAC
      • China
      • Japan
      • India
    • North America
      • US
      • Canada
      • Mexico
    • Europe
      • Germany
      • UK
      • France
    • South America
      • Brazil
      • Argentina
    • Middle East and Africa
      • Saudi Arabia
      • UAE
      • South Africa
    • Rest of World (ROW)

By Technology Insights

The proximity segment is estimated to witness significant growth during the forecast period.

The proximity segment is defined by technologies enabling secure, in-person transactions. Solutions built on near field communication (nfc payment technology) and qr code technology are becoming standard for facilitating contactless payments.

This shift enhances contactless transaction speed at the mobile point of sale, with tap-to-pay functionality improving checkout efficiency by over 30%.

The integrity of these transactions is maintained through robust methods like tokenization, which masks sensitive data, and hardware-level security via a secure element.

As qr code payment standards mature, they provide a low-cost, highly accessible method for merchants to accept digital payments, further driving adoption in physical retail environments.

Request Free Sample

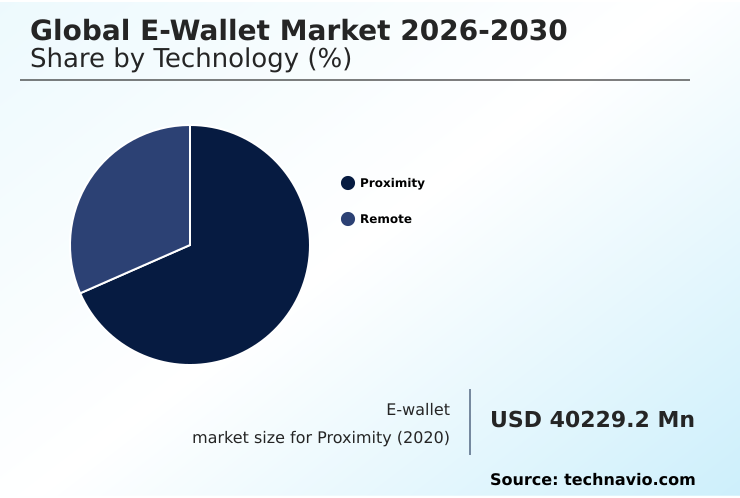
The Proximity segment was valued at USD 66.74 billion in 2024 and showed a gradual increase during the forecast period.

Request Free Sample

Regional Analysis

APAC is estimated to contribute 36.9% to the growth of the global market during the forecast period.Technavio’s analysts have elaborately explained the regional trends and drivers that shape the market during the forecast period.

See How E-wallet Market Demand is Rising in APAC Request Free Sample

The geographic landscape of the e-wallet market is highly varied. In APAC, high mobile penetration has spurred the rapid adoption of digital financial services, with some countries seeing over 80% of retail transactions occur via mobile.

In contrast, North America and Europe are focusing on refining omnichannel retail payments and enhancing mobile banking integration. The development of central bank digital currency (CBDC) initiatives is a key factor influencing regional strategies.

These digital currency solutions are poised to transform cross-border payment processing, with pilot programs demonstrating a potential 40% reduction in transaction fees.

Effective digital identity verification remains a universal priority, underpinning the trust required for widespread consumer and merchant acceptance across all regions, including South America and the Middle East and Africa.

Market Dynamics

Our researchers analyzed the data with 2025 as the base year, along with the key drivers, trends, and challenges. A holistic analysis of drivers will help companies refine their marketing strategies to gain a competitive advantage.

  • Strategically navigating the e-wallet market requires a deep understanding of its core operational and security components. A primary consideration is how to secure e-wallet transactions, where the deployment of ai based real time fraud detection has become a critical layer of defense, proving to be over 60% more effective than legacy systems in identifying fraudulent patterns.
  • For businesses, the pathway to market entry often involves deciding between a proprietary platform or pursuing e-wallet integration for small business through third-party providers. This decision is closely tied to the complexities of implementing a digital wallet api and requires a thorough analysis when comparing open and closed loop wallets.
  • The future of biometric payment verification promises to further streamline user experience, while the immediate benefits of using qr code payments are evident in their low-cost, scalable deployment. From a financial perspective, a cross-border e-wallet fee comparison reveals significant savings over traditional methods.
  • In an e-wallet vs traditional bank transfers analysis, the digital alternative consistently offers superior speed and lower costs, despite the persistent challenges of e-wallet market adoption, such as regulatory uncertainty and the need for broader consumer education.

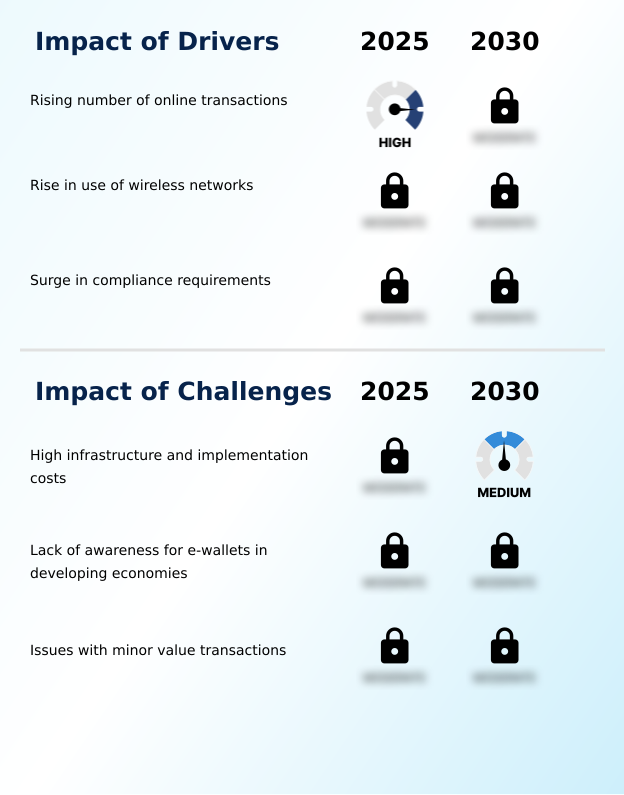
What are the key market drivers leading to the rise in the adoption of E-wallet Industry?

  • The rising number of online transactions is a key driver fueling the expansion of the market.

  • The proliferation of real-time payment networks and high digital wallet adoption are key market drivers. A streamlined e-commerce checkout experience has been shown to reduce cart abandonment rates by over 15%, while integrated digital loyalty programs increase customer retention.
  • The rise of the gig economy has fueled demand for efficient peer to peer transfers and enhanced p2p payment app features.
  • In many regions, government-backed initiatives like the unified payment interface provide crucial digital wallet enablement, expanding access to financial services.
  • The evolution toward a super app financial ecosystem that consolidates services like subscription billing and banking into a single platform continues to propel market expansion.

What are the market trends shaping the E-wallet Industry?

  • The integration of advanced technologies such as artificial intelligence, blockchain, and biometrics is a significant trend. It is reshaping the market by enhancing security and improving the overall user experience.

  • Advanced technologies are setting new standards in the e-wallet market. The integration of blockchain in digital payments is enhancing transparency for cross border transfers, reducing settlement times by up to 60%. Enhanced security features like biometric authentication and multi factor verification are central to improving e-wallet user experience design, with platforms reporting a 25% increase in user trust.
  • AI for fraud detection leverages real time analytics to identify and block threats with greater precision. Furthermore, the embedding of buy now pay later (bnpl) services, p2p lending platforms, and the issuance of virtual card numbers for secure online shopping are expanding the functional scope of digital wallets far beyond simple payments.

What challenges does the E-wallet Industry face during its growth?

  • High infrastructure and implementation costs present a key challenge, affecting the growth trajectory of the industry.

  • Significant operational challenges constrain market growth. Navigating complex e-wallet regulatory compliance can increase operational costs by up to 25% for service providers. The initial capital outlay for a secure cloud based payment infrastructure and a robust digital payment gateway is substantial.
  • Interoperability also remains a hurdle; achieving seamless mobile payment system integration between different merchant payment solutions and a closed loop payment system requires significant investment in payment processing software and open banking APIs. Moreover, the continuous need to update fraud management solutions to counter evolving threats adds a persistent financial burden, impacting profitability for providers of all sizes.

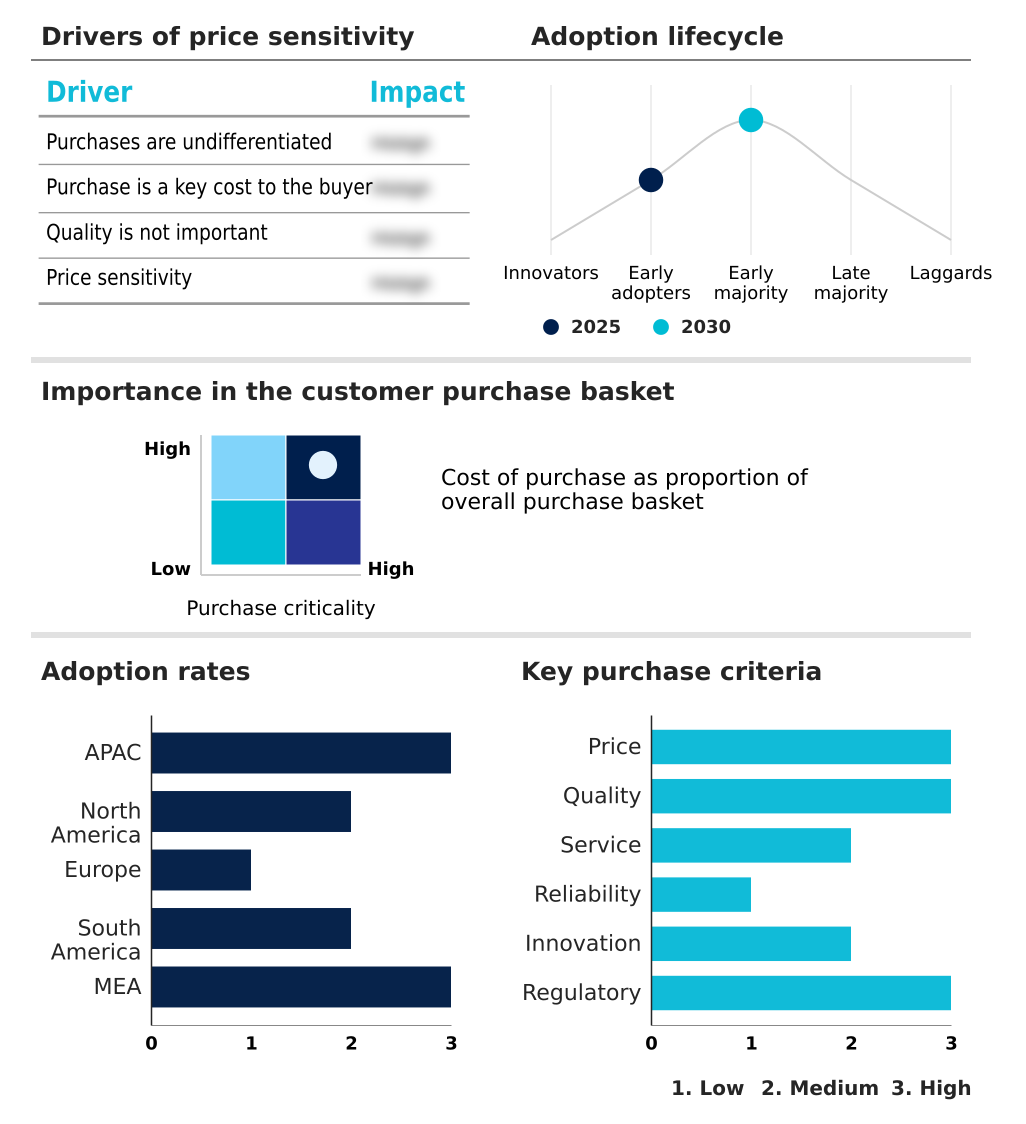
Exclusive Technavio Analysis on Customer Landscape

The e-wallet market forecasting report includes the adoption lifecycle of the market, covering from the innovator’s stage to the laggard’s stage. It focuses on adoption rates in different regions based on penetration. Furthermore, the e-wallet market report also includes key purchase criteria and drivers of price sensitivity to help companies evaluate and develop their market growth analysis strategies.

Customer Landscape of E-wallet Industry

Competitive Landscape

Companies are implementing various strategies, such as strategic alliances, e-wallet market forecast, partnerships, mergers and acquisitions, geographical expansion, and product/service launches, to enhance their presence in the industry.

ACI Worldwide Inc. - Offerings include real-time payments, advanced payment processing software, and integrated fraud management solutions designed for the enterprise financial ecosystem.

The industry research and growth report includes detailed analyses of the competitive landscape of the market and information about key companies, including:

  • ACI Worldwide Inc.
  • Adyen NV
  • American Express Co.
  • Apple Inc.
  • Bharti Airtel Ltd.
  • Block Inc.
  • Google LLC
  • Grab Holdings Ltd.
  • Klarna Bank AB
  • Mastercard Inc.
  • One97 Communications Ltd.
  • PayPal Holdings Inc.
  • Paysafe Ltd.
  • PhonePe Pvt. Ltd.
  • Revolut Ltd.
  • Samsung Electronics Co. Ltd.
  • Stripe Inc.
  • Tencent Holdings Ltd.
  • Visa Inc.
  • WEX Inc.

Qualitative and quantitative analysis of companies has been conducted to help clients understand the wider business environment as well as the strengths and weaknesses of key industry players. Data is qualitatively analyzed to categorize companies as pure play, category-focused, industry-focused, and diversified; it is quantitatively analyzed to categorize companies as dominant, leading, strong, tentative, and weak.

Recent Development and News in E-wallet market

  • In August, 2024, Grab finalized an agreement with several regional central banks to integrate its digital payment system into a unified Southeast Asian QR network, enabling real-time currency conversion.
  • In January, 2025, PayPal announced a major infrastructure overhaul of its global processing hubs, investing in backend systems to accommodate higher data throughput and enhance platform reliability.
  • In March, 2025, Amazon Pay formed a strategic partnership with international fashion retailers, launching an integrated one-touch checkout that automates regional tax and shipping calculations.
  • In May, 2025, Apple Pay launched an enhanced AI-driven biometric verification system that analyzes behavioral patterns to prevent unauthorized device usage, setting a new standard in mobile security.

Dive into Technavio’s robust research methodology, blending expert interviews, extensive data synthesis, and validated models for unparalleled E-wallet Market insights. See full methodology.

Market Scope
Page number 294
Base year 2025
Historic period 2020-2024
Forecast period 2026-2030
Growth momentum & CAGR Accelerate at a CAGR of 22.1%
Market growth 2026-2030 USD 203399.4 million
Market structure Fragmented
YoY growth 2025-2026(%) 19.6%
Key countries China, Japan, India, South Korea, Australia, Indonesia, US, Canada, Mexico, Germany, UK, France, Italy, Spain, The Netherlands, Brazil, Argentina, Chile, Saudi Arabia, UAE, South Africa, Israel and Turkey
Competitive landscape Leading Companies, Market Positioning of Companies, Competitive Strategies, and Industry Risks

Request Free Sample

Research Analyst Overview

  • The e-wallet market's evolution extends far beyond simple peer-to-peer transfers, now encompassing a complex ecosystem built on advanced payment processing software and secure digital payment gateway architecture. This infrastructure supports a range of functionalities, from contactless payments and seamless e-commerce checkout to complex subscription billing and emerging p2p lending platforms.
  • A key strategic consideration for boardroom decision-making is the rise of central bank digital currency, which necessitates investment in compliant digital currency solutions and adaptable platforms. Security is foundational, with technologies like tokenization, biometric authentication, multi-factor verification, and a hardware-based secure element forming a layered defense.
  • Platforms leveraging AI for fraud detection through real-time analytics have demonstrated a 40% improvement in identifying anomalous transactions. The market is also defined by its delivery mechanisms, including near field communication for in-person transactions, qr code technology for broad accessibility, and unified payment interface systems for interoperability.
  • Digital wallet enablement through open banking APIs is fostering innovation, though challenges remain in bridging the gap between open and closed-loop payment systems while ensuring robust digital identity verification.

What are the Key Data Covered in this E-wallet Market Research and Growth Report?

  • What is the expected growth of the E-wallet Market between 2026 and 2030?

    • USD 203.40 billion, at a CAGR of 22.1%

  • What segmentation does the market report cover?

    • The report is segmented by Technology (Proximity, and Remote), Application (Retail and e-commerce, Media and entertainment, Hospitality and transportation, Telecommunication, and Others), Type (Semi-closed wallets, Open wallets, and Closed wallets) and Geography (APAC, North America, Europe, South America, Middle East and Africa)

  • Which regions are analyzed in the report?

    • APAC, North America, Europe, South America and Middle East and Africa

  • What are the key growth drivers and market challenges?

    • Rising number of online transactions, High infrastructure and implementation costs

  • Who are the major players in the E-wallet Market?

    • ACI Worldwide Inc., Adyen NV, American Express Co., Apple Inc., Bharti Airtel Ltd., Block Inc., Google LLC, Grab Holdings Ltd., Klarna Bank AB, Mastercard Inc., One97 Communications Ltd., PayPal Holdings Inc., Paysafe Ltd., PhonePe Pvt. Ltd., Revolut Ltd., Samsung Electronics Co. Ltd., Stripe Inc., Tencent Holdings Ltd., Visa Inc. and WEX Inc.

Market Research Insights

  • Market dynamics are shaped by accelerating digital wallet adoption, with platforms achieving a 40% higher engagement rate when featuring a superior e-wallet user experience design. The evolution toward a super app financial ecosystem is a key trend, integrating diverse digital financial services and p2p payment app features.
  • Innovations in tap-to-pay functionality are improving contactless transaction speed, a critical factor for merchant payment solutions. Security remains paramount, with robust digital wallet security protocols and AI for fraud detection reducing illicit activities by up to 50%. Navigating e-wallet regulatory compliance is crucial, as is achieving seamless mobile payment system integration with existing mobile banking infrastructure.
  • The rise of services like buy now pay later (bnpl) and integrated digital loyalty programs further diversifies offerings, while advancements in cross-border payment processing and real-time payment networks enhance global utility.

We can help! Our analysts can customize this e-wallet market research report to meet your requirements.

Get in touch

1. Executive Summary

1.1 Market overview

Executive Summary - Chart on Market Overview
Executive Summary - Data Table on Market Overview
Executive Summary - Chart on Global Market Characteristics
Executive Summary - Chart on Market by Geography
Executive Summary - Chart on Market Segmentation by Technology
Executive Summary - Chart on Market Segmentation by Application
Executive Summary - Chart on Market Segmentation by Type
Executive Summary - Chart on Incremental Growth
Executive Summary - Data Table on Incremental Growth
Executive Summary - Chart on Company Market Positioning

2. Technavio Analysis

2.1 Analysis of price sensitivity, lifecycle, customer purchase basket, adoption rates, and purchase criteria

2.2 Criticality of inputs and Factors of differentiation

Chart on Overview on criticality of inputs and factors of differentiation

2.3 Factors of disruption

Chart on Overview on factors of disruption

2.4 Impact of drivers and challenges

Chart on Impact of drivers and challenges in 2025 and 2030

3. Market Landscape

3.1 Market ecosystem

Chart on Parent Market
Data Table on - Parent Market

3.2 Market characteristics

Chart on Market characteristics analysis

3.3 Value chain analysis

Chart on Value chain analysis

4. Market Sizing

4.1 Market definition

Data Table on Offerings of companies included in the market definition

4.2 Market segment analysis

Market segments

4.3 Market size 2025

4.4 Market outlook: Forecast for 2025-2030

Chart on Global - Market size and forecast 2025-2030 ($ million)
Data Table on Global - Market size and forecast 2025-2030 ($ million)
Chart on Global Market: Year-over-year growth 2025-2030 (%)
Data Table on Global Market: Year-over-year growth 2025-2030 (%)

5. Historic Market Size

5.1 Global E-Wallet Market 2020 - 2024

Historic Market Size - Data Table on Global E-Wallet Market 2020 - 2024 ($ million)

5.2 Technology segment analysis 2020 - 2024

Historic Market Size - Technology Segment 2020 - 2024 ($ million)

5.3 Application segment analysis 2020 - 2024

Historic Market Size - Application Segment 2020 - 2024 ($ million)

5.4 Type segment analysis 2020 - 2024

Historic Market Size - Type Segment 2020 - 2024 ($ million)

5.5 Geography segment analysis 2020 - 2024

Historic Market Size - Geography Segment 2020 - 2024 ($ million)

5.6 Country segment analysis 2020 - 2024

Historic Market Size - Country Segment 2020 - 2024 ($ million)

6. Qualitative Analysis

6.1 Impact of AI on the Global E-Wallet Market

6.2 Impact of Geopolitical Conflicts on Global E-Wallet Market

7. Five Forces Analysis

7.1 Five forces summary

Five forces analysis - Comparison between 2025 and 2030

7.2 Bargaining power of buyers

Bargaining power of buyers - Impact of key factors 2025 and 2030

7.3 Bargaining power of suppliers

Bargaining power of suppliers - Impact of key factors in 2025 and 2030

7.4 Threat of new entrants

Threat of new entrants - Impact of key factors in 2025 and 2030

7.5 Threat of substitutes

Threat of substitutes - Impact of key factors in 2025 and 2030

7.6 Threat of rivalry

Threat of rivalry - Impact of key factors in 2025 and 2030

7.7 Market condition

Chart on Market condition - Five forces 2025 and 2030

8. Market Segmentation by Technology

8.1 Market segments

Chart on Technology - Market share 2025-2030 (%)
Data Table on Technology - Market share 2025-2030 (%)

8.2 Comparison by Technology

Chart on Comparison by Technology
Data Table on Comparison by Technology

8.3 Proximity - Market size and forecast 2025-2030

Chart on Proximity - Market size and forecast 2025-2030 ($ million)
Data Table on Proximity - Market size and forecast 2025-2030 ($ million)
Chart on Proximity - Year-over-year growth 2025-2030 (%)
Data Table on Proximity - Year-over-year growth 2025-2030 (%)

8.4 Remote - Market size and forecast 2025-2030

Chart on Remote - Market size and forecast 2025-2030 ($ million)
Data Table on Remote - Market size and forecast 2025-2030 ($ million)
Chart on Remote - Year-over-year growth 2025-2030 (%)
Data Table on Remote - Year-over-year growth 2025-2030 (%)

8.5 Market opportunity by Technology

Market opportunity by Technology ($ million)
Data Table on Market opportunity by Technology ($ million)

9. Market Segmentation by Application

9.1 Market segments

Chart on Application - Market share 2025-2030 (%)
Data Table on Application - Market share 2025-2030 (%)

9.2 Comparison by Application

Chart on Comparison by Application
Data Table on Comparison by Application

9.3 Retail and e-commerce - Market size and forecast 2025-2030

Chart on Retail and e-commerce - Market size and forecast 2025-2030 ($ million)
Data Table on Retail and e-commerce - Market size and forecast 2025-2030 ($ million)
Chart on Retail and e-commerce - Year-over-year growth 2025-2030 (%)
Data Table on Retail and e-commerce - Year-over-year growth 2025-2030 (%)

9.4 Media and entertainment - Market size and forecast 2025-2030

Chart on Media and entertainment - Market size and forecast 2025-2030 ($ million)
Data Table on Media and entertainment - Market size and forecast 2025-2030 ($ million)
Chart on Media and entertainment - Year-over-year growth 2025-2030 (%)
Data Table on Media and entertainment - Year-over-year growth 2025-2030 (%)

9.5 Hospitality and transportation - Market size and forecast 2025-2030

Chart on Hospitality and transportation - Market size and forecast 2025-2030 ($ million)
Data Table on Hospitality and transportation - Market size and forecast 2025-2030 ($ million)
Chart on Hospitality and transportation - Year-over-year growth 2025-2030 (%)
Data Table on Hospitality and transportation - Year-over-year growth 2025-2030 (%)

9.6 Telecommunication - Market size and forecast 2025-2030

Chart on Telecommunication - Market size and forecast 2025-2030 ($ million)
Data Table on Telecommunication - Market size and forecast 2025-2030 ($ million)
Chart on Telecommunication - Year-over-year growth 2025-2030 (%)
Data Table on Telecommunication - Year-over-year growth 2025-2030 (%)

9.7 Others - Market size and forecast 2025-2030

Chart on Others - Market size and forecast 2025-2030 ($ million)
Data Table on Others - Market size and forecast 2025-2030 ($ million)
Chart on Others - Year-over-year growth 2025-2030 (%)
Data Table on Others - Year-over-year growth 2025-2030 (%)

9.8 Market opportunity by Application

Market opportunity by Application ($ million)
Data Table on Market opportunity by Application ($ million)

10. Market Segmentation by Type

10.1 Market segments

Chart on Type - Market share 2025-2030 (%)
Data Table on Type - Market share 2025-2030 (%)

10.2 Comparison by Type

Chart on Comparison by Type
Data Table on Comparison by Type

10.3 Semi-closed wallets - Market size and forecast 2025-2030

Chart on Semi-closed wallets - Market size and forecast 2025-2030 ($ million)
Data Table on Semi-closed wallets - Market size and forecast 2025-2030 ($ million)
Chart on Semi-closed wallets - Year-over-year growth 2025-2030 (%)
Data Table on Semi-closed wallets - Year-over-year growth 2025-2030 (%)

10.4 Open wallets - Market size and forecast 2025-2030

Chart on Open wallets - Market size and forecast 2025-2030 ($ million)
Data Table on Open wallets - Market size and forecast 2025-2030 ($ million)
Chart on Open wallets - Year-over-year growth 2025-2030 (%)
Data Table on Open wallets - Year-over-year growth 2025-2030 (%)

10.5 Closed wallets - Market size and forecast 2025-2030

Chart on Closed wallets - Market size and forecast 2025-2030 ($ million)
Data Table on Closed wallets - Market size and forecast 2025-2030 ($ million)
Chart on Closed wallets - Year-over-year growth 2025-2030 (%)
Data Table on Closed wallets - Year-over-year growth 2025-2030 (%)

10.6 Market opportunity by Type

Market opportunity by Type ($ million)
Data Table on Market opportunity by Type ($ million)

11. Customer Landscape

11.1 Customer landscape overview

Analysis of price sensitivity, lifecycle, customer purchase basket, adoption rates, and purchase criteria

12. Geographic Landscape

12.1 Geographic segmentation

Chart on Market share by geography 2025-2030 (%)
Data Table on Market share by geography 2025-2030 (%)

12.2 Geographic comparison

Chart on Geographic comparison
Data Table on Geographic comparison

12.3 APAC - Market size and forecast 2025-2030

Chart on APAC - Market size and forecast 2025-2030 ($ million)
Data Table on APAC - Market size and forecast 2025-2030 ($ million)
Chart on APAC - Year-over-year growth 2025-2030 (%)
Data Table on APAC - Year-over-year growth 2025-2030 (%)
Chart on Regional Comparison - APAC
Data Table on Regional Comparison - APAC

12.3.1 China - Market size and forecast 2025-2030

Chart on China - Market size and forecast 2025-2030 ($ million)
Data Table on China - Market size and forecast 2025-2030 ($ million)
Chart on China - Year-over-year growth 2025-2030 (%)
Data Table on China - Year-over-year growth 2025-2030 (%)

12.3.2 Japan - Market size and forecast 2025-2030

Chart on Japan - Market size and forecast 2025-2030 ($ million)
Data Table on Japan - Market size and forecast 2025-2030 ($ million)
Chart on Japan - Year-over-year growth 2025-2030 (%)
Data Table on Japan - Year-over-year growth 2025-2030 (%)

12.3.3 India - Market size and forecast 2025-2030

Chart on India - Market size and forecast 2025-2030 ($ million)
Data Table on India - Market size and forecast 2025-2030 ($ million)
Chart on India - Year-over-year growth 2025-2030 (%)
Data Table on India - Year-over-year growth 2025-2030 (%)

12.3.4 South Korea - Market size and forecast 2025-2030

Chart on South Korea - Market size and forecast 2025-2030 ($ million)
Data Table on South Korea - Market size and forecast 2025-2030 ($ million)
Chart on South Korea - Year-over-year growth 2025-2030 (%)
Data Table on South Korea - Year-over-year growth 2025-2030 (%)

12.3.5 Australia - Market size and forecast 2025-2030

Chart on Australia - Market size and forecast 2025-2030 ($ million)
Data Table on Australia - Market size and forecast 2025-2030 ($ million)
Chart on Australia - Year-over-year growth 2025-2030 (%)
Data Table on Australia - Year-over-year growth 2025-2030 (%)

12.3.6 Indonesia - Market size and forecast 2025-2030

Chart on Indonesia - Market size and forecast 2025-2030 ($ million)
Data Table on Indonesia - Market size and forecast 2025-2030 ($ million)
Chart on Indonesia - Year-over-year growth 2025-2030 (%)
Data Table on Indonesia - Year-over-year growth 2025-2030 (%)

12.4 North America - Market size and forecast 2025-2030

Chart on North America - Market size and forecast 2025-2030 ($ million)
Data Table on North America - Market size and forecast 2025-2030 ($ million)
Chart on North America - Year-over-year growth 2025-2030 (%)
Data Table on North America - Year-over-year growth 2025-2030 (%)
Chart on Regional Comparison - North America
Data Table on Regional Comparison - North America

12.4.1 US - Market size and forecast 2025-2030

Chart on US - Market size and forecast 2025-2030 ($ million)
Data Table on US - Market size and forecast 2025-2030 ($ million)
Chart on US - Year-over-year growth 2025-2030 (%)
Data Table on US - Year-over-year growth 2025-2030 (%)

12.4.2 Canada - Market size and forecast 2025-2030

Chart on Canada - Market size and forecast 2025-2030 ($ million)
Data Table on Canada - Market size and forecast 2025-2030 ($ million)
Chart on Canada - Year-over-year growth 2025-2030 (%)
Data Table on Canada - Year-over-year growth 2025-2030 (%)

12.4.3 Mexico - Market size and forecast 2025-2030

Chart on Mexico - Market size and forecast 2025-2030 ($ million)
Data Table on Mexico - Market size and forecast 2025-2030 ($ million)
Chart on Mexico - Year-over-year growth 2025-2030 (%)
Data Table on Mexico - Year-over-year growth 2025-2030 (%)

12.5 Europe - Market size and forecast 2025-2030

Chart on Europe - Market size and forecast 2025-2030 ($ million)
Data Table on Europe - Market size and forecast 2025-2030 ($ million)
Chart on Europe - Year-over-year growth 2025-2030 (%)
Data Table on Europe - Year-over-year growth 2025-2030 (%)
Chart on Regional Comparison - Europe
Data Table on Regional Comparison - Europe

12.5.1 Germany - Market size and forecast 2025-2030

Chart on Germany - Market size and forecast 2025-2030 ($ million)
Data Table on Germany - Market size and forecast 2025-2030 ($ million)
Chart on Germany - Year-over-year growth 2025-2030 (%)
Data Table on Germany - Year-over-year growth 2025-2030 (%)

12.5.2 UK - Market size and forecast 2025-2030

Chart on UK - Market size and forecast 2025-2030 ($ million)
Data Table on UK - Market size and forecast 2025-2030 ($ million)
Chart on UK - Year-over-year growth 2025-2030 (%)
Data Table on UK - Year-over-year growth 2025-2030 (%)

12.5.3 France - Market size and forecast 2025-2030

Chart on France - Market size and forecast 2025-2030 ($ million)
Data Table on France - Market size and forecast 2025-2030 ($ million)
Chart on France - Year-over-year growth 2025-2030 (%)
Data Table on France - Year-over-year growth 2025-2030 (%)

12.5.4 Italy - Market size and forecast 2025-2030

Chart on Italy - Market size and forecast 2025-2030 ($ million)
Data Table on Italy - Market size and forecast 2025-2030 ($ million)
Chart on Italy - Year-over-year growth 2025-2030 (%)
Data Table on Italy - Year-over-year growth 2025-2030 (%)

12.5.5 Spain - Market size and forecast 2025-2030

Chart on Spain - Market size and forecast 2025-2030 ($ million)
Data Table on Spain - Market size and forecast 2025-2030 ($ million)
Chart on Spain - Year-over-year growth 2025-2030 (%)
Data Table on Spain - Year-over-year growth 2025-2030 (%)

12.5.6 The Netherlands - Market size and forecast 2025-2030

Chart on The Netherlands - Market size and forecast 2025-2030 ($ million)
Data Table on The Netherlands - Market size and forecast 2025-2030 ($ million)
Chart on The Netherlands - Year-over-year growth 2025-2030 (%)
Data Table on The Netherlands - Year-over-year growth 2025-2030 (%)

12.6 South America - Market size and forecast 2025-2030

Chart on South America - Market size and forecast 2025-2030 ($ million)
Data Table on South America - Market size and forecast 2025-2030 ($ million)
Chart on South America - Year-over-year growth 2025-2030 (%)
Data Table on South America - Year-over-year growth 2025-2030 (%)
Chart on Regional Comparison - South America
Data Table on Regional Comparison - South America

12.6.1 Brazil - Market size and forecast 2025-2030

Chart on Brazil - Market size and forecast 2025-2030 ($ million)
Data Table on Brazil - Market size and forecast 2025-2030 ($ million)
Chart on Brazil - Year-over-year growth 2025-2030 (%)
Data Table on Brazil - Year-over-year growth 2025-2030 (%)

12.6.2 Argentina - Market size and forecast 2025-2030

Chart on Argentina - Market size and forecast 2025-2030 ($ million)
Data Table on Argentina - Market size and forecast 2025-2030 ($ million)
Chart on Argentina - Year-over-year growth 2025-2030 (%)
Data Table on Argentina - Year-over-year growth 2025-2030 (%)

12.6.3 Chile - Market size and forecast 2025-2030

Chart on Chile - Market size and forecast 2025-2030 ($ million)
Data Table on Chile - Market size and forecast 2025-2030 ($ million)
Chart on Chile - Year-over-year growth 2025-2030 (%)
Data Table on Chile - Year-over-year growth 2025-2030 (%)

12.7 Middle East and Africa - Market size and forecast 2025-2030

Chart on Middle East and Africa - Market size and forecast 2025-2030 ($ million)
Data Table on Middle East and Africa - Market size and forecast 2025-2030 ($ million)
Chart on Middle East and Africa - Year-over-year growth 2025-2030 (%)
Data Table on Middle East and Africa - Year-over-year growth 2025-2030 (%)
Chart on Regional Comparison - Middle East and Africa
Data Table on Regional Comparison - Middle East and Africa

12.7.1 Saudi Arabia - Market size and forecast 2025-2030

Chart on Saudi Arabia - Market size and forecast 2025-2030 ($ million)
Data Table on Saudi Arabia - Market size and forecast 2025-2030 ($ million)
Chart on Saudi Arabia - Year-over-year growth 2025-2030 (%)
Data Table on Saudi Arabia - Year-over-year growth 2025-2030 (%)

12.7.2 UAE - Market size and forecast 2025-2030

Chart on UAE - Market size and forecast 2025-2030 ($ million)
Data Table on UAE - Market size and forecast 2025-2030 ($ million)
Chart on UAE - Year-over-year growth 2025-2030 (%)
Data Table on UAE - Year-over-year growth 2025-2030 (%)

12.7.3 South Africa - Market size and forecast 2025-2030

Chart on South Africa - Market size and forecast 2025-2030 ($ million)
Data Table on South Africa - Market size and forecast 2025-2030 ($ million)
Chart on South Africa - Year-over-year growth 2025-2030 (%)
Data Table on South Africa - Year-over-year growth 2025-2030 (%)

12.7.4 Israel - Market size and forecast 2025-2030

Chart on Israel - Market size and forecast 2025-2030 ($ million)
Data Table on Israel - Market size and forecast 2025-2030 ($ million)
Chart on Israel - Year-over-year growth 2025-2030 (%)
Data Table on Israel - Year-over-year growth 2025-2030 (%)

12.7.5 Turkey - Market size and forecast 2025-2030

Chart on Turkey - Market size and forecast 2025-2030 ($ million)
Data Table on Turkey - Market size and forecast 2025-2030 ($ million)
Chart on Turkey - Year-over-year growth 2025-2030 (%)
Data Table on Turkey - Year-over-year growth 2025-2030 (%)

12.8 Market opportunity by geography

Market opportunity by geography ($ million)
Data Tables on Market opportunity by geography ($ million)

13. Drivers, Challenges, and Opportunity

13.1 Market drivers

Rising number of online transactions
Rise in use of wireless networks
Surge in compliance requirements

13.2 Market challenges

High infrastructure and implementation costs
Lack of awareness for e-wallets in developing economies
Issues with minor value transactions

13.3 Impact of drivers and challenges

Impact of drivers and challenges in 2025 and 2030

13.4 Market opportunities

Integration of advanced technologies such as AI, blockchain, and biometrics
Expansion of e-wallet services
Increasing partnerships and collaborations

14. Competitive Landscape

14.1 Overview

14.2

Overview on criticality of inputs and factors of differentiation

14.3 Landscape disruption

Overview on factors of disruption

14.4 Industry risks

Impact of key risks on business

15. Competitive Analysis

15.1 Companies profiled

Companies covered

15.2 Company ranking index

15.3 Market positioning of companies

Matrix on companies position and classification

15.4 ACI Worldwide Inc.

ACI Worldwide Inc. - Overview
ACI Worldwide Inc. - Business segments
ACI Worldwide Inc. - Key offerings
ACI Worldwide Inc. - Segment focus
SWOT

15.5 American Express Co.

American Express Co. - Overview
American Express Co. - Business segments
American Express Co. - Key offerings
American Express Co. - Segment focus
SWOT

15.6 Apple Inc.

Apple Inc. - Overview
Apple Inc. - Business segments
Apple Inc. - Key news
Apple Inc. - Key offerings
Apple Inc. - Segment focus
SWOT

15.7 Bharti Airtel Ltd.

Bharti Airtel Ltd. - Overview
Bharti Airtel Ltd. - Business segments
Bharti Airtel Ltd. - Key news
Bharti Airtel Ltd. - Key offerings
Bharti Airtel Ltd. - Segment focus
SWOT

15.8 Google LLC

Google LLC - Overview
Google LLC - Product / Service
Google LLC - Key offerings
SWOT

15.9 Grab Holdings Ltd.

Grab Holdings Ltd. - Overview
Grab Holdings Ltd. - Business segments
Grab Holdings Ltd. - Key offerings
Grab Holdings Ltd. - Segment focus
SWOT

15.10 Klarna Bank AB

Klarna Bank AB - Overview
Klarna Bank AB - Product / Service
Klarna Bank AB - Key offerings
SWOT

15.11 Mastercard Inc.

Mastercard Inc. - Overview
Mastercard Inc. - Product / Service
Mastercard Inc. - Key offerings
SWOT

15.12 One97 Communications Ltd.

One97 Communications Ltd. - Overview
One97 Communications Ltd. - Product / Service
One97 Communications Ltd. - Key offerings
SWOT

15.13 PayPal Holdings Inc.

PayPal Holdings Inc. - Overview
PayPal Holdings Inc. - Product / Service
PayPal Holdings Inc. - Key news
PayPal Holdings Inc. - Key offerings
SWOT

15.14 Revolut Ltd.

Revolut Ltd. - Overview
Revolut Ltd. - Product / Service
Revolut Ltd. - Key offerings
SWOT

15.15 Samsung Electronics Co. Ltd.

Samsung Electronics Co. Ltd. - Overview
Samsung Electronics Co. Ltd. - Business segments
Samsung Electronics Co. Ltd. - Key news
Samsung Electronics Co. Ltd. - Key offerings
Samsung Electronics Co. Ltd. - Segment focus
SWOT

15.16 Tencent Holdings Ltd.

Tencent Holdings Ltd. - Overview
Tencent Holdings Ltd. - Business segments
Tencent Holdings Ltd. - Key offerings
Tencent Holdings Ltd. - Segment focus
SWOT

15.17 Visa Inc.

Visa Inc. - Overview
Visa Inc. - Product / Service
Visa Inc. - Key offerings
SWOT

15.18 WEX Inc.

WEX Inc. - Overview
WEX Inc. - Business segments
WEX Inc. - Key offerings
WEX Inc. - Segment focus
SWOT

16. Appendix

16.1 Scope of the report

Market definition
Objectives
Notes and caveats

16.2 Inclusions and exclusions checklist

Inclusions checklist
Exclusions checklist

16.3 Currency conversion rates for US$

16.4 Research methodology

16.5 Data procurement

Information sources

16.6 Data validation

16.7 Validation techniques employed for market sizing

16.8 Data synthesis

16.9 360 degree market analysis

16.10 List of abbreviations

Research Methodology

Technavio presents a detailed picture of the market by way of study, synthesis, and summation of data from multiple sources. The analysts have presented the various facets of the market with a particular focus on identifying the key industry influencers. The data thus presented is comprehensive, reliable, and the result of extensive research, both primary and secondary.

INFORMATION SOURCES

Primary sources

  • Manufacturers and suppliers
  • Channel partners
  • Industry experts
  • Strategic decision makers

Secondary sources

  • Industry journals and periodicals
  • Government data
  • Financial reports of key industry players
  • Historical data
  • Press releases

DATA ANALYSIS

Data Synthesis

  • Collation of data
  • Estimation of key figures
  • Analysis of derived insights

Data Validation

  • Triangulation with data models
  • Reference against proprietary databases
  • Corroboration with industry experts

REPORT WRITING

Qualitative

  • Market drivers
  • Market challenges
  • Market trends
  • Five forces analysis

Quantitative

  • Market size and forecast
  • Market segmentation
  • Geographical insights
  • Competitive landscape

Interested in this report?

Get your sample now to see our research methodology and insights!

Download Now

Frequently Asked Questions

E-wallet market growth will increase by USD 203399.4 million during 2026-2030.

The E-wallet market is expected to grow at a CAGR of 22.1% during 2026-2030.

E-wallet market is segmented by Technology (Proximity, Remote) Application (Retail and e-commerce, Media and entertainment, Hospitality and transportation, Telecommunication, Others) Type (Semi-closed wallets, Open wallets, Closed wallets)

ACI Worldwide Inc., Adyen NV, American Express Co., Apple Inc., Bharti Airtel Ltd., Block Inc., Google LLC, Grab Holdings Ltd., Klarna Bank AB, Mastercard Inc., One97 Communications Ltd., PayPal Holdings Inc., Paysafe Ltd., PhonePe Pvt. Ltd., Revolut Ltd., Samsung Electronics Co. Ltd., Stripe Inc., Tencent Holdings Ltd., Visa Inc., WEX Inc. are a few of the key vendors in the E-wallet market.

APAC will register the highest growth rate of 36.9% among the other regions. Therefore, the E-wallet market in APAC is expected to garner significant business opportunities for the vendors during the forecast period.

China, Japan, India, South Korea, Australia, Indonesia, US, Canada, Mexico, Germany, UK, France, Italy, Spain, The Netherlands, Brazil, Argentina, Chile, Saudi Arabia, UAE, South Africa, Israel, Turkey

  • Rising number of online transactions is the driving factor this market.

The E-wallet market vendors should focus on grabbing business opportunities from the Technology segment as it accounted for the largest market share in the base year.
RIA - Research AI Assistant
Ask RIA