Early Childhood Education Market Analysis, Size, and Forecast 2026-2030: North America (US, Canada, and Mexico), Europe (France, Germany, and UK), APAC (China, India, and Japan), South America (Brazil, Argentina, and Colombia), Middle East and Africa (Saudi Arabia, UAE, and South Africa), and Rest of World (ROW)

Early Childhood Education Market Analysis, Size, and Forecast 2026-2030:
North America (US, Canada, and Mexico), Europe (France, Germany, and UK), APAC (China, India, and Japan), South America (Brazil, Argentina, and Colombia), Middle East and Africa (Saudi Arabia, UAE, and South Africa), and Rest of World (ROW)

Published: Apr 2026 296 Pages SKU: IRTNTR81395

Market Overview at a Glance

$218.95 B
Market Opportunity
11.5%
CAGR 2025 - 2030
36.6%
North America Growth
$116.03 B
Child care centers segment 2024

Early Childhood Education Market Size 2026-2030
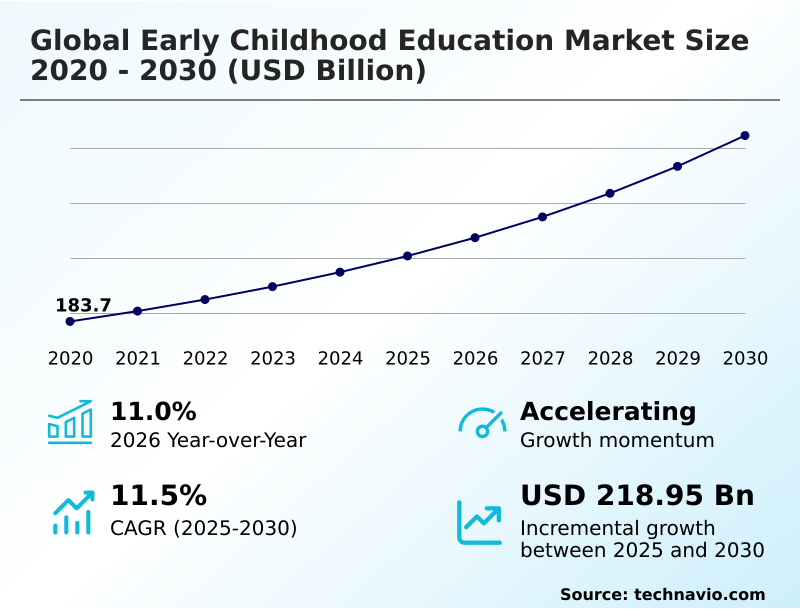
The early childhood education market size is valued to increase by USD 218.95 billion, at a CAGR of 11.5% from 2025 to 2030. Increasing labor force participation rates among women and shift toward dual-income households will drive the early childhood education market.

Major Market Trends & Insights

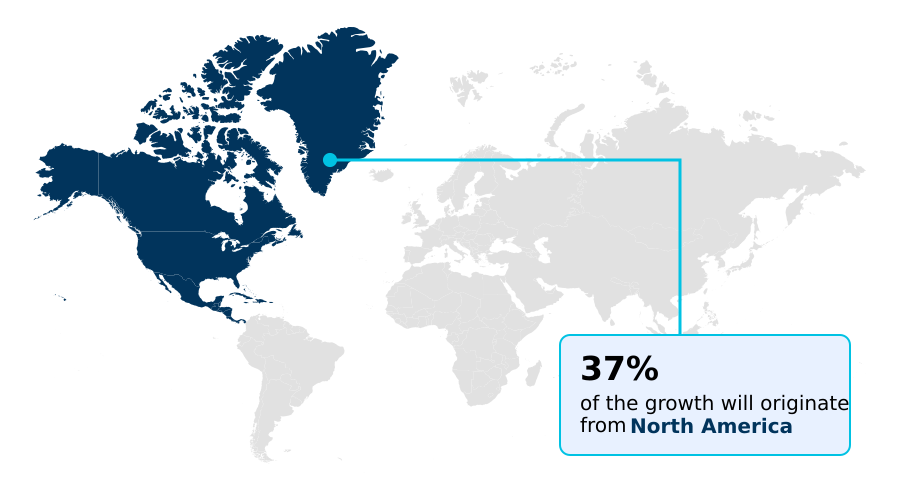
  • North America dominated the market and accounted for a 36.6% growth during the forecast period.
  • By Type - Child care centers segment was valued at USD 116.03 billion in 2024
  • By Age Group - Children aged 3 to 6 years segment accounted for the largest market revenue share in 2024

Market Size & Forecast

  • Market Opportunities: USD 338.01 billion
  • Market Future Opportunities: USD 218.95 billion
  • CAGR from 2025 to 2030 : 11.5%

Market Summary

  • The early childhood education market is a dynamic sector defined by the provision of pedagogical frameworks and instructional services designed to foster cognitive, social, and emotional development. Growth is fueled by increasing female labor force participation and government mandates promoting early learning.
  • Key trends include the integration of digital learning platforms with interactive educational content and a pedagogical shift towards holistic development models, including social-emotional learning and nature-based learning. For instance, a network of private preschools can leverage AI-driven developmental tracking to create personalized learning paths, improving milestone achievement rates while providing parents with real-time progress data.
  • However, the industry grapples with challenges such as high staff turnover rates, stringent regulatory compliance, and the need to maintain financial affordability amidst rising operational overheads. Strategic navigation through these factors is crucial for providers to capitalize on the expanding opportunities and deliver high-quality academic programs.

What will be the Size of the Early Childhood Education Market during the forecast period?

Get Key Insights on Market Forecast (PDF) Request Free Sample

How is the Early Childhood Education Market Segmented?

The early childhood education industry research report provides comprehensive data (region-wise segment analysis), with forecasts and estimates in "USD million" for the period 2026-2030, as well as historical data from 2020-2024 for the following segments.
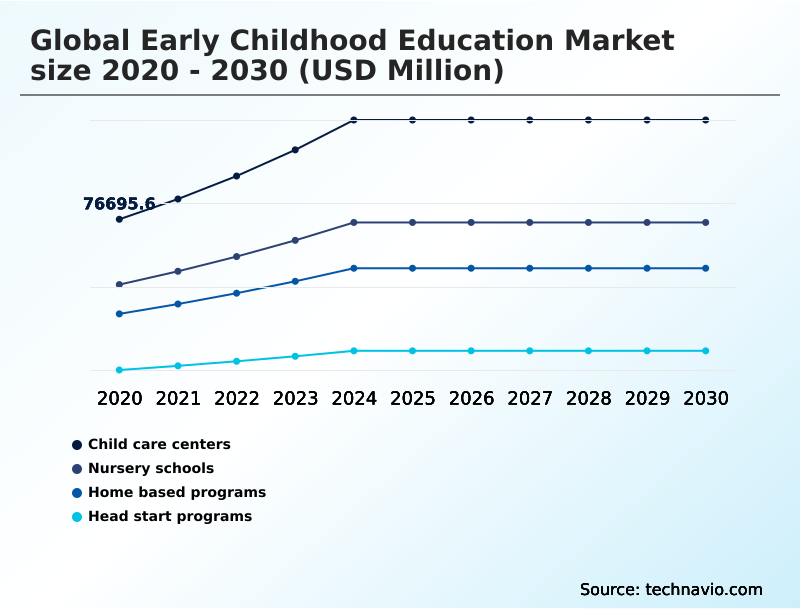
  • Type
    • Child care centers
    • Nursery schools
    • Home based programs
    • Head start programs
  • Age group
    • Children aged 3 to 6 years
    • Children below 3 years
    • Children aged 5 to 8 Years
  • Channel
    • Offline
    • Hybrid
    • Online
  • Geography
    • North America
      • US
      • Canada
      • Mexico
    • Europe
      • France
      • Germany
      • UK
    • APAC
      • China
      • India
      • Japan
    • South America
      • Brazil
      • Argentina
      • Colombia
    • Middle East and Africa
      • Saudi Arabia
      • UAE
      • South Africa
    • Rest of World (ROW)

By Type Insights

The child care centers segment is estimated to witness significant growth during the forecast period.

Child care centers are evolving from custodial care to vital hubs for early learning, offering comprehensive instructional services and academic programs.

These institutions are foundational for children's cognitive development and social development, utilizing robust pedagogical frameworks to prepare them for formal schooling.

The integration of adaptive AI in education is transforming these centers, with data analytics for child development enabling personalized learning that can boost engagement by over 30%.

As essential infrastructure for working families, these centers blend structured learning with developmental play, addressing the holistic needs of young learners.

The continuous professionalization of this segment underscores its critical role in the broader educational ecosystem, focusing on measurable outcomes and consistent quality of service delivery.

Request Free Sample

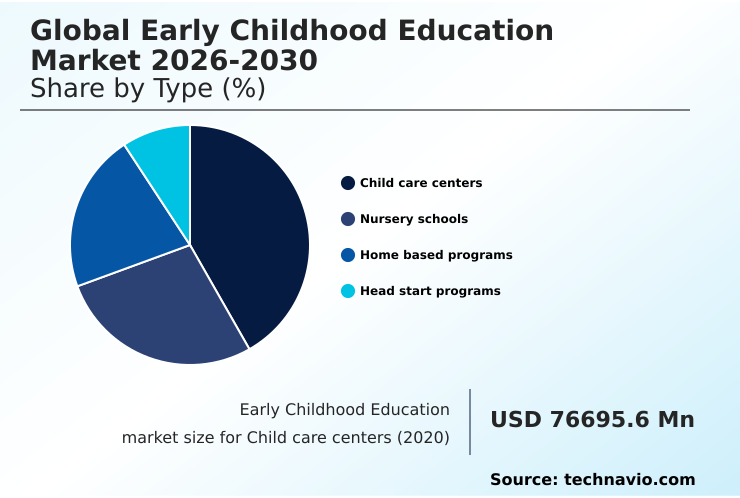
The Child care centers segment was valued at USD 116.03 billion in 2024 and showed a gradual increase during the forecast period.

Request Free Sample

Regional Analysis

North America is estimated to contribute 36.6% to the growth of the global market during the forecast period.Technavio’s analysts have elaborately explained the regional trends and drivers that shape the market during the forecast period.

See How Early Childhood Education Market Demand is Rising in North America Request Free Sample

The geographic landscape of the market is heavily influenced by regional policies on financial affordability and the structure of public-private partnerships. In North America, operational overheads are a primary concern, driving a focus on efficiency.

APAC is characterized by the rapid adoption of national curricula and extensive professional development programs to meet rising quality demands.

European markets prioritize stringent curriculum content standards and teacher certification requirements, which can increase operating costs by up to 15% compared to less regulated regions.

Across all regions, the successful implementation of parental engagement tools and adherence to child nutrition guidelines and facility safety protocols are becoming key differentiators. These factors collectively shape investment opportunities and competitive strategies on a global scale.

Market Dynamics

Our researchers analyzed the data with 2025 as the base year, along with the key drivers, trends, and challenges. A holistic analysis of drivers will help companies refine their marketing strategies to gain a competitive advantage.

  • Strategic decision-making in the early childhood education market involves a detailed assessment of the benefits of play-based versus structured curricula. The selection directly influences pedagogical outcomes and parental satisfaction. A significant operational challenge is the impact of teacher turnover on child development, where institutions with stable staffing demonstrate up to a 20% higher rate of positive developmental outcomes in learners.
  • This has led to a thorough cost-benefit analysis of public-private partnerships in education, as governments seek sustainable models to expand access without compromising quality. Furthermore, the practicalities of implementing social-emotional learning in preschools are becoming a central focus, requiring new training modules and curriculum adjustments.
  • As technology becomes more pervasive, defining the best practices for edtech integration in early years is crucial for enhancing learning without causing digital fatigue. For corporate stakeholders, measuring ROI of corporate childcare solutions is essential to justify investment, linking a supportive employee environment to talent retention and productivity.

What are the key market drivers leading to the rise in the adoption of Early Childhood Education Industry?
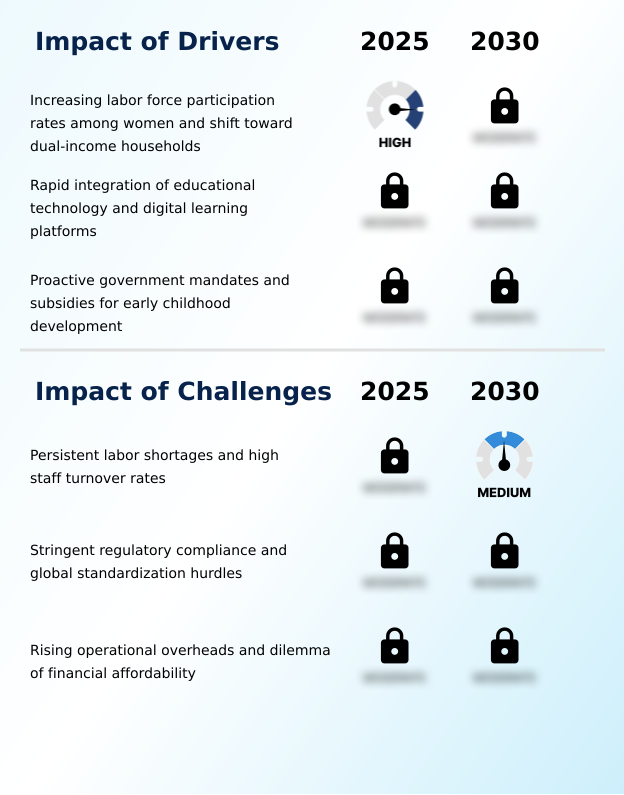
  • The market's primary driver is the increasing labor force participation rate among women and the corresponding shift toward dual-income households, which elevates the demand for formal education services.

  • Key drivers are propelling the market's growth, led by the adoption of edtech integration strategies that enhance holistic development models.
  • The implementation of AI-driven developmental tracking provides granular insights, allowing for the creation of highly personalized learning paths that improve developmental outcomes by an average of 20%.
  • A significant push toward social-emotional learning and holistic well-being programs is also expanding service offerings. Furthermore, the focus on digital literacy for preschoolers is becoming a standard expectation, supported by both nature-based learning philosophies and structured screen time.
  • This technological and pedagogical synthesis has resulted in a 30% increase in the efficiency of delivering targeted educational interventions, making learning more effective and responsive to individual needs.

What are the market trends shaping the Early Childhood Education Industry?

  • The integration of adaptive AI and data analytics is becoming a cornerstone of market evolution, enabling highly personalized developmental pathways for young learners.

  • Emerging trends are reshaping the market, with a notable shift toward nature pedagogy and the forest school model. These approaches are gaining traction as alternatives to conventional indoor learning, with research showing they can improve concentration by up to 25%. Alongside this, the emphasis on emotional development and social-emotional skill building is leading to the redesign of curricula.
  • Digital learning platforms are evolving to provide more interactive educational content that supports both play-based learning and structured curricula. Institutions that effectively blend these elements are seeing a 15% increase in enrollment inquiries. This convergence of trends highlights a move toward more holistic and environmentally conscious educational experiences for young learners.

What challenges does the Early Childhood Education Industry face during its growth?

  • A key challenge affecting industry growth is the persistence of labor shortages and high staff turnover rates, which impacts the quality and stability of educational delivery.

  • The market confronts significant challenges, primarily the affordability dilemma in childcare, which is intensified by workforce stabilization in education issues. High staff turnover rates, often exceeding 30% annually in some regions, disrupt learning continuity and strain resources. Navigating global standardization hurdles for regulatory compliance, particularly around teacher-to-student ratios, adds another layer of complexity and cost.
  • Furthermore, implementing sustainability-focused curricula and promoting environmental literacy require specialized training and materials, which can increase operational costs by 10-15%. These financial and operational pressures create a difficult environment for providers aiming to deliver high-quality, accessible education while maintaining long-term viability in a competitive landscape.

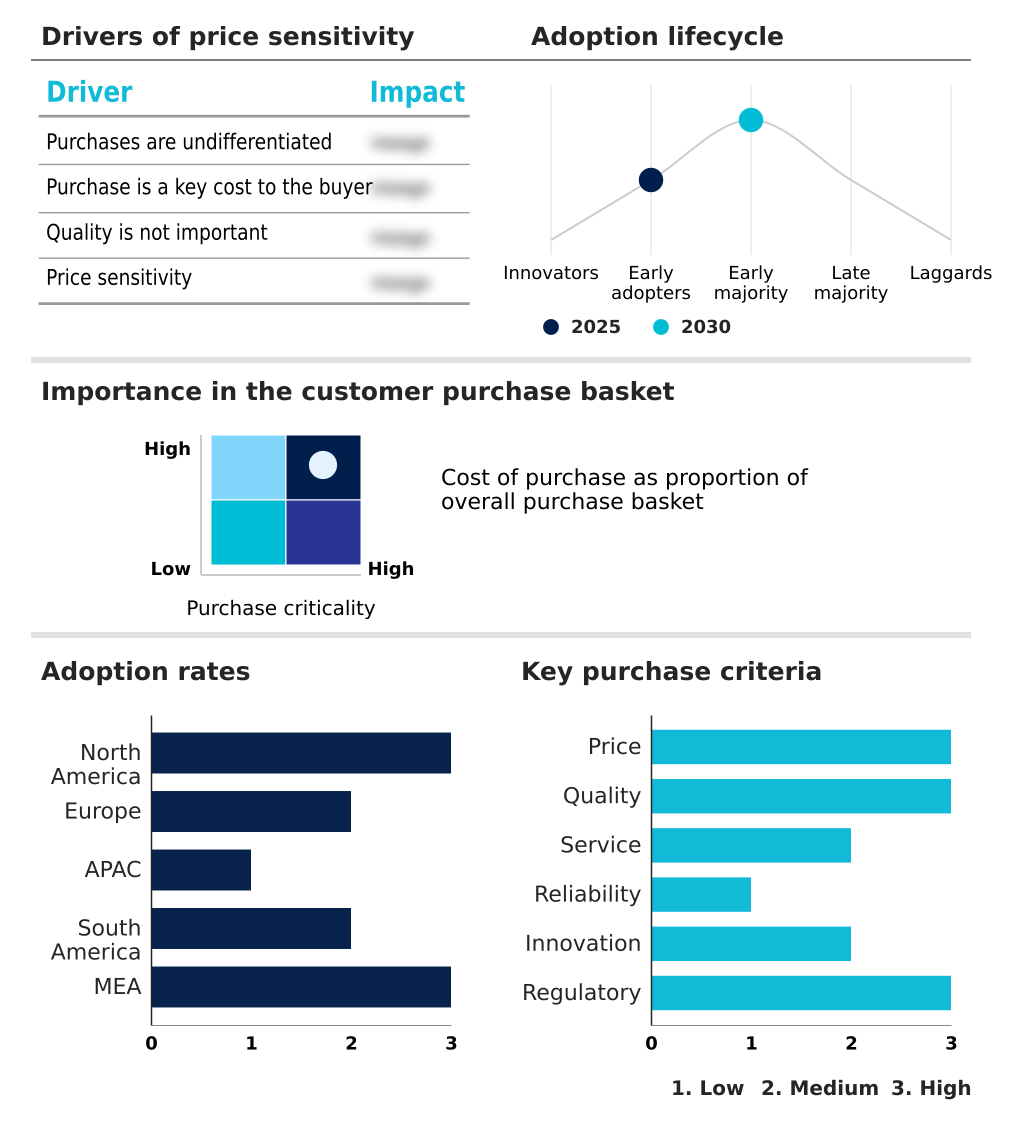
Exclusive Technavio Analysis on Customer Landscape

The early childhood education market forecasting report includes the adoption lifecycle of the market, covering from the innovator’s stage to the laggard’s stage. It focuses on adoption rates in different regions based on penetration. Furthermore, the early childhood education market report also includes key purchase criteria and drivers of price sensitivity to help companies evaluate and develop their market growth analysis strategies.

Customer Landscape of Early Childhood Education Industry

Competitive Landscape

Companies are implementing various strategies, such as strategic alliances, early childhood education market forecast, partnerships, mergers and acquisitions, geographical expansion, and product/service launches, to enhance their presence in the industry.

Age of Learning Inc. - Analysis indicates offerings centered on research-based curricula, integrating social, emotional, and cognitive development through digital platforms and play-based learning solutions to promote school readiness.

The industry research and growth report includes detailed analyses of the competitive landscape of the market and information about key companies, including:

  • Age of Learning Inc.
  • Bright Horizons Family Solutions
  • Busy Bees Holdings Ltd
  • Cognita Schools
  • Discovery Education Inc.
  • Frog Street Press LLC
  • GEMS Group Holdings Ltd.
  • Goddard Franchisor LLC
  • Houghton Mifflin Harcourt Co.
  • Kiddie Academy Educational Child
  • Kide Science
  • KiwiCo Inc.
  • Kumon North America Inc.
  • Learning Care Group Inc.
  • LEGO System AS
  • Nord Anglia Education Ltd.
  • Primrose School Franchising
  • Scholastic Corp.
  • Spring Education Group
  • Teaching Strategies LLC

Qualitative and quantitative analysis of companies has been conducted to help clients understand the wider business environment as well as the strengths and weaknesses of key industry players. Data is qualitatively analyzed to categorize companies as pure play, category-focused, industry-focused, and diversified; it is quantitatively analyzed to categorize companies as dominant, leading, strong, tentative, and weak.

Recent Development and News in Early childhood education market

  • In May 2025, the United States Department of Health and Human Services announced a federal initiative to expand licensed childcare availability in urban areas, supporting working mothers in key sectors.
  • In April 2025, the National Union of Teachers in the United Kingdom held sessions to address the exodus of qualified staff from the early years sector, highlighting the need for pay scale reforms.
  • In March 2025, the Ministry of Health and Education in Australia unveiled the Resilience First initiative, a nationwide curriculum for preschoolers focused on emotional regulation and stress management.
  • In March 2025, the Department of Education in the United States introduced the National Early Learning Excellence Framework, setting new benchmarks for integrating digital literacy and emotional intelligence in preschools.

Dive into Technavio’s robust research methodology, blending expert interviews, extensive data synthesis, and validated models for unparalleled Early Childhood Education Market insights. See full methodology.

Market Scope
Page number 296
Base year 2025
Historic period 2020-2024
Forecast period 2026-2030
Growth momentum & CAGR Accelerate at a CAGR of 11.5%
Market growth 2026-2030 USD 218954.7 million
Market structure Fragmented
YoY growth 2025-2026(%) 11.0%
Key countries US, Canada, Mexico, France, Germany, UK, Italy, Spain, The Netherlands, China, India, Japan, Australia, South Korea, Indonesia, Brazil, Argentina, Colombia, Saudi Arabia, UAE, South Africa, Israel and Turkey
Competitive landscape Leading Companies, Market Positioning of Companies, Competitive Strategies, and Industry Risks

Request Free Sample

Research Analyst Overview

  • The early childhood education market is defined by a complex interplay of pedagogical frameworks and instructional services designed to advance cognitive, social, and emotional development. Providers are increasingly adopting holistic development models that blend structured curricula with play-based learning.
  • This shift is supported by the integration of digital learning platforms offering interactive educational content and enabling personalized learning paths through AI-driven developmental tracking. A boardroom-level focus on regulatory compliance now extends to sustainability-focused curricula and environmental literacy, impacting operational overheads.
  • Institutions that effectively manage teacher-to-student ratios and mitigate high staff turnover rates through robust professional development programs have reported a 25% increase in parent satisfaction scores. Success hinges on navigating the dual pressures of maintaining financial affordability and adhering to evolving national curricula.
  • Strategic public-private partnerships are emerging as a key mechanism to address these challenges, fostering innovation in both academic programs and social-emotional learning initiatives, including nature-based learning.

What are the Key Data Covered in this Early Childhood Education Market Research and Growth Report?

  • What is the expected growth of the Early Childhood Education Market between 2026 and 2030?

    • USD 218.95 billion, at a CAGR of 11.5%

  • What segmentation does the market report cover?

    • The report is segmented by Type (Child care centers, Nursery schools, Home based programs, and Head start programs), Age Group (Children aged 3 to 6 years, Children below 3 years, and Children aged 5 to 8 Years), Channel (Offline, Hybrid, and Online) and Geography (North America, Europe, APAC, South America, Middle East and Africa)

  • Which regions are analyzed in the report?

    • North America, Europe, APAC, South America and Middle East and Africa

  • What are the key growth drivers and market challenges?

    • Increasing labor force participation rates among women and shift toward dual-income households, Persistent labor shortages and high staff turnover rates

  • Who are the major players in the Early Childhood Education Market?

    • Age of Learning Inc., Bright Horizons Family Solutions, Busy Bees Holdings Ltd, Cognita Schools, Discovery Education Inc., Frog Street Press LLC, GEMS Group Holdings Ltd., Goddard Franchisor LLC, Houghton Mifflin Harcourt Co., Kiddie Academy Educational Child, Kide Science, KiwiCo Inc., Kumon North America Inc., Learning Care Group Inc., LEGO System AS, Nord Anglia Education Ltd., Primrose School Franchising, Scholastic Corp., Spring Education Group and Teaching Strategies LLC

Market Research Insights

  • The market is shaped by the adoption of sophisticated parental engagement tools and a focus on child nutrition guidelines. Providers implementing data analytics for child development have seen a 15% improvement in identifying developmental delays early. Concurrently, the push for digital literacy for preschoolers through adaptive AI in education has resulted in a 20% increase in student engagement metrics.
  • However, navigating facility safety protocols and complex teacher certification requirements remains a significant operational focus. Centers that successfully integrate edtech integration strategies report a 10% reduction in administrative workload, allowing educators to focus on high-value interactions. The landscape requires a balance between innovation and strict adherence to established standards.

We can help! Our analysts can customize this early childhood education market research report to meet your requirements.

Get in touch

1. Executive Summary

1.1 Market overview

Executive Summary - Chart on Market Overview
Executive Summary - Data Table on Market Overview
Executive Summary - Chart on Global Market Characteristics
Executive Summary - Chart on Market by Geography
Executive Summary - Chart on Market Segmentation by Type
Executive Summary - Chart on Market Segmentation by Age Group
Executive Summary - Chart on Market Segmentation by Channel
Executive Summary - Chart on Incremental Growth
Executive Summary - Data Table on Incremental Growth
Executive Summary - Chart on Company Market Positioning

2. Technavio Analysis

2.1 Analysis of price sensitivity, lifecycle, customer purchase basket, adoption rates, and purchase criteria

2.2 Criticality of inputs and Factors of differentiation

Chart on Overview on criticality of inputs and factors of differentiation

2.3 Factors of disruption

Chart on Overview on factors of disruption

2.4 Impact of drivers and challenges

Chart on Impact of drivers and challenges in 2025 and 2030

3. Market Landscape

3.1 Market ecosystem

Chart on Parent Market
Data Table on - Parent Market

3.2 Market characteristics

Chart on Market characteristics analysis

3.3 Value chain analysis

Chart on Value chain analysis

4. Market Sizing

4.1 Market definition

Data Table on Offerings of companies included in the market definition

4.2 Market segment analysis

Market segments

4.3 Market size 2025

4.4 Market outlook: Forecast for 2025-2030

Chart on Global - Market size and forecast 2025-2030 ($ million)
Data Table on Global - Market size and forecast 2025-2030 ($ million)
Chart on Global Market: Year-over-year growth 2025-2030 (%)
Data Table on Global Market: Year-over-year growth 2025-2030 (%)

5. Historic Market Size

5.1 Global Early Childhood Education Market 2020 - 2024

Historic Market Size - Data Table on Global Early Childhood Education Market 2020 - 2024 ($ million)

5.2 Type segment analysis 2020 - 2024

Historic Market Size - Type Segment 2020 - 2024 ($ million)

5.3 Age Group segment analysis 2020 - 2024

Historic Market Size - Age Group Segment 2020 - 2024 ($ million)

5.4 Channel segment analysis 2020 - 2024

Historic Market Size - Channel Segment 2020 - 2024 ($ million)

5.5 Geography segment analysis 2020 - 2024

Historic Market Size - Geography Segment 2020 - 2024 ($ million)

5.6 Country segment analysis 2020 - 2024

Historic Market Size - Country Segment 2020 - 2024 ($ million)

6. Qualitative Analysis

6.1 The AI impact on Global Early Childhood Education Market

6.2 Impact of geopolitical conflicts on Global Early Childhood Education Market

7. Five Forces Analysis

7.1 Five forces summary

Five forces analysis - Comparison between 2025 and 2030

7.2 Bargaining power of buyers

Bargaining power of buyers - Impact of key factors 2025 and 2030

7.3 Bargaining power of suppliers

Bargaining power of suppliers - Impact of key factors in 2025 and 2030

7.4 Threat of new entrants

Threat of new entrants - Impact of key factors in 2025 and 2030

7.5 Threat of substitutes

Threat of substitutes - Impact of key factors in 2025 and 2030

7.6 Threat of rivalry

Threat of rivalry - Impact of key factors in 2025 and 2030

7.7 Market condition

Chart on Market condition - Five forces 2025 and 2030

8. Market Segmentation by Type

8.1 Market segments

Chart on Type - Market share 2025-2030 (%)
Data Table on Type - Market share 2025-2030 (%)

8.2 Comparison by Type

Chart on Comparison by Type
Data Table on Comparison by Type

8.3 Child care centers - Market size and forecast 2025-2030

Chart on Child care centers - Market size and forecast 2025-2030 ($ million)
Data Table on Child care centers - Market size and forecast 2025-2030 ($ million)
Chart on Child care centers - Year-over-year growth 2025-2030 (%)
Data Table on Child care centers - Year-over-year growth 2025-2030 (%)

8.4 Nursery schools - Market size and forecast 2025-2030

Chart on Nursery schools - Market size and forecast 2025-2030 ($ million)
Data Table on Nursery schools - Market size and forecast 2025-2030 ($ million)
Chart on Nursery schools - Year-over-year growth 2025-2030 (%)
Data Table on Nursery schools - Year-over-year growth 2025-2030 (%)

8.5 Home based programs - Market size and forecast 2025-2030

Chart on Home based programs - Market size and forecast 2025-2030 ($ million)
Data Table on Home based programs - Market size and forecast 2025-2030 ($ million)
Chart on Home based programs - Year-over-year growth 2025-2030 (%)
Data Table on Home based programs - Year-over-year growth 2025-2030 (%)

8.6 Head start programs - Market size and forecast 2025-2030

Chart on Head start programs - Market size and forecast 2025-2030 ($ million)
Data Table on Head start programs - Market size and forecast 2025-2030 ($ million)
Chart on Head start programs - Year-over-year growth 2025-2030 (%)
Data Table on Head start programs - Year-over-year growth 2025-2030 (%)

8.7 Market opportunity by Type

Market opportunity by Type ($ million)
Data Table on Market opportunity by Type ($ million)

9. Market Segmentation by Age Group

9.1 Market segments

Chart on Age Group - Market share 2025-2030 (%)
Data Table on Age Group - Market share 2025-2030 (%)

9.2 Comparison by Age Group

Chart on Comparison by Age Group
Data Table on Comparison by Age Group

9.3 Children aged 3 to 6 years - Market size and forecast 2025-2030

Chart on Children aged 3 to 6 years - Market size and forecast 2025-2030 ($ million)
Data Table on Children aged 3 to 6 years - Market size and forecast 2025-2030 ($ million)
Chart on Children aged 3 to 6 years - Year-over-year growth 2025-2030 (%)
Data Table on Children aged 3 to 6 years - Year-over-year growth 2025-2030 (%)

9.4 Children below 3 years - Market size and forecast 2025-2030

Chart on Children below 3 years - Market size and forecast 2025-2030 ($ million)
Data Table on Children below 3 years - Market size and forecast 2025-2030 ($ million)
Chart on Children below 3 years - Year-over-year growth 2025-2030 (%)
Data Table on Children below 3 years - Year-over-year growth 2025-2030 (%)

9.5 Children aged 5 to 8 Years - Market size and forecast 2025-2030

Chart on Children aged 5 to 8 Years - Market size and forecast 2025-2030 ($ million)
Data Table on Children aged 5 to 8 Years - Market size and forecast 2025-2030 ($ million)
Chart on Children aged 5 to 8 Years - Year-over-year growth 2025-2030 (%)
Data Table on Children aged 5 to 8 Years - Year-over-year growth 2025-2030 (%)

9.6 Market opportunity by Age Group

Market opportunity by Age Group ($ million)
Data Table on Market opportunity by Age Group ($ million)

10. Market Segmentation by Channel

10.1 Market segments

Chart on Channel - Market share 2025-2030 (%)
Data Table on Channel - Market share 2025-2030 (%)

10.2 Comparison by Channel

Chart on Comparison by Channel
Data Table on Comparison by Channel

10.3 Offline - Market size and forecast 2025-2030

Chart on Offline - Market size and forecast 2025-2030 ($ million)
Data Table on Offline - Market size and forecast 2025-2030 ($ million)
Chart on Offline - Year-over-year growth 2025-2030 (%)
Data Table on Offline - Year-over-year growth 2025-2030 (%)

10.4 Hybrid - Market size and forecast 2025-2030

Chart on Hybrid - Market size and forecast 2025-2030 ($ million)
Data Table on Hybrid - Market size and forecast 2025-2030 ($ million)
Chart on Hybrid - Year-over-year growth 2025-2030 (%)
Data Table on Hybrid - Year-over-year growth 2025-2030 (%)

10.5 Online - Market size and forecast 2025-2030

Chart on Online - Market size and forecast 2025-2030 ($ million)
Data Table on Online - Market size and forecast 2025-2030 ($ million)
Chart on Online - Year-over-year growth 2025-2030 (%)
Data Table on Online - Year-over-year growth 2025-2030 (%)

10.6 Market opportunity by Channel

Market opportunity by Channel ($ million)
Data Table on Market opportunity by Channel ($ million)

11. Customer Landscape

11.1 Customer landscape overview

Analysis of price sensitivity, lifecycle, customer purchase basket, adoption rates, and purchase criteria

12. Geographic Landscape

12.1 Geographic segmentation

Chart on Market share by geography 2025-2030 (%)
Data Table on Market share by geography 2025-2030 (%)

12.2 Geographic comparison

Chart on Geographic comparison
Data Table on Geographic comparison

12.3 North America - Market size and forecast 2025-2030

Chart on North America - Market size and forecast 2025-2030 ($ million)
Data Table on North America - Market size and forecast 2025-2030 ($ million)
Chart on North America - Year-over-year growth 2025-2030 (%)
Data Table on North America - Year-over-year growth 2025-2030 (%)
Chart on Regional Comparison - North America
Data Table on Regional Comparison - North America

12.3.1 US - Market size and forecast 2025-2030

Chart on US - Market size and forecast 2025-2030 ($ million)
Data Table on US - Market size and forecast 2025-2030 ($ million)
Chart on US - Year-over-year growth 2025-2030 (%)
Data Table on US - Year-over-year growth 2025-2030 (%)

12.3.2 Canada - Market size and forecast 2025-2030

Chart on Canada - Market size and forecast 2025-2030 ($ million)
Data Table on Canada - Market size and forecast 2025-2030 ($ million)
Chart on Canada - Year-over-year growth 2025-2030 (%)
Data Table on Canada - Year-over-year growth 2025-2030 (%)

12.3.3 Mexico - Market size and forecast 2025-2030

Chart on Mexico - Market size and forecast 2025-2030 ($ million)
Data Table on Mexico - Market size and forecast 2025-2030 ($ million)
Chart on Mexico - Year-over-year growth 2025-2030 (%)
Data Table on Mexico - Year-over-year growth 2025-2030 (%)

12.4 Europe - Market size and forecast 2025-2030

Chart on Europe - Market size and forecast 2025-2030 ($ million)
Data Table on Europe - Market size and forecast 2025-2030 ($ million)
Chart on Europe - Year-over-year growth 2025-2030 (%)
Data Table on Europe - Year-over-year growth 2025-2030 (%)
Chart on Regional Comparison - Europe
Data Table on Regional Comparison - Europe

12.4.1 France - Market size and forecast 2025-2030

Chart on France - Market size and forecast 2025-2030 ($ million)
Data Table on France - Market size and forecast 2025-2030 ($ million)
Chart on France - Year-over-year growth 2025-2030 (%)
Data Table on France - Year-over-year growth 2025-2030 (%)

12.4.2 Germany - Market size and forecast 2025-2030

Chart on Germany - Market size and forecast 2025-2030 ($ million)
Data Table on Germany - Market size and forecast 2025-2030 ($ million)
Chart on Germany - Year-over-year growth 2025-2030 (%)
Data Table on Germany - Year-over-year growth 2025-2030 (%)

12.4.3 UK - Market size and forecast 2025-2030

Chart on UK - Market size and forecast 2025-2030 ($ million)
Data Table on UK - Market size and forecast 2025-2030 ($ million)
Chart on UK - Year-over-year growth 2025-2030 (%)
Data Table on UK - Year-over-year growth 2025-2030 (%)

12.4.4 Italy - Market size and forecast 2025-2030

Chart on Italy - Market size and forecast 2025-2030 ($ million)
Data Table on Italy - Market size and forecast 2025-2030 ($ million)
Chart on Italy - Year-over-year growth 2025-2030 (%)
Data Table on Italy - Year-over-year growth 2025-2030 (%)

12.4.5 Spain - Market size and forecast 2025-2030

Chart on Spain - Market size and forecast 2025-2030 ($ million)
Data Table on Spain - Market size and forecast 2025-2030 ($ million)
Chart on Spain - Year-over-year growth 2025-2030 (%)
Data Table on Spain - Year-over-year growth 2025-2030 (%)

12.4.6 The Netherlands - Market size and forecast 2025-2030

Chart on The Netherlands - Market size and forecast 2025-2030 ($ million)
Data Table on The Netherlands - Market size and forecast 2025-2030 ($ million)
Chart on The Netherlands - Year-over-year growth 2025-2030 (%)
Data Table on The Netherlands - Year-over-year growth 2025-2030 (%)

12.5 APAC - Market size and forecast 2025-2030

Chart on APAC - Market size and forecast 2025-2030 ($ million)
Data Table on APAC - Market size and forecast 2025-2030 ($ million)
Chart on APAC - Year-over-year growth 2025-2030 (%)
Data Table on APAC - Year-over-year growth 2025-2030 (%)
Chart on Regional Comparison - APAC
Data Table on Regional Comparison - APAC

12.5.1 China - Market size and forecast 2025-2030

Chart on China - Market size and forecast 2025-2030 ($ million)
Data Table on China - Market size and forecast 2025-2030 ($ million)
Chart on China - Year-over-year growth 2025-2030 (%)
Data Table on China - Year-over-year growth 2025-2030 (%)

12.5.2 India - Market size and forecast 2025-2030

Chart on India - Market size and forecast 2025-2030 ($ million)
Data Table on India - Market size and forecast 2025-2030 ($ million)
Chart on India - Year-over-year growth 2025-2030 (%)
Data Table on India - Year-over-year growth 2025-2030 (%)

12.5.3 Japan - Market size and forecast 2025-2030

Chart on Japan - Market size and forecast 2025-2030 ($ million)
Data Table on Japan - Market size and forecast 2025-2030 ($ million)
Chart on Japan - Year-over-year growth 2025-2030 (%)
Data Table on Japan - Year-over-year growth 2025-2030 (%)

12.5.4 Australia - Market size and forecast 2025-2030

Chart on Australia - Market size and forecast 2025-2030 ($ million)
Data Table on Australia - Market size and forecast 2025-2030 ($ million)
Chart on Australia - Year-over-year growth 2025-2030 (%)
Data Table on Australia - Year-over-year growth 2025-2030 (%)

12.5.5 South Korea - Market size and forecast 2025-2030

Chart on South Korea - Market size and forecast 2025-2030 ($ million)
Data Table on South Korea - Market size and forecast 2025-2030 ($ million)
Chart on South Korea - Year-over-year growth 2025-2030 (%)
Data Table on South Korea - Year-over-year growth 2025-2030 (%)

12.5.6 Indonesia - Market size and forecast 2025-2030

Chart on Indonesia - Market size and forecast 2025-2030 ($ million)
Data Table on Indonesia - Market size and forecast 2025-2030 ($ million)
Chart on Indonesia - Year-over-year growth 2025-2030 (%)
Data Table on Indonesia - Year-over-year growth 2025-2030 (%)

12.6 South America - Market size and forecast 2025-2030

Chart on South America - Market size and forecast 2025-2030 ($ million)
Data Table on South America - Market size and forecast 2025-2030 ($ million)
Chart on South America - Year-over-year growth 2025-2030 (%)
Data Table on South America - Year-over-year growth 2025-2030 (%)
Chart on Regional Comparison - South America
Data Table on Regional Comparison - South America

12.6.1 Brazil - Market size and forecast 2025-2030

Chart on Brazil - Market size and forecast 2025-2030 ($ million)
Data Table on Brazil - Market size and forecast 2025-2030 ($ million)
Chart on Brazil - Year-over-year growth 2025-2030 (%)
Data Table on Brazil - Year-over-year growth 2025-2030 (%)

12.6.2 Argentina - Market size and forecast 2025-2030

Chart on Argentina - Market size and forecast 2025-2030 ($ million)
Data Table on Argentina - Market size and forecast 2025-2030 ($ million)
Chart on Argentina - Year-over-year growth 2025-2030 (%)
Data Table on Argentina - Year-over-year growth 2025-2030 (%)

12.6.3 Colombia - Market size and forecast 2025-2030

Chart on Colombia - Market size and forecast 2025-2030 ($ million)
Data Table on Colombia - Market size and forecast 2025-2030 ($ million)
Chart on Colombia - Year-over-year growth 2025-2030 (%)
Data Table on Colombia - Year-over-year growth 2025-2030 (%)

12.7 Middle East and Africa - Market size and forecast 2025-2030

Chart on Middle East and Africa - Market size and forecast 2025-2030 ($ million)
Data Table on Middle East and Africa - Market size and forecast 2025-2030 ($ million)
Chart on Middle East and Africa - Year-over-year growth 2025-2030 (%)
Data Table on Middle East and Africa - Year-over-year growth 2025-2030 (%)
Chart on Regional Comparison - Middle East and Africa
Data Table on Regional Comparison - Middle East and Africa

12.7.1 Saudi Arabia - Market size and forecast 2025-2030

Chart on Saudi Arabia - Market size and forecast 2025-2030 ($ million)
Data Table on Saudi Arabia - Market size and forecast 2025-2030 ($ million)
Chart on Saudi Arabia - Year-over-year growth 2025-2030 (%)
Data Table on Saudi Arabia - Year-over-year growth 2025-2030 (%)

12.7.2 UAE - Market size and forecast 2025-2030

Chart on UAE - Market size and forecast 2025-2030 ($ million)
Data Table on UAE - Market size and forecast 2025-2030 ($ million)
Chart on UAE - Year-over-year growth 2025-2030 (%)
Data Table on UAE - Year-over-year growth 2025-2030 (%)

12.7.3 South Africa - Market size and forecast 2025-2030

Chart on South Africa - Market size and forecast 2025-2030 ($ million)
Data Table on South Africa - Market size and forecast 2025-2030 ($ million)
Chart on South Africa - Year-over-year growth 2025-2030 (%)
Data Table on South Africa - Year-over-year growth 2025-2030 (%)

12.7.4 Israel - Market size and forecast 2025-2030

Chart on Israel - Market size and forecast 2025-2030 ($ million)
Data Table on Israel - Market size and forecast 2025-2030 ($ million)
Chart on Israel - Year-over-year growth 2025-2030 (%)
Data Table on Israel - Year-over-year growth 2025-2030 (%)

12.7.5 Turkey - Market size and forecast 2025-2030

Chart on Turkey - Market size and forecast 2025-2030 ($ million)
Data Table on Turkey - Market size and forecast 2025-2030 ($ million)
Chart on Turkey - Year-over-year growth 2025-2030 (%)
Data Table on Turkey - Year-over-year growth 2025-2030 (%)

12.8 Market opportunity by geography

Market opportunity by geography ($ million)
Data Tables on Market opportunity by geography ($ million)

13. Drivers, Challenges, and Opportunity

13.1 Market drivers

Increasing labor force participation rates among women and shift toward dual-income households
Rapid integration of educational technology and digital learning platforms
Proactive government mandates and subsidies for early childhood development

13.2 Market challenges

Persistent labor shortages and high staff turnover rates
Stringent regulatory compliance and global standardization hurdles
Rising operational overheads and dilemma of financial affordability

13.3 Impact of drivers and challenges

Impact of drivers and challenges in 2025 and 2030

13.4 Market opportunities

Integration of adaptive AI and data analytics for personalized development
Emergence of nature-based learning and sustainability-focused curricula
Prioritization of social-emotional learning and holistic well-being

14. Competitive Landscape

14.1 Overview

14.2

Overview on criticality of inputs and factors of differentiation

14.3 Landscape disruption

Overview on factors of disruption

14.4 Industry risks

Impact of key risks on business

15. Competitive Analysis

15.1 Companies profiled

Companies covered

15.2 Company ranking index

15.3 Market positioning of companies

Matrix on companies position and classification

15.4 Age of Learning Inc.

Age of Learning Inc. - Overview
Age of Learning Inc. - Product / Service
Age of Learning Inc. - Key offerings
SWOT

15.5 Bright Horizons Family Solutions

Bright Horizons Family Solutions - Overview
Bright Horizons Family Solutions - Product / Service
Bright Horizons Family Solutions - Key offerings
SWOT

15.6 Busy Bees Holdings Ltd

Busy Bees Holdings Ltd - Overview
Busy Bees Holdings Ltd - Product / Service
Busy Bees Holdings Ltd - Key offerings
SWOT

15.7 Cognita Schools

Cognita Schools - Overview
Cognita Schools - Product / Service
Cognita Schools - Key offerings
SWOT

15.8 Discovery Education Inc.

Discovery Education Inc. - Overview
Discovery Education Inc. - Product / Service
Discovery Education Inc. - Key offerings
SWOT

15.9 Frog Street Press LLC

Frog Street Press LLC - Overview
Frog Street Press LLC - Product / Service
Frog Street Press LLC - Key offerings
SWOT

15.10 GEMS Group Holdings Ltd.

GEMS Group Holdings Ltd. - Overview
GEMS Group Holdings Ltd. - Product / Service
GEMS Group Holdings Ltd. - Key offerings
SWOT

15.11 Goddard Franchisor LLC

Goddard Franchisor LLC - Overview
Goddard Franchisor LLC - Product / Service
Goddard Franchisor LLC - Key offerings
SWOT

15.12 Houghton Mifflin Harcourt Co.

Houghton Mifflin Harcourt Co. - Overview
Houghton Mifflin Harcourt Co. - Product / Service
Houghton Mifflin Harcourt Co. - Key offerings
SWOT

15.13 Kiddie Academy Educational Child

Kiddie Academy Educational Child - Overview
Kiddie Academy Educational Child - Product / Service
Kiddie Academy Educational Child - Key offerings
SWOT

15.14 Kide Science

Kide Science - Overview
Kide Science - Product / Service
Kide Science - Key offerings
SWOT

15.15 KiwiCo Inc.

KiwiCo Inc. - Overview
KiwiCo Inc. - Product / Service
KiwiCo Inc. - Key offerings
SWOT

15.16 Kumon North America Inc.

Kumon North America Inc. - Overview
Kumon North America Inc. - Product / Service
Kumon North America Inc. - Key offerings
SWOT

15.17 Learning Care Group Inc.

Learning Care Group Inc. - Overview
Learning Care Group Inc. - Product / Service
Learning Care Group Inc. - Key offerings
SWOT

15.18 LEGO System AS

LEGO System AS - Overview
LEGO System AS - Product / Service
LEGO System AS - Key offerings
SWOT

16. Appendix

16.1 Scope of the report

Market definition
Objectives
Notes and caveats

16.2 Inclusions and exclusions checklist

Inclusions checklist
Exclusions checklist

16.3 Currency conversion rates for US$

16.4 Research methodology

16.5 Data procurement

Information sources

16.6 Data validation

16.7 Validation techniques employed for market sizing

16.8 Data synthesis

16.9 360 degree market analysis

16.10 List of abbreviations

Research Methodology

Technavio presents a detailed picture of the market by way of study, synthesis, and summation of data from multiple sources. The analysts have presented the various facets of the market with a particular focus on identifying the key industry influencers. The data thus presented is comprehensive, reliable, and the result of extensive research, both primary and secondary.

INFORMATION SOURCES

Primary sources

  • Manufacturers and suppliers
  • Channel partners
  • Industry experts
  • Strategic decision makers

Secondary sources

  • Industry journals and periodicals
  • Government data
  • Financial reports of key industry players
  • Historical data
  • Press releases

DATA ANALYSIS

Data Synthesis

  • Collation of data
  • Estimation of key figures
  • Analysis of derived insights

Data Validation

  • Triangulation with data models
  • Reference against proprietary databases
  • Corroboration with industry experts

REPORT WRITING

Qualitative

  • Market drivers
  • Market challenges
  • Market trends
  • Five forces analysis

Quantitative

  • Market size and forecast
  • Market segmentation
  • Geographical insights
  • Competitive landscape

Interested in this report?

Get your sample now to see our research methodology and insights!

Download Now

Frequently Asked Questions

Early Childhood Education market growth will increase by USD 218954.7 million during 2026-2030.

The Early Childhood Education market is expected to grow at a CAGR of 11.5% during 2026-2030.

Early Childhood Education market is segmented by Type (Child care centers, Nursery schools, Home based programs, Head start programs) Age group (Children aged 3 to 6 years, Children below 3 years, Children aged 5 to 8 Years) Channel (Offline, Hybrid, Online)

Age of Learning Inc., Bright Horizons Family Solutions, Busy Bees Holdings Ltd, Cognita Schools, Discovery Education Inc., Frog Street Press LLC, GEMS Group Holdings Ltd., Goddard Franchisor LLC, Houghton Mifflin Harcourt Co., Kiddie Academy Educational Child, Kide Science, KiwiCo Inc., Kumon North America Inc., Learning Care Group Inc., LEGO System AS, Nord Anglia Education Ltd., Primrose School Franchising, Scholastic Corp., Spring Education Group, Teaching Strategies LLC are a few of the key vendors in the Early Childhood Education market.

North America will register the highest growth rate of 36.6% among the other regions. Therefore, the Early Childhood Education market in North America is expected to garner significant business opportunities for the vendors during the forecast period.

US, Canada, Mexico, France, Germany, UK, Italy, Spain, The Netherlands, China, India, Japan, Australia, South Korea, Indonesia, Brazil, Argentina, Colombia, Saudi Arabia, UAE, South Africa, Israel, Turkey

  • Increasing labor force participation rates among women and shift toward dual-income households is the driving factor this market.

The Early Childhood Education market vendors should focus on grabbing business opportunities from the Type segment as it accounted for the largest market share in the base year.
RIA - Research AI Assistant
Ask RIA