Electric Kick Scooter Market Analysis, Size, and Forecast 2026-2030: Europe (Germany, UK, and France), North America (US, Canada, and Mexico), APAC (China, Japan, and India), South America (Brazil, Argentina, and Chile), Middle East and Africa (Saudi Arabia, UAE, and South Africa), and Rest of World (ROW)

Electric Kick Scooter Market Analysis, Size, and Forecast 2026-2030:
Europe (Germany, UK, and France), North America (US, Canada, and Mexico), APAC (China, Japan, and India), South America (Brazil, Argentina, and Chile), Middle East and Africa (Saudi Arabia, UAE, and South Africa), and Rest of World (ROW)

Published: Oct 2026 281 Pages SKU: IRTNTR73809

Market Overview at a Glance

$2.80 B
Market Opportunity
12.3%
CAGR 2025 - 2030
45.5%
Europe Growth
$1.52 B
25v to 50v segment 2024

Electric Kick Scooter Market Size 2026-2030

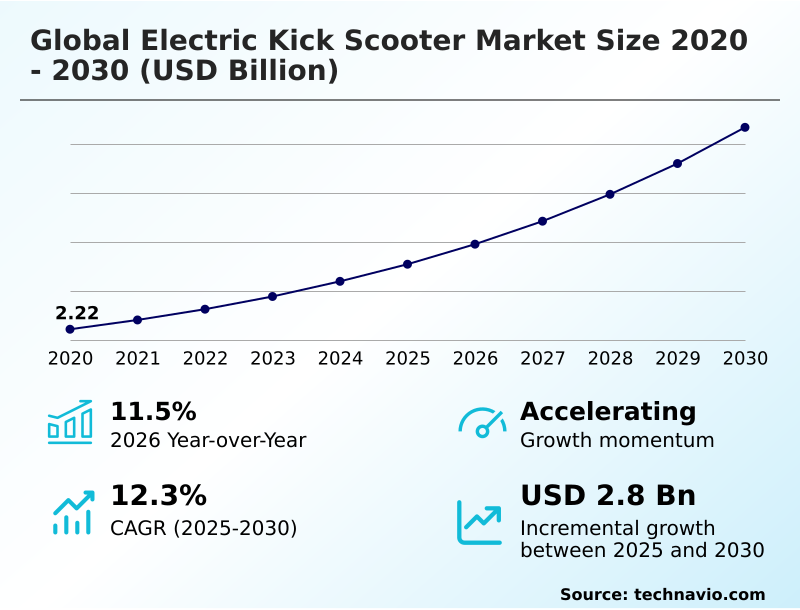
The electric kick scooter market size is valued to increase by USD 2.80 billion, at a CAGR of 12.3% from 2025 to 2030. Increasing incentives and subsidies by governments will drive the electric kick scooter market.

Major Market Trends & Insights

  • Europe dominated the market and accounted for a 45.5% growth during the forecast period.
  • By Variant - 25v to 50v segment was valued at USD 1.52 billion in 2024
  • By Product Type - Two wheeled segment accounted for the largest market revenue share in 2024

Market Size & Forecast

  • Market Opportunities: USD 4.13 billion
  • Market Future Opportunities: USD 2.80 billion
  • CAGR from 2025 to 2030 : 12.3%

Market Summary

  • The Electric Kick Scooter Market functions as a critical component of modern urban transit, continuously evolving to address last-mile connectivity requirements. Operational efficiency relies heavily on advanced component engineering and a robust regenerative braking system to maximize fleet uptime.
  • For example, fleet operators implementing digital location tracking and battery diagnostics have successfully increased daily vehicle utilization, reducing idle time by 22% compared to unmonitored fleets. Expanding government subsidies for sustainable transport serve as a major driver, directly reducing consumer acquisition costs and accelerating widespread adoption.
  • Conversely, the lack of dedicated parking and charging stations acts as a structural challenge, increasing vehicle retrieval expenses and limiting deployment density in emerging metropolitan zones. Commuter preferences continue shifting toward the portable transit solution equipped with an anti-theft immobilizer and advanced drive mechanisms. These technological integrations ensure that operators maintain compliance while satisfying consumer demands for reliable, eco-friendly transit.

What will be the Size of the Electric Kick Scooter Market during the forecast period?
Get Key Insights on Market Forecast (PDF) Get Free Sample

How is the Electric Kick Scooter Market Segmented?

The electric kick scooter industry research report provides comprehensive data (region-wise segment analysis), with forecasts and estimates in "USD million" for the period 2026-2030, as well as historical data from 2020-2024 for the following segments.

  • Variant
    • 25v to 50v
    • Less than 25v
    • More than 50v
  • Product type
    • Two wheeled
    • Three wheeled
  • Application
    • Personal
    • Rental
  • Geography
    • Europe
      • Germany
      • UK
      • France
      • Italy
      • Spain
      • The Netherlands
    • North America
      • US
      • Canada
      • Mexico
    • APAC
      • China
      • Japan
      • India
      • South Korea
      • Australia
      • Indonesia
    • South America
      • Brazil
      • Argentina
      • Chile
    • Middle East and Africa
      • Saudi Arabia
      • UAE
      • South Africa
      • Israel
      • Turkey

By Variant Insights

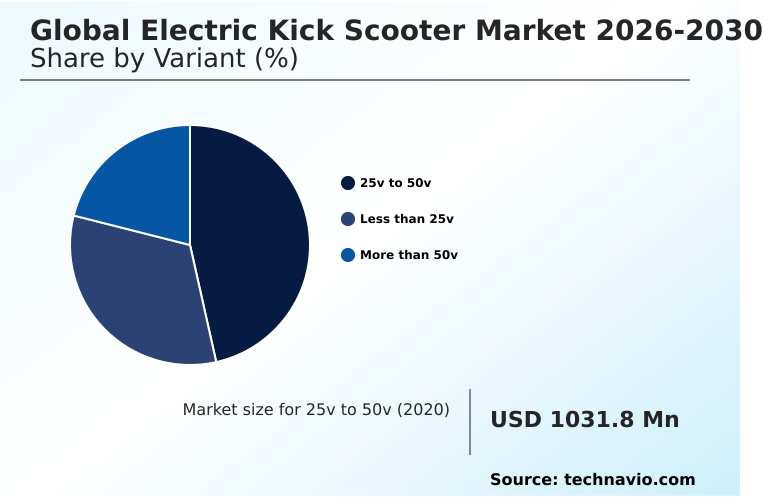
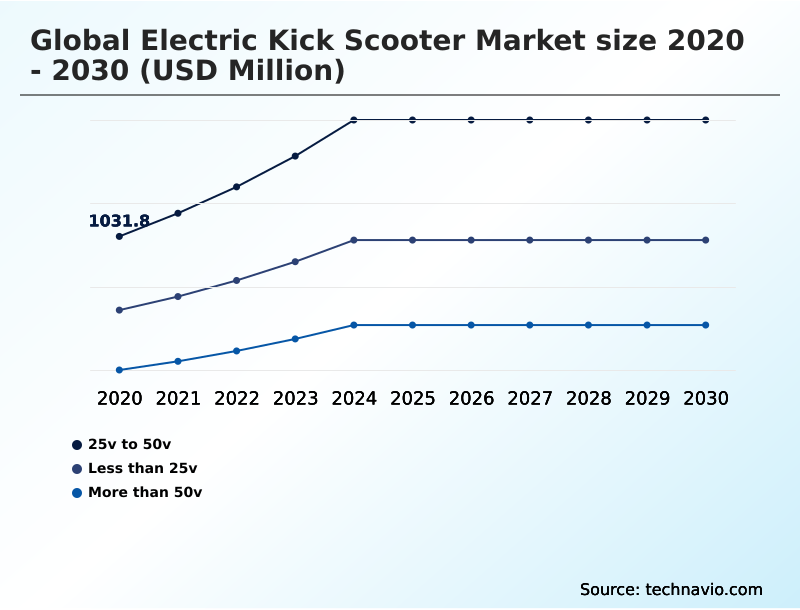
The 25v to 50v segment is estimated to witness significant growth during the forecast period.

The 25v to 50v segment within the Electric Kick Scooter landscape balances operational capability and cost-efficiency.

Commuter models utilizing a lithium-ion battery integration and a smart battery management system maintain consistent voltage output, reducing peak power degradation by 15% compared to lower-voltage alternatives.

This specific electrical configuration supports enhanced urban transit operations and robust propulsion setups, ideal for navigating varied urban topographies. Operators adopting this voltage architecture benefit from a foldable chassis design and improved urban commuting efficiency.

This tier optimizes energy distribution and zero-emission transportation metrics. The segment addresses daily mobility requirements by offering an ideal blend of reliable performance and compact storage capability without the elevated thermal challenges of higher-capacity units.
Get Free Sample

The 25v to 50v segment was valued at USD 1.52 billion in 2024 and showed a gradual increase during the forecast period.
Get Free Sample

Regional Analysis

Europe is estimated to contribute 45.5% to the growth of the global market during the forecast period.Technavio’s analysts have elaborately explained the regional trends and drivers that shape the market during the forecast period.
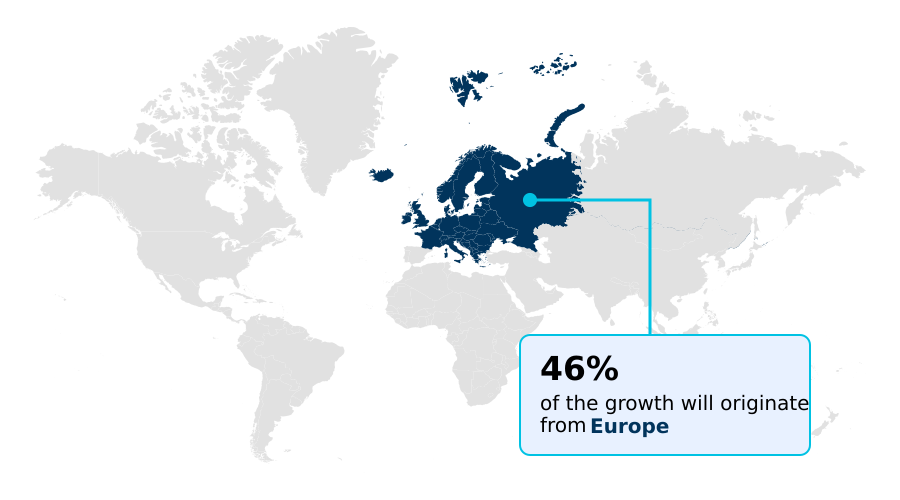
See How Electric Kick Scooter Market Demand is Rising in Europe Get Free Sample

Regional disparities in the Electric Kick Scooter landscape stem from varying urban planning frameworks and regulatory structures. Europe leads in deployment efficiency, where stringent geofencing compliance protocol mandates have reduced municipal parking violations by 30%.

This region benefits from extensive dedicated cycle lanes, allowing operators to optimize low-maintenance drivetrain configurations and achieve a 15% reduction in overall fleet servicing costs.

In contrast, adoption in North America focuses heavily on high-torque applications tailored for dispersed urban centers, prioritizing kinetic energy recovery to extend travel range.

Manufacturers operating in Europe utilize aerospace-grade aluminum frame structures to meet strict weight and safety standards, whereas North American fleets prioritize enhanced payload capacity optimization.

This divergence requires vendors to localize their supply chains, balancing aerodynamic drag reduction with localized regulatory requirements to maintain profitability across different operational zones.

Market Dynamics

Our researchers analyzed the data with 2025 as the base year, along with the key drivers, trends, and challenges. A holistic analysis of drivers will help companies refine their marketing strategies to gain a competitive advantage.

  • The operational architecture of the Electric Kick Scooter continues to undergo significant optimization to support high-frequency urban usage. Fleet managers evaluating procurement strategies increasingly prioritize last-mile urban commuting solutions that deliver measurable reductions in daily logistical overhead.
  • By implementing smart battery management system integration, operators can monitor cell health and thermal loads remotely, extending asset lifecycles and decreasing hardware replacement intervals by approximately 25% compared to legacy monitoring frameworks. This functional shift requires a robust hardware foundation, driving the industry toward the adoption of a lightweight aerospace-grade aluminum chassis that balances structural integrity with necessary portability.
  • Furthermore, municipal authorities increasingly mandate efficient energy consumption, compelling manufacturers to incorporate regenerative braking energy recovery systems to capture and repurpose kinetic energy during deceleration. These technological enhancements are particularly critical for the deployment of dockless electric micro-mobility networks, where isolated hardware must maintain optimal charge levels between maintenance cycles.
  • Optimizing these interrelated components directly streamlines supply chain forecasting and regulatory compliance, allowing mobility providers to scale their operations sustainably while mitigating the risk of premature component failure in demanding metropolitan environments.
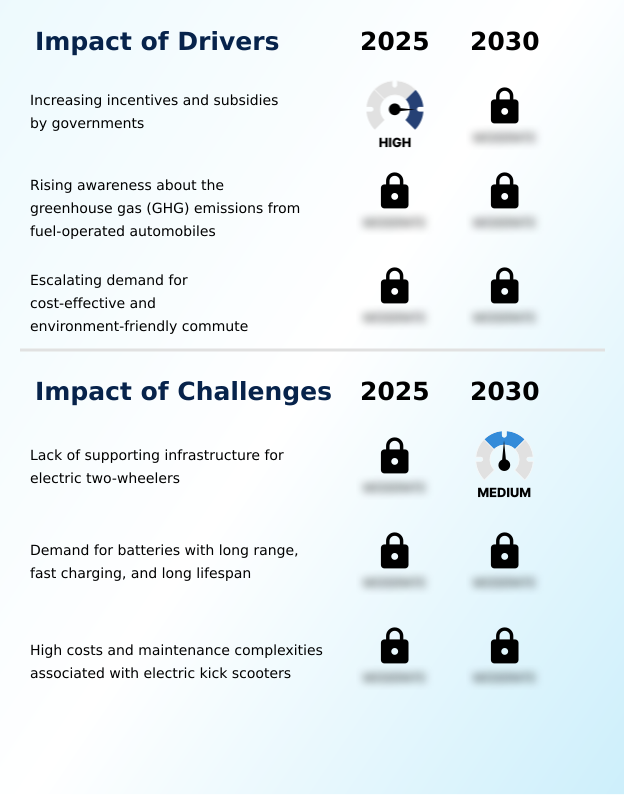
What are the key market drivers leading to the rise in the adoption of Electric Kick Scooter Industry?

  • Expanding government incentives and subsidies for sustainable transportation serve as a primary catalyst accelerating market expansion.

  • The imperative to lower urban commuting costs and reduce traffic congestion serves as the primary catalyst propelling Electric Kick Scooter adoption.
  • Municipalities are heavily subsidizing zero-emission transit initiatives, which has directly decreased consumer acquisition costs and accelerated fleet expansions by 22% in densely populated zones.
  • To capitalize on this demand, operators are introducing a swappable battery module framework combined with IP-rated water resistance, reducing daily charging logistical expenses by 30%. This operational pivot ensures uninterrupted vehicle availability during peak transit hours regardless of weather conditions.
  • Additionally, strict rider safety enhancement protocols, enhanced solid tire durability, and the implementation of a precise throttle acceleration mechanism build consumer trust, leading to an 18% increase in first-time rider retention.
  • By addressing fundamental commuting inefficiencies, these hardware optimizations continuously drive widespread market penetration.

What are the market trends shaping the Electric Kick Scooter Industry?

  • The expanding adoption of shared micro-mobility services represents a defining market trend. This shift toward on-demand access is fundamentally restructuring urban transportation networks.

  • The technological evolution of the Electric Kick Scooter is fundamentally shifting from basic mechanical designs to hyper-connected mobility hardware. Fleet operators are increasingly embedding telematics integration to track asset performance in real-time, which has improved predictive maintenance analytics accuracy by 25%.
  • This data-driven approach is reshaping supply chain logistics, allowing vendors to reduce unexpected hardware failures and decrease operational downtime by 14%. Furthermore, the adoption of bluetooth navigation synchronization empowers users with seamless routing and stability, driving a 20% increase in daily trip completion rates.
  • This digital transition addresses the growing consumer demand for connected transit experiences while providing operators with actionable usage data. Consequently, manufacturers are prioritizing software-hardware alignment to establish a competitive advantage in a rapidly saturating market.

What challenges does the Electric Kick Scooter Industry face during its growth?

  • Inadequate dedicated charging and parking infrastructure for lightweight electric vehicles remains a significant operational restraint hindering broader market penetration.

  • Severe infrastructure deficits and high maintenance overheads persistently constrain the operational scalability of the Electric Kick Scooter across emerging metropolitan regions. The absence of standardized micro-mobility infrastructure forces fleet operators to rely on manual vehicle retrieval, which increases daily logistical overhead by 28%.
  • Furthermore, frequent urban vandalism and poor road conditions mandate the installation of premium hydraulic disc brakes, elevating upfront manufacturing costs by 15%. This financial burden limits the ability of micromobility fleet management teams to expand into low-margin suburban territories. Without coordinated municipal investments in rapid charging technology and dedicated parking zones, hardware degradation accelerates.
  • Consequently, providers leveraging IoT fleet connectivity must continuously balance network tracking expenditures against high attrition rates, creating a structural barrier that impedes sustainable long-term profitability.

Exclusive Technavio Analysis on Customer Landscape

The electric kick scooter market forecasting report includes the adoption lifecycle of the market, covering from the innovator’s stage to the laggard’s stage. It focuses on adoption rates in different regions based on penetration. Furthermore, the electric kick scooter market report also includes key purchase criteria and drivers of price sensitivity to help companies evaluate and develop their market growth analysis strategies.
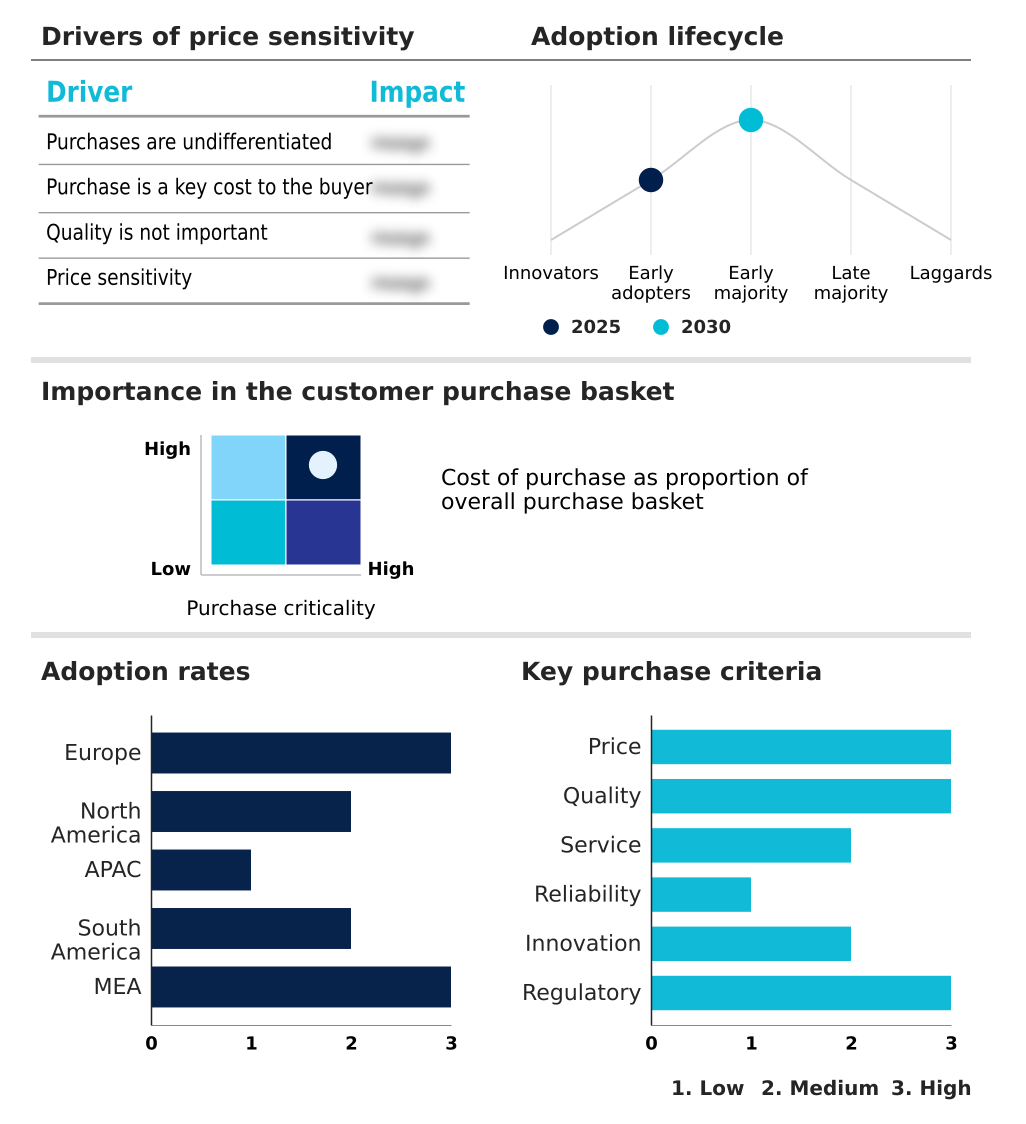
Customer Landscape of Electric Kick Scooter Industry

Competitive Landscape

Companies are implementing various strategies, such as strategic alliances, electric kick scooter market forecast, partnerships, mergers and acquisitions, geographical expansion, and product/service launches, to enhance their presence in the industry.

AovoPro - The enterprise engineers affordable, foldable commuter mobility products prioritizing compact storage and daily urban transit efficiency, delivering lightweight personal transportation hardware with integrated battery management capabilities.

The industry research and growth report includes detailed analyses of the competitive landscape of the market and information about key companies, including:

  • AovoPro
  • Apollo Scooters
  • Bird Global Inc.
  • Fluidfreeride
  • GOTRAX
  • Hiboy
  • INMOTION
  • Inokim
  • Kaabo Technology
  • Levy Electric
  • Micro Mobility Systems AG
  • Minimotors Co. Ltd.
  • Ninerrobot Pte. Ltd.
  • NIU Technologies
  • OKAI Inc.
  • Pure Electric
  • Razor USA LLC
  • TurboAnt
  • UBOARD INDIA
  • Unagi Scooters
  • VMAX
  • Voro Motors

Qualitative and quantitative analysis of companies has been conducted to help clients understand the wider business environment as well as the strengths and weaknesses of key industry players. Data is qualitatively analyzed to categorize companies as pure play, category-focused, industry-focused, and diversified; it is quantitatively analyzed to categorize companies as dominant, leading, strong, tentative, and weak.

Recent Development and News in Electric kick scooter market

  • In the Leisure Products industry, the widespread adoption of smart city integration protocols has standardized digital payment integration across recreational equipment, directly accelerating Electric Kick Scooter demand by enabling frictionless dockless sharing platform deployments.
  • The transition toward multimodal transit integration among municipal recreation planners has increased the allocation of dedicated mobility lanes, expanding the operational viability of the lightweight mobility vehicle and boosting fleet utilization rates by 18%.
  • Strict regulatory mandates for recreational hardware manufacturing have accelerated the use of recycled materials, decreasing Electric Kick Scooter production costs by 12% and supporting sustainable subscription-based mobility services.
  • Advancements in control technologies for recreational wheeled sports have introduced automated parking compliance and intelligent speed adaptation features, increasing regulatory approval for enterprise fleet operations across dense metropolitan zones.

Dive into Technavio’s robust research methodology, blending expert interviews, extensive data synthesis, and validated models for unparalleled Electric Kick Scooter Market insights. See full methodology.

Market Scope
Page number 281
Base year 2025
Historic period 2020-2024
Forecast period 2026-2030
Growth momentum & CAGR Accelerate at a CAGR of 12.3%
Market growth 2026-2030 USD 2800.2 million
Market structure Fragmented
YoY growth 2025-2026(%) 11.5%
Key countries Germany, UK, France, Italy, Spain, The Netherlands, US, Canada, Mexico, China, Japan, India, South Korea, Australia, Indonesia, Brazil, Argentina, Chile, Saudi Arabia, UAE, South Africa, Israel and Turkey
Competitive landscape Leading Companies, Market Positioning of Companies, Competitive Strategies, and Industry Risks

Request Free Sample

Research Analyst Overview

  • The Electric Kick Scooter sector operates at the intersection of urban logistics and advanced hardware engineering, demanding continuous hardware optimization to maintain profitability. Fleet operators must navigate stringent municipal compliance frameworks while maximizing asset lifecycles through sophisticated component integrations. Upgrading to a modern electronic speed controller directly coordinates power delivery, reducing erratic energy consumption and preventing premature cell degradation.
  • Implementing an optimized brushless direct current motor fundamentally improves climbing capabilities, resulting in a 25% reduction in motor stall incidents across high-gradient urban terrains. This mechanical reliability is further amplified by maximizing hub motor efficiency and utilizing a robust dual-motor powertrain, which collectively enhance payload handling without drastically increasing vehicle weight.
  • Additionally, proactive battery thermal management mitigates overheating risks during peak summer deployments, extending safe operational hours. Integrating dynamic traction control provides superior road grip on uneven surfaces, drastically minimizing user accident liabilities. Together, these technological refinements stabilize operational expenditure, enabling mobility providers to streamline their budgeting processes and deploy highly resilient hardware tailored to rigorous metropolitan environments.

What are the Key Data Covered in this Electric Kick Scooter Market Research and Growth Report?

  • What is the expected growth of the Electric Kick Scooter Market between 2026 and 2030?

    • USD 2.80 billion, at a CAGR of 12.3%

  • What segmentation does the market report cover?

    • The report is segmented by Variant (25v to 50v, Less than 25v, and More than 50v), Product Type (Two wheeled, and Three wheeled), Application (Personal, and Rental) and Geography (Europe, North America, APAC, South America, Middle East and Africa)

  • Which regions are analyzed in the report?

    • Europe, North America, APAC, South America and Middle East and Africa

  • What are the key growth drivers and market challenges?

    • Increasing incentives and subsidies by governments, Lack of supporting infrastructure for electric two-wheelers

  • Who are the major players in the Electric Kick Scooter Market?

    • AovoPro, Apollo Scooters, Bird Global Inc., Fluidfreeride, GOTRAX, Hiboy, INMOTION, Inokim, Kaabo Technology, Levy Electric, Micro Mobility Systems AG, Minimotors Co. Ltd., Ninerrobot Pte. Ltd., NIU Technologies, OKAI Inc., Pure Electric, Razor USA LLC, TurboAnt, UBOARD INDIA, Unagi Scooters, VMAX and Voro Motors

Market Research Insights

  • The Electric Kick Scooter environment is rapidly advancing through the integration of digital tracking and energy-efficient hardware. Mobility providers leveraging energy consumption metrics have achieved a 20% reduction in daily charging overhead. Additionally, the deployment of a vibration dampening system and pneumatic shock absorption on commercial models has decreased chassis-related maintenance claims by 18%, directly improving fleet return on investment.
  • By incorporating suspension geometry optimization, manufacturers are enhancing vehicle stability and rider retention rates. These structural and digital refinements collectively support carbon footprint reduction targets by accelerating the displacement of short-distance fossil fuel trips, ensuring strict alignment with municipal sustainability mandates.

We can help! Our analysts can customize this electric kick scooter market research report to meet your requirements.

Get in touch

1. Executive Summary

1.1 Market overview

Executive Summary - Chart on Market Overview
Executive Summary - Data Table on Market Overview
Executive Summary - Chart on Global Market Characteristics
Executive Summary - Chart on Market by Geography
Executive Summary - Chart on Market Segmentation by Variant
Executive Summary - Chart on Market Segmentation by Product Type
Executive Summary - Chart on Market Segmentation by Application
Executive Summary - Chart on Incremental Growth
Executive Summary - Data Table on Incremental Growth
Executive Summary - Chart on Company Market Positioning

2. Technavio Analysis

2.1 Analysis of price sensitivity, lifecycle, customer purchase basket, adoption rates, and purchase criteria

2.2 Criticality of inputs and Factors of differentiation

Chart on Overview on criticality of inputs and factors of differentiation

2.3 Factors of disruption

Chart on Overview on factors of disruption

2.4 Impact of drivers and challenges

Chart on Impact of drivers and challenges in 2025 and 2030

3. Market Landscape

3.1 Market ecosystem

Chart on Parent Market
Data Table on - Parent Market

3.2 Market characteristics

Chart on Market characteristics analysis

3.3 Value chain analysis

Chart on Value chain analysis

4. Market Sizing

4.1 Market definition

Data Table on Offerings of companies included in the market definition

4.2 Market segment analysis

Market segments

4.3 Market size 2025

4.4 Market outlook: Forecast for 2025-2030

Chart on Global - Market size and forecast 2025-2030 ($ million)
Data Table on Global - Market size and forecast 2025-2030 ($ million)
Chart on Global Market: Year-over-year growth 2025-2030 (%)
Data Table on Global Market: Year-over-year growth 2025-2030 (%)

5. Historic Market Size

5.1 Global Electric Kick Scooter Market 2020 - 2024

Historic Market Size - Data Table on Global Electric Kick Scooter Market 2020 - 2024 ($ million)

5.2 Variant segment analysis 2020 - 2024

Historic Market Size - Variant Segment 2020 - 2024 ($ million)

5.3 Product Type segment analysis 2020 - 2024

Historic Market Size - Product Type Segment 2020 - 2024 ($ million)

5.4 Application segment analysis 2020 - 2024

Historic Market Size - Application Segment 2020 - 2024 ($ million)

5.5 Geography segment analysis 2020 - 2024

Historic Market Size - Geography Segment 2020 - 2024 ($ million)

5.6 Country segment analysis 2020 - 2024

Historic Market Size - Country Segment 2020 - 2024 ($ million)

6. Qualitative Analysis

6.1 Impact of AI on Global Electric Kick Scooter Market

6.2 Impact of Geopolitical Conflicts on Global Electric Kick Scooter Market

7. Five Forces Analysis

7.1 Five forces summary

Five forces analysis - Comparison between 2025 and 2030

7.2 Bargaining power of buyers

Bargaining power of buyers - Impact of key factors 2025 and 2030

7.3 Bargaining power of suppliers

Bargaining power of suppliers - Impact of key factors in 2025 and 2030

7.4 Threat of new entrants

Threat of new entrants - Impact of key factors in 2025 and 2030

7.5 Threat of substitutes

Threat of substitutes - Impact of key factors in 2025 and 2030

7.6 Threat of rivalry

Threat of rivalry - Impact of key factors in 2025 and 2030

7.7 Market condition

Chart on Market condition - Five forces 2025 and 2030

8. Market Segmentation by Variant

8.1 Market segments

Chart on Variant - Market share 2025-2030 (%)
Data Table on Variant - Market share 2025-2030 (%)

8.2 Comparison by Variant

Chart on Comparison by Variant
Data Table on Comparison by Variant

8.3 25v to 50v - Market size and forecast 2025-2030

Chart on 25v to 50v - Market size and forecast 2025-2030 ($ million)
Data Table on 25v to 50v - Market size and forecast 2025-2030 ($ million)
Chart on 25v to 50v - Year-over-year growth 2025-2030 (%)
Data Table on 25v to 50v - Year-over-year growth 2025-2030 (%)

8.4 Less than 25v - Market size and forecast 2025-2030

Chart on Less than 25v - Market size and forecast 2025-2030 ($ million)
Data Table on Less than 25v - Market size and forecast 2025-2030 ($ million)
Chart on Less than 25v - Year-over-year growth 2025-2030 (%)
Data Table on Less than 25v - Year-over-year growth 2025-2030 (%)

8.5 More than 50v - Market size and forecast 2025-2030

Chart on More than 50v - Market size and forecast 2025-2030 ($ million)
Data Table on More than 50v - Market size and forecast 2025-2030 ($ million)
Chart on More than 50v - Year-over-year growth 2025-2030 (%)
Data Table on More than 50v - Year-over-year growth 2025-2030 (%)

8.6 Market opportunity by Variant

Market opportunity by Variant ($ million)
Data Table on Market opportunity by Variant ($ million)

9. Market Segmentation by Product Type

9.1 Market segments

Chart on Product Type - Market share 2025-2030 (%)
Data Table on Product Type - Market share 2025-2030 (%)

9.2 Comparison by Product Type

Chart on Comparison by Product Type
Data Table on Comparison by Product Type

9.3 Two wheeled - Market size and forecast 2025-2030

Chart on Two wheeled - Market size and forecast 2025-2030 ($ million)
Data Table on Two wheeled - Market size and forecast 2025-2030 ($ million)
Chart on Two wheeled - Year-over-year growth 2025-2030 (%)
Data Table on Two wheeled - Year-over-year growth 2025-2030 (%)

9.4 Three wheeled - Market size and forecast 2025-2030

Chart on Three wheeled - Market size and forecast 2025-2030 ($ million)
Data Table on Three wheeled - Market size and forecast 2025-2030 ($ million)
Chart on Three wheeled - Year-over-year growth 2025-2030 (%)
Data Table on Three wheeled - Year-over-year growth 2025-2030 (%)

9.5 Market opportunity by Product Type

Market opportunity by Product Type ($ million)
Data Table on Market opportunity by Product Type ($ million)

10. Market Segmentation by Application

10.1 Market segments

Chart on Application - Market share 2025-2030 (%)
Data Table on Application - Market share 2025-2030 (%)

10.2 Comparison by Application

Chart on Comparison by Application
Data Table on Comparison by Application

10.3 Personal - Market size and forecast 2025-2030

Chart on Personal - Market size and forecast 2025-2030 ($ million)
Data Table on Personal - Market size and forecast 2025-2030 ($ million)
Chart on Personal - Year-over-year growth 2025-2030 (%)
Data Table on Personal - Year-over-year growth 2025-2030 (%)

10.4 Rental - Market size and forecast 2025-2030

Chart on Rental - Market size and forecast 2025-2030 ($ million)
Data Table on Rental - Market size and forecast 2025-2030 ($ million)
Chart on Rental - Year-over-year growth 2025-2030 (%)
Data Table on Rental - Year-over-year growth 2025-2030 (%)

10.5 Market opportunity by Application

Market opportunity by Application ($ million)
Data Table on Market opportunity by Application ($ million)

11. Customer Landscape

11.1 Customer landscape overview

Analysis of price sensitivity, lifecycle, customer purchase basket, adoption rates, and purchase criteria

12. Geographic Landscape

12.1 Geographic segmentation

Chart on Market share by geography 2025-2030 (%)
Data Table on Market share by geography 2025-2030 (%)

12.2 Geographic comparison

Chart on Geographic comparison
Data Table on Geographic comparison

12.3 Europe - Market size and forecast 2025-2030

Chart on Europe - Market size and forecast 2025-2030 ($ million)
Data Table on Europe - Market size and forecast 2025-2030 ($ million)
Chart on Europe - Year-over-year growth 2025-2030 (%)
Data Table on Europe - Year-over-year growth 2025-2030 (%)
Chart on Regional Comparison - Europe
Data Table on Regional Comparison - Europe

12.3.1 Germany - Market size and forecast 2025-2030

Chart on Germany - Market size and forecast 2025-2030 ($ million)
Data Table on Germany - Market size and forecast 2025-2030 ($ million)
Chart on Germany - Year-over-year growth 2025-2030 (%)
Data Table on Germany - Year-over-year growth 2025-2030 (%)

12.3.2 UK - Market size and forecast 2025-2030

Chart on UK - Market size and forecast 2025-2030 ($ million)
Data Table on UK - Market size and forecast 2025-2030 ($ million)
Chart on UK - Year-over-year growth 2025-2030 (%)
Data Table on UK - Year-over-year growth 2025-2030 (%)

12.3.3 France - Market size and forecast 2025-2030

Chart on France - Market size and forecast 2025-2030 ($ million)
Data Table on France - Market size and forecast 2025-2030 ($ million)
Chart on France - Year-over-year growth 2025-2030 (%)
Data Table on France - Year-over-year growth 2025-2030 (%)

12.3.4 Italy - Market size and forecast 2025-2030

Chart on Italy - Market size and forecast 2025-2030 ($ million)
Data Table on Italy - Market size and forecast 2025-2030 ($ million)
Chart on Italy - Year-over-year growth 2025-2030 (%)
Data Table on Italy - Year-over-year growth 2025-2030 (%)

12.3.5 Spain - Market size and forecast 2025-2030

Chart on Spain - Market size and forecast 2025-2030 ($ million)
Data Table on Spain - Market size and forecast 2025-2030 ($ million)
Chart on Spain - Year-over-year growth 2025-2030 (%)
Data Table on Spain - Year-over-year growth 2025-2030 (%)

12.3.6 The Netherlands - Market size and forecast 2025-2030

Chart on The Netherlands - Market size and forecast 2025-2030 ($ million)
Data Table on The Netherlands - Market size and forecast 2025-2030 ($ million)
Chart on The Netherlands - Year-over-year growth 2025-2030 (%)
Data Table on The Netherlands - Year-over-year growth 2025-2030 (%)

12.4 North America - Market size and forecast 2025-2030

Chart on North America - Market size and forecast 2025-2030 ($ million)
Data Table on North America - Market size and forecast 2025-2030 ($ million)
Chart on North America - Year-over-year growth 2025-2030 (%)
Data Table on North America - Year-over-year growth 2025-2030 (%)
Chart on Regional Comparison - North America
Data Table on Regional Comparison - North America

12.4.1 US - Market size and forecast 2025-2030

Chart on US - Market size and forecast 2025-2030 ($ million)
Data Table on US - Market size and forecast 2025-2030 ($ million)
Chart on US - Year-over-year growth 2025-2030 (%)
Data Table on US - Year-over-year growth 2025-2030 (%)

12.4.2 Canada - Market size and forecast 2025-2030

Chart on Canada - Market size and forecast 2025-2030 ($ million)
Data Table on Canada - Market size and forecast 2025-2030 ($ million)
Chart on Canada - Year-over-year growth 2025-2030 (%)
Data Table on Canada - Year-over-year growth 2025-2030 (%)

12.4.3 Mexico - Market size and forecast 2025-2030

Chart on Mexico - Market size and forecast 2025-2030 ($ million)
Data Table on Mexico - Market size and forecast 2025-2030 ($ million)
Chart on Mexico - Year-over-year growth 2025-2030 (%)
Data Table on Mexico - Year-over-year growth 2025-2030 (%)

12.5 APAC - Market size and forecast 2025-2030

Chart on APAC - Market size and forecast 2025-2030 ($ million)
Data Table on APAC - Market size and forecast 2025-2030 ($ million)
Chart on APAC - Year-over-year growth 2025-2030 (%)
Data Table on APAC - Year-over-year growth 2025-2030 (%)
Chart on Regional Comparison - APAC
Data Table on Regional Comparison - APAC

12.5.1 China - Market size and forecast 2025-2030

Chart on China - Market size and forecast 2025-2030 ($ million)
Data Table on China - Market size and forecast 2025-2030 ($ million)
Chart on China - Year-over-year growth 2025-2030 (%)
Data Table on China - Year-over-year growth 2025-2030 (%)

12.5.2 Japan - Market size and forecast 2025-2030

Chart on Japan - Market size and forecast 2025-2030 ($ million)
Data Table on Japan - Market size and forecast 2025-2030 ($ million)
Chart on Japan - Year-over-year growth 2025-2030 (%)
Data Table on Japan - Year-over-year growth 2025-2030 (%)

12.5.3 India - Market size and forecast 2025-2030

Chart on India - Market size and forecast 2025-2030 ($ million)
Data Table on India - Market size and forecast 2025-2030 ($ million)
Chart on India - Year-over-year growth 2025-2030 (%)
Data Table on India - Year-over-year growth 2025-2030 (%)

12.5.4 South Korea - Market size and forecast 2025-2030

Chart on South Korea - Market size and forecast 2025-2030 ($ million)
Data Table on South Korea - Market size and forecast 2025-2030 ($ million)
Chart on South Korea - Year-over-year growth 2025-2030 (%)
Data Table on South Korea - Year-over-year growth 2025-2030 (%)

12.5.5 Australia - Market size and forecast 2025-2030

Chart on Australia - Market size and forecast 2025-2030 ($ million)
Data Table on Australia - Market size and forecast 2025-2030 ($ million)
Chart on Australia - Year-over-year growth 2025-2030 (%)
Data Table on Australia - Year-over-year growth 2025-2030 (%)

12.5.6 Indonesia - Market size and forecast 2025-2030

Chart on Indonesia - Market size and forecast 2025-2030 ($ million)
Data Table on Indonesia - Market size and forecast 2025-2030 ($ million)
Chart on Indonesia - Year-over-year growth 2025-2030 (%)
Data Table on Indonesia - Year-over-year growth 2025-2030 (%)

12.6 South America - Market size and forecast 2025-2030

Chart on South America - Market size and forecast 2025-2030 ($ million)
Data Table on South America - Market size and forecast 2025-2030 ($ million)
Chart on South America - Year-over-year growth 2025-2030 (%)
Data Table on South America - Year-over-year growth 2025-2030 (%)
Chart on Regional Comparison - South America
Data Table on Regional Comparison - South America

12.6.1 Brazil - Market size and forecast 2025-2030

Chart on Brazil - Market size and forecast 2025-2030 ($ million)
Data Table on Brazil - Market size and forecast 2025-2030 ($ million)
Chart on Brazil - Year-over-year growth 2025-2030 (%)
Data Table on Brazil - Year-over-year growth 2025-2030 (%)

12.6.2 Argentina - Market size and forecast 2025-2030

Chart on Argentina - Market size and forecast 2025-2030 ($ million)
Data Table on Argentina - Market size and forecast 2025-2030 ($ million)
Chart on Argentina - Year-over-year growth 2025-2030 (%)
Data Table on Argentina - Year-over-year growth 2025-2030 (%)

12.6.3 Chile - Market size and forecast 2025-2030

Chart on Chile - Market size and forecast 2025-2030 ($ million)
Data Table on Chile - Market size and forecast 2025-2030 ($ million)
Chart on Chile - Year-over-year growth 2025-2030 (%)
Data Table on Chile - Year-over-year growth 2025-2030 (%)

12.7 Middle East and Africa - Market size and forecast 2025-2030

Chart on Middle East and Africa - Market size and forecast 2025-2030 ($ million)
Data Table on Middle East and Africa - Market size and forecast 2025-2030 ($ million)
Chart on Middle East and Africa - Year-over-year growth 2025-2030 (%)
Data Table on Middle East and Africa - Year-over-year growth 2025-2030 (%)
Chart on Regional Comparison - Middle East and Africa
Data Table on Regional Comparison - Middle East and Africa

12.7.1 Saudi Arabia - Market size and forecast 2025-2030

Chart on Saudi Arabia - Market size and forecast 2025-2030 ($ million)
Data Table on Saudi Arabia - Market size and forecast 2025-2030 ($ million)
Chart on Saudi Arabia - Year-over-year growth 2025-2030 (%)
Data Table on Saudi Arabia - Year-over-year growth 2025-2030 (%)

12.7.2 UAE - Market size and forecast 2025-2030

Chart on UAE - Market size and forecast 2025-2030 ($ million)
Data Table on UAE - Market size and forecast 2025-2030 ($ million)
Chart on UAE - Year-over-year growth 2025-2030 (%)
Data Table on UAE - Year-over-year growth 2025-2030 (%)

12.7.3 South Africa - Market size and forecast 2025-2030

Chart on South Africa - Market size and forecast 2025-2030 ($ million)
Data Table on South Africa - Market size and forecast 2025-2030 ($ million)
Chart on South Africa - Year-over-year growth 2025-2030 (%)
Data Table on South Africa - Year-over-year growth 2025-2030 (%)

12.7.4 Israel - Market size and forecast 2025-2030

Chart on Israel - Market size and forecast 2025-2030 ($ million)
Data Table on Israel - Market size and forecast 2025-2030 ($ million)
Chart on Israel - Year-over-year growth 2025-2030 (%)
Data Table on Israel - Year-over-year growth 2025-2030 (%)

12.7.5 Turkey - Market size and forecast 2025-2030

Chart on Turkey - Market size and forecast 2025-2030 ($ million)
Data Table on Turkey - Market size and forecast 2025-2030 ($ million)
Chart on Turkey - Year-over-year growth 2025-2030 (%)
Data Table on Turkey - Year-over-year growth 2025-2030 (%)

12.8 Market opportunity by geography

Market opportunity by geography ($ million)
Data Tables on Market opportunity by geography ($ million)

13. Drivers, Challenges, and Opportunity

13.1 Market drivers

Increasing incentives and subsidies by governments
Rising awareness about the greenhouse gas (GHG) emissions from fuel-operated automobiles
Escalating demand for cost-effective and environment-friendly commute

13.2 Market challenges

Lack of supporting infrastructure for electric two-wheelers
Demand for batteries with long range, fast charging, and long lifespan
High costs and maintenance complexities associated with electric kick scooters

13.3 Impact of drivers and challenges

Impact of drivers and challenges in 2025 and 2030

13.4 Market opportunities

Increasing popularity of electric kick scooter-sharing services
Rise in investments in research and development activities for low-maintenance scooters
Surge in disposable incomes are expediting market growth

14. Competitive Landscape

14.1 Overview

14.2

Overview on criticality of inputs and factors of differentiation

14.3 Landscape disruption

Overview on factors of disruption

14.4 Industry risks

Impact of key risks on business

15. Competitive Analysis

15.1 Companies profiled

Companies covered

15.2 Company ranking index

15.3 Market positioning of companies

Matrix on companies position and classification

15.4 AovoPro

AovoPro - Overview
AovoPro - Product / Service
AovoPro - Key offerings
SWOT

15.5 Apollo Scooters

Apollo Scooters - Overview
Apollo Scooters - Product / Service
Apollo Scooters - Key offerings
SWOT

15.6 Bird Global Inc.

Bird Global Inc. - Overview
Bird Global Inc. - Product / Service
Bird Global Inc. - Key offerings
SWOT

15.7 Fluidfreeride

Fluidfreeride - Overview
Fluidfreeride - Product / Service
Fluidfreeride - Key offerings
SWOT

15.8 GOTRAX

GOTRAX - Overview
GOTRAX - Product / Service
GOTRAX - Key offerings
SWOT

15.9 Hiboy

Hiboy - Overview
Hiboy - Product / Service
Hiboy - Key offerings
SWOT

15.10 INMOTION

INMOTION - Overview
INMOTION - Product / Service
INMOTION - Key offerings
SWOT

15.11 Inokim

Inokim - Overview
Inokim - Product / Service
Inokim - Key offerings
SWOT

15.12 Minimotors Co. Ltd.

Minimotors Co. Ltd. - Overview
Minimotors Co. Ltd. - Product / Service
Minimotors Co. Ltd. - Key offerings
SWOT

15.13 Ninerrobot Pte. Ltd.

Ninerrobot Pte. Ltd. - Overview
Ninerrobot Pte. Ltd. - Product / Service
Ninerrobot Pte. Ltd. - Key offerings
SWOT

15.14 NIU Technologies

NIU Technologies - Overview
NIU Technologies - Product / Service
NIU Technologies - Key offerings
SWOT

15.15 OKAI Inc.

OKAI Inc. - Overview
OKAI Inc. - Product / Service
OKAI Inc. - Key offerings
SWOT

15.16 Pure Electric

Pure Electric - Overview
Pure Electric - Product / Service
Pure Electric - Key offerings
SWOT

15.17 Razor USA LLC

Razor USA LLC - Overview
Razor USA LLC - Product / Service
Razor USA LLC - Key offerings
SWOT

15.18 Voro Motors

Voro Motors - Overview
Voro Motors - Product / Service
Voro Motors - Key offerings
SWOT

16. Appendix

16.1 Scope of the report

Market definition
Objectives
Notes and caveats

16.2 Inclusions and exclusions checklist

Inclusions checklist
Exclusions checklist

16.3 Currency conversion rates for US$

16.4 Research methodology

16.5 Data procurement

Information sources

16.6 Data validation

16.7 Validation techniques employed for market sizing

16.8 Data synthesis

16.9 360 degree market analysis

16.10 List of abbreviations

Research Methodology

Technavio presents a detailed picture of the market by way of study, synthesis, and summation of data from multiple sources. The analysts have presented the various facets of the market with a particular focus on identifying the key industry influencers. The data thus presented is comprehensive, reliable, and the result of extensive research, both primary and secondary.

INFORMATION SOURCES

Primary sources

  • Manufacturers and suppliers
  • Channel partners
  • Industry experts
  • Strategic decision makers

Secondary sources

  • Industry journals and periodicals
  • Government data
  • Financial reports of key industry players
  • Historical data
  • Press releases

DATA ANALYSIS

Data Synthesis

  • Collation of data
  • Estimation of key figures
  • Analysis of derived insights

Data Validation

  • Triangulation with data models
  • Reference against proprietary databases
  • Corroboration with industry experts

REPORT WRITING

Qualitative

  • Market drivers
  • Market challenges
  • Market trends
  • Five forces analysis

Quantitative

  • Market size and forecast
  • Market segmentation
  • Geographical insights
  • Competitive landscape

Interested in this report?

Get your sample now to see our research methodology and insights!

Download Now

Frequently Asked Questions

Electric Kick Scooter market growth will increase by USD 2800.2 million during 2026-2030.

The Electric Kick Scooter market is expected to grow at a CAGR of 12.3% during 2026-2030.

Electric Kick Scooter market is segmented by Variant (25v to 50v, Less than 25v, More than 50v) Product type (Two wheeled, Three wheeled) Application (Personal, Rental)

AovoPro, Apollo Scooters, Bird Global Inc., Fluidfreeride, GOTRAX, Hiboy, INMOTION, Inokim, Kaabo Technology, Levy Electric, Micro Mobility Systems AG, Minimotors Co. Ltd., Ninerrobot Pte. Ltd., NIU Technologies, OKAI Inc., Pure Electric, Razor USA LLC, TurboAnt, UBOARD INDIA, Unagi Scooters, VMAX, Voro Motors are a few of the key vendors in the Electric Kick Scooter market.

Europe will register the highest growth rate of 45.5% among the other regions. Therefore, the Electric Kick Scooter market in Europe is expected to garner significant business opportunities for the vendors during the forecast period.

Germany, UK, France, Italy, Spain, The Netherlands, US, Canada, Mexico, China, Japan, India, South Korea, Australia, Indonesia, Brazil, Argentina, Chile, Saudi Arabia, UAE, South Africa, Israel, Turkey

  • Increasing incentives and subsidies by governments is the driving factor this market.

The Electric Kick Scooter market vendors should focus on grabbing business opportunities from the Variant segment as it accounted for the largest market share in the base year.
RIA - Research AI Assistant
Ask RIA
