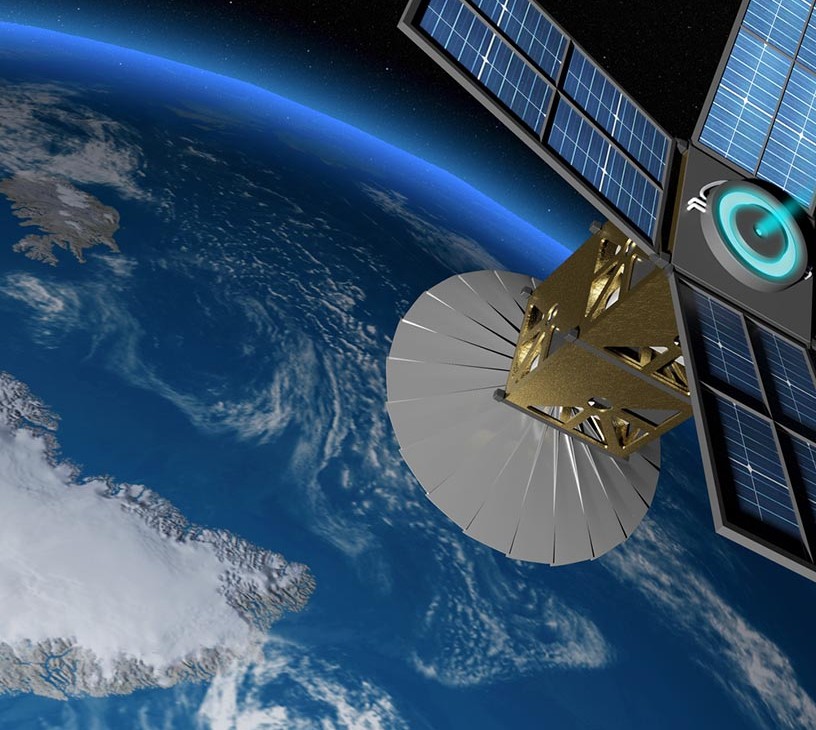
Electric Propulsion Satellite Market Analysis, Size, and Forecast 2026-2030: APAC (China, Japan, and India), North America (US, Canada, and Mexico), Europe (Germany, UK, and France), South America (Brazil, Argentina, and Chile), Middle East and Africa (Saudi Arabia, UAE, and South Africa), and Rest of World (ROW)

Electric Propulsion Satellite Market Analysis, Size, and Forecast 2026-2030:
APAC (China, Japan, and India), North America (US, Canada, and Mexico), Europe (Germany, UK, and France), South America (Brazil, Argentina, and Chile), Middle East and Africa (Saudi Arabia, UAE, and South Africa), and Rest of World (ROW)

Published: Oct 2026 290 Pages SKU: IRTNTR41520

Market Overview at a Glance

$12.22 B
Market Opportunity
9.4%
CAGR 2025 - 2030
41.7%
APAC Growth
$12.78 B
Military segment 2024

Electric Propulsion Satellite Market Size 2026-2030

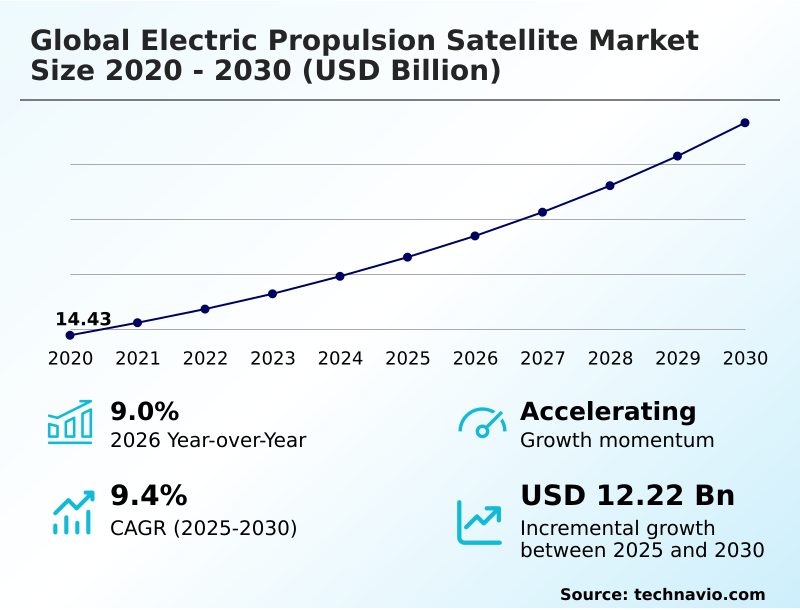
The electric propulsion satellite market size is valued to increase by USD 12.22 billion, at a CAGR of 9.4% from 2025 to 2030. Profound mass reduction efficiencies transforming spacecraft economics and lowering initial launch procurement capital expenditures will drive the electric propulsion satellite market.

Major Market Trends & Insights

  • APAC dominated the market and accounted for a 41.7% growth during the forecast period.
  • By Application - Military segment was valued at USD 12.78 billion in 2024
  • By Type - Hybrid segment accounted for the largest market revenue share in 2024

Market Size & Forecast

  • Market Opportunities: USD 19.32 billion
  • Market Future Opportunities: USD 12.22 billion
  • CAGR from 2025 to 2030 : 9.4%

Market Summary

  • The Electric Propulsion Satellite Market is undergoing a rapid technological transformation driven by the escalating deployment of high-density orbital broadband networks. By replacing heavy chemical combustors with highly efficient electrostatic and electromagnetic thrusters, satellite operators optimize payload capacity and ensure precise long-term orbital positioning.
  • For instance, commercial telecommunications providers routinely implement multi-thruster electric configurations to minimize launch mass, which subsequently increases revenue-generating transponder capacity per vehicle by nearly 40% compared to legacy liquid propellant designs. The primary driver driving this industry is the exceptional mass reduction efficiency of electric systems, which significantly lowers initial launch procurement costs and dramatically alters spacecraft economics.
  • Conversely, prolonged orbit-raising timelines pose a substantial challenge, as the low thrust output forces satellites to spend months navigating highly destructive radiation belts. This extended transit period severely accelerates electronic component degradation and introduces substantial operational friction.
  • Consequently, aerospace manufacturers must invest heavily in advanced radiation shielding architectures to protect sensitive payload instruments and guarantee continuous mission survivability over multi-decade lifespans.

What will be the Size of the Electric Propulsion Satellite Market during the forecast period?
Get Key Insights on Market Forecast (PDF) Get Free Sample

How is the Electric Propulsion Satellite Market Segmented?

The electric propulsion satellite industry research report provides comprehensive data (region-wise segment analysis), with forecasts and estimates in "USD million" for the period 2026-2030, as well as historical data from 2020-2024 for the following segments.

  • Application
    • Military
    • Commercial
  • Type
    • Hybrid
    • All-electric
  • Technology
    • Electrothermal propulsion
    • Electrostatic propulsion
    • Electromagnetic propulsion
  • Geography
    • APAC
      • China
      • Japan
      • India
      • South Korea
      • Australia
      • Indonesia
    • North America
      • US
      • Canada
      • Mexico
    • Europe
      • Germany
      • UK
      • France
      • Italy
      • Spain
      • The Netherlands
    • South America
      • Brazil
      • Argentina
      • Chile
    • Middle East and Africa
      • Saudi Arabia
      • UAE
      • South Africa
      • Israel
      • Turkey

By Application Insights

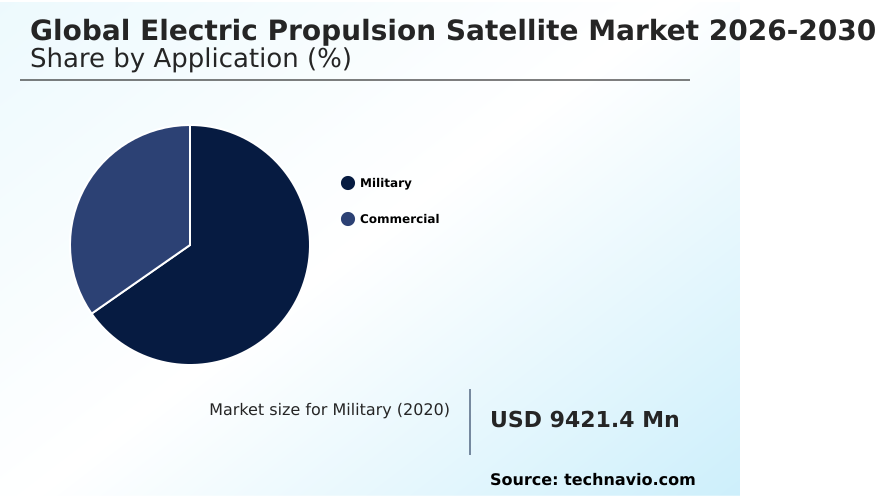
The military segment is estimated to witness significant growth during the forecast period.

The military segment within the Electric Propulsion Satellite sector operates as a high-specification vertical where advanced space hardware fortifies resilient sovereign digital networks.

Defense organizations are aggressively transitioning from heavy chemical systems to highly efficient pulsed plasma systems to ensure continuous orbital survivability during complex military reconnaissance operations.

This architectural shift enables high-value geostationary communication payloads to execute evasive positioning using electromagnetic fields while consuming significantly less mass.

By integrating specialized autonomous navigation software, military operators achieve uninterrupted drag compensation and highly precise reaction wheel desaturation across contested environments.

The implementation of solid state material feeding techniques has improved long-duration mission fuel efficiency by 65%, extending the active deployment lifecycle of critical national security constellations.

Consequently, this vertical commands strict material traceability and performance resilience, driving high-volume procurement from specialized defense contractors.
Get Free Sample

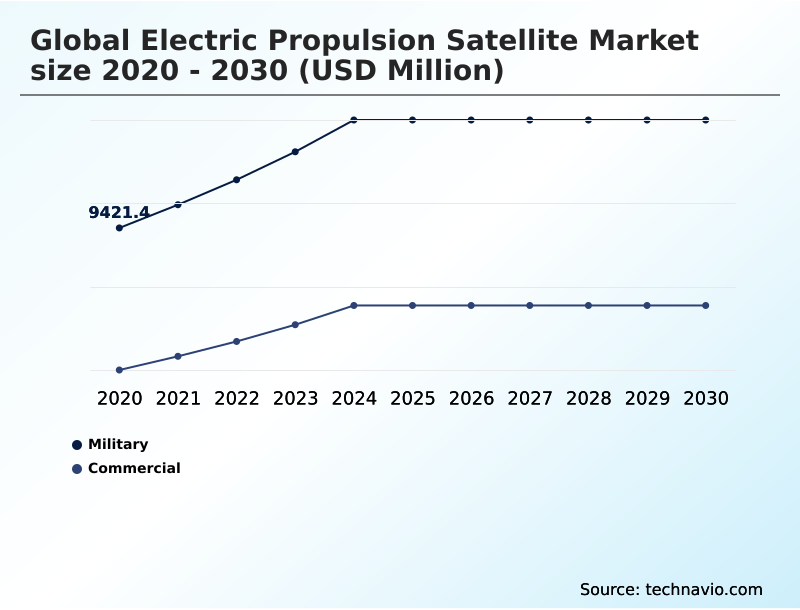
The Military segment was valued at USD 12.78 billion in 2024 and showed a gradual increase during the forecast period.
Get Free Sample

Regional Analysis

APAC is estimated to contribute 41.7% to the growth of the global market during the forecast period.Technavio’s analysts have elaborately explained the regional trends and drivers that shape the market during the forecast period.
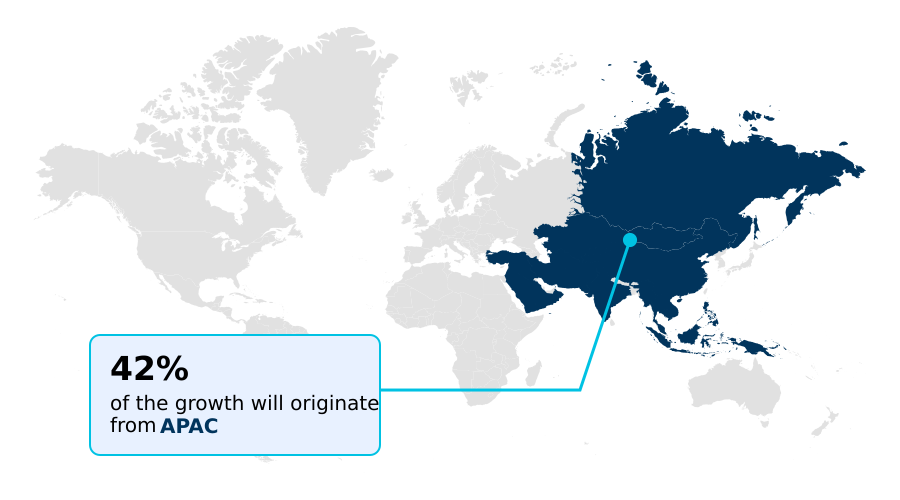
See How Electric Propulsion Satellite Market Demand is Rising in APAC Get Free Sample

The geographic landscape of the Electric Propulsion Satellite sector exhibits distinct technological adoption patterns driven by diverse regional constellation deployment priorities.

North America maintains a dominant position, achieving a 45% faster orbital asset deployment rate compared to Europe due to heavy defense funding and deep space scientific exploration initiatives.

While European operators heavily prioritize sustainable space architectures and specialized gridded ion engines for long-duration missions, North American enterprises utilize high-power electrostatic acceleration systems to manage massive earth observation arrays.

To maintain precise plasma density control, commercial operators are rapidly integrating multi mode electric propulsion architectures into their platforms.

Because managing separate international subcontractors introduces compliance friction, major prime contractors are executing targeted cross border aerospace acquisitions to vertically integrate critical technologies in-house.

This strategic consolidation has reduced regional component procurement delays by 30%, ensuring safe end of life deorbiting capabilities across sovereign fleets.

Market Dynamics

Our researchers analyzed the data with 2025 as the base year, along with the key drivers, trends, and challenges. A holistic analysis of drivers will help companies refine their marketing strategies to gain a competitive advantage.

  • The commercial expansion of the Electric Propulsion Satellite domain is deeply anchored in the strategic transition toward highly scalable, mass-produced orbital architectures. Constellation operators are increasingly prioritizing high impulse electric thruster performance to maximize the active revenue-generating lifespan of critical space assets.
  • As launch frequencies escalate, the industry is witnessing a significant shift toward standardized modular electric propulsion module integration, which allows satellite manufacturers to assemble complex mobility platforms significantly faster than legacy custom-built chemical variants.
  • By implementing alternative molecular fuel ionization systems, aerospace engineers can effectively bypass the supply chain bottlenecks associated with rare atmospheric gases, reducing total propellant sourcing delays by over a third. This optimization in supply chain management ensures that mass manufacturing pipelines remain uninterrupted even during geopolitical trade disruptions.
  • Furthermore, the extreme spatial density of modern broadband networks requires advanced digital frameworks capable of executing autonomous collision avoidance automated spacing to prevent catastrophic orbital debris generation. While low-thrust configurations introduce operational complexities, technology firms are rapidly deploying advanced power distribution redundancies and specialized prolonged transit radiation degradation mitigation techniques to protect sensitive payload electronics.
  • By addressing these structural engineering requirements, global space enterprises are achieving unprecedented asset reliability and establishing highly resilient sovereign digital networks across dynamic orbital environments.
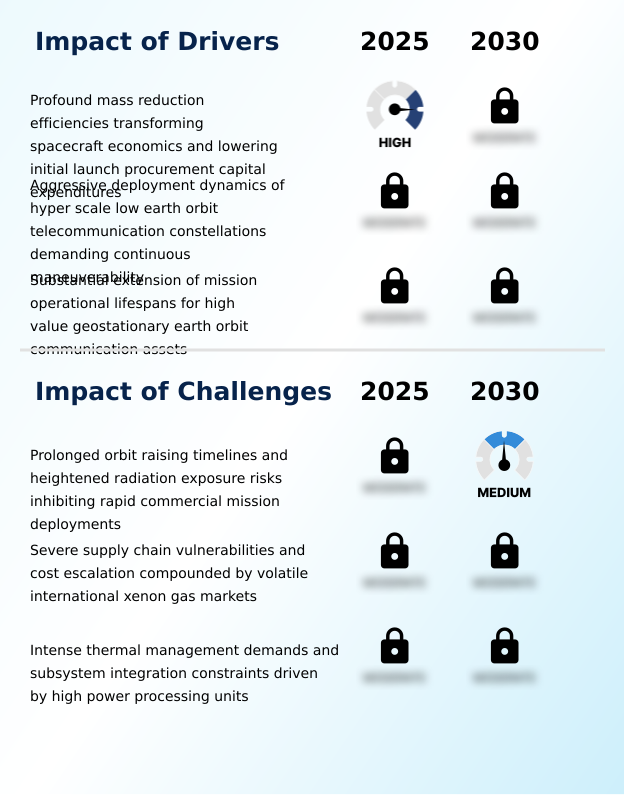
What are the key market drivers leading to the rise in the adoption of Electric Propulsion Satellite Industry?

  • A primary market driver is the profound mass reduction efficiency that transforms spacecraft economics and significantly lowers initial launch procurement capital expenditures.

  • The extraordinary mass reduction efficiencies achieved by substituting heavy chemical combustors with high-impulse electric engines drive the profound expansion of the modern space sector.
  • Traditional orbital insertion protocols require massive fuel reserves, whereas modern hall effect thrusters generate superior specific impulse metrics that drastically lower the required propellant mass fraction of a satellite.
  • By relying on highly efficient attitude control mechanisms, operators maximize available payload accommodation space to integrate heavier, revenue-generating commercial transponders.
  • This fundamental mass-saving capability has lowered initial launch vehicle procurement costs by 35% and directly enhanced spacecraft economics optimization across the entire industry.
  • As telecom providers aggressively scale massive low earth orbit constellations, the operational necessity for lightweight propulsion platforms ensures sustained procurement momentum globally, enabling continuous expansion of international digital communication infrastructure.

What are the market trends shaping the Electric Propulsion Satellite Industry?

  • The upcoming market trend is defined by a widespread technical transition toward eco-friendly alternative propellants. This shift strategically replaces volatile rare gas sourcing channels with sustainable, earth-abundant molecular fuels.

  • The structural transition toward sustainable, earth-abundant green propellant alternatives is fundamentally reshaping modern spacecraft mobility architecture. Satellite constellation operators are systematically replacing traditional gases with krypton propellant and solid iodine propellant to bypass fragile global supply chains.
  • Because these alternative molecules offer superior storage density, engineers are redesigning cathode ionization chambers to support lower-pressure storage systems, which directly enhances spacecraft modularity. This fuel transition enables developers to integrate standardized plug and play modules directly into automated manufacturing pipelines.
  • By shifting to these modular hardware configurations, satellite manufacturers have compressed assembly timelines by 40% and improved mass production throughput by 25%. These rapid deployment cycles empower broadband providers to launch agile platforms at scale. Furthermore, this modernization strictly aligns with evolving space debris mitigation protocols, ensuring that large-scale orbital networks maintain sustainable end-of-life disposal capabilities.

What challenges does the Electric Propulsion Satellite Industry face during its growth?

  • Industry growth is significantly constrained by prolonged orbit-raising timelines and heightened radiation exposure risks that inhibit rapid commercial mission deployments.

  • The deployment of high-performance electric thrusters introduces severe thermal management constraints that significantly complicate modern spacecraft engineering. Because advanced power processing units require massive electrical energy to accelerate ionized particles, they generate intense waste heat that forces developers to integrate expansive thermal dissipation networks into the satellite bus architecture.
  • This necessary structural modification increases vehicle dry mass and frequently extends diagnostic testing periods by 20%. Furthermore, prolonged orbit insertion timelines inherent to low-thrust systems expose sensitive electronic components to cumulative degradation, compelling operators to install heavier radiation shielding frameworks that increase overall manufacturing expenses by 15%.
  • Simultaneously, severe noble gas market volatility continues to inflate the procurement costs of high-purity xenon propellant, severely disrupting long-term financial planning for orbital drag compensation operations and multi-year constellation deployments.

Exclusive Technavio Analysis on Customer Landscape

The electric propulsion satellite market forecasting report includes the adoption lifecycle of the market, covering from the innovator’s stage to the laggard’s stage. It focuses on adoption rates in different regions based on penetration. Furthermore, the electric propulsion satellite market report also includes key purchase criteria and drivers of price sensitivity to help companies evaluate and develop their market growth analysis strategies.
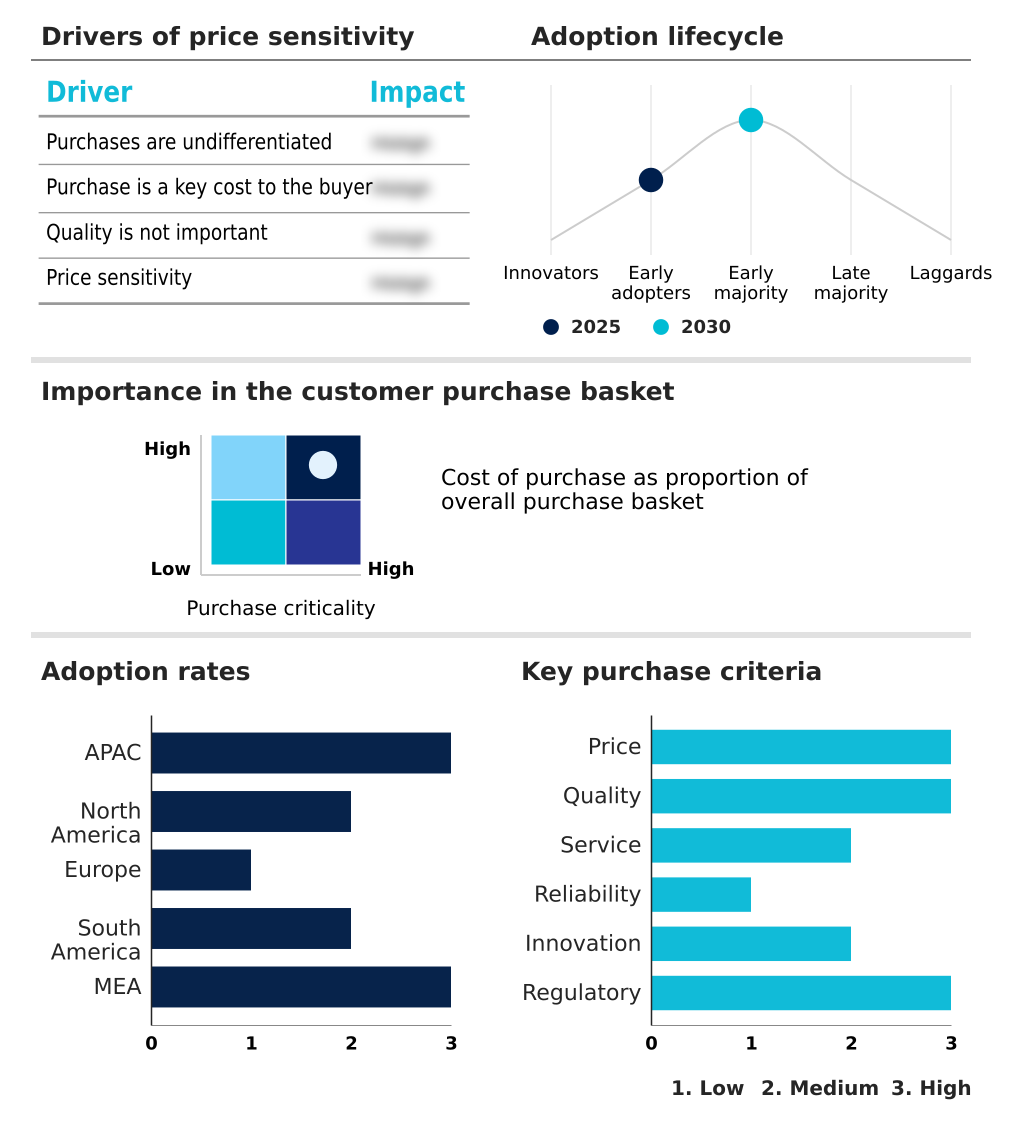
Customer Landscape of Electric Propulsion Satellite Industry

Competitive Landscape

Companies are implementing various strategies, such as strategic alliances, electric propulsion satellite market forecast, partnerships, mergers and acquisitions, geographical expansion, and product/service launches, to enhance their presence in the industry.

Airbus SE - The provider delivers advanced electric propulsion satellite platforms and miniaturized thruster solutions engineered to enhance orbital maneuverability and extend operational lifespans across commercial and defense deployments.

The industry research and growth report includes detailed analyses of the competitive landscape of the market and information about key companies, including:

  • Airbus SE
  • Aliena Pte Ltd
  • Aurora Propulsion Technologies
  • Bellatrix Aerospace
  • Benchmark Space Systems
  • Busek Co. Inc.
  • ENPULSION GmbH
  • Exotrail SA
  • IHI Corp.
  • L3Harris Technologies Inc.
  • Mitsubishi Electric Corp.
  • Morpheus Space
  • Neumann Space
  • Orbion Space Technology
  • Phase Four
  • Safran SA
  • Sitael S.p.A.
  • Space Electric Thruster Systems
  • Thales Alenia Space
  • ThrustMe

Qualitative and quantitative analysis of companies has been conducted to help clients understand the wider business environment as well as the strengths and weaknesses of key industry players. Data is qualitatively analyzed to categorize companies as pure play, category-focused, industry-focused, and diversified; it is quantitatively analyzed to categorize companies as dominant, leading, strong, tentative, and weak.

Recent Development and News in Electric propulsion satellite market

  • In the Aerospace and Defense industry, the aggressive deployment of hyper-scale low Earth orbit telecommunication constellations requiring over 95% automated collision avoidance maneuvers accelerated the demand for precise Electric Propulsion Satellite systems.
  • The structural transition toward solid iodine and krypton propellants to bypass noble gas supply chain constraints lowered high-pressure tank mass requirements by 40%, directly expanding the adoption of lightweight Electric Propulsion Satellite architectures.
  • Stricter international space debris mitigation guidelines mandated active end-of-life deorbiting capabilities within a 25-year operational window, accelerating the integration of standardized Electric Propulsion Satellite modules across commercial spacecraft platforms.
  • The consolidation of specialized aerospace component manufacturers through cross-border acquisitions reduced procurement friction and improved production throughput by 25%, optimizing supply chain resilience for mass-produced Electric Propulsion Satellite platforms.

Dive into Technavio’s robust research methodology, blending expert interviews, extensive data synthesis, and validated models for unparalleled Electric Propulsion Satellite Market insights. See full methodology.

Market Scope
Page number 290
Base year 2025
Historic period 2020-2024
Forecast period 2026-2030
Growth momentum & CAGR Accelerate at a CAGR of 9.4%
Market growth 2026-2030 USD 12220.4 million
Market structure Fragmented
YoY growth 2025-2026(%) 9.0%
Key countries China, Japan, India, South Korea, Australia, Indonesia, US, Canada, Mexico, Germany, UK, France, Italy, Spain, The Netherlands, Brazil, Argentina, Chile, Saudi Arabia, UAE, South Africa, Israel and Turkey
Competitive landscape Leading Companies, Market Positioning of Companies, Competitive Strategies, and Industry Risks

Request Free Sample

Research Analyst Overview

  • The Electric Propulsion Satellite sector is fundamentally reshaping the economics and operational architecture of the modern aerospace industry. Spacecraft integrators are rapidly pivoting toward high-efficiency mobility ecosystems to ensure sustainable, long-term asset management in congested orbital environments.
  • As mission requirements become increasingly sophisticated, the transition toward alternative iodine propellant and krypton propellant directly informs boardroom-level procurement strategies, enabling executives to bypass the intense supply chain bottlenecks associated with volatile rare gas markets. This critical fuel diversification strategy ensures that mass-produced satellite bus architecture remains financially viable and logistically secure.
  • By leveraging advanced hall effect thrusters and optimizing the propellant mass fraction, satellite operators have successfully increased effective payload capacity by 45% relative to conventional chemical propulsion designs. Furthermore, the integration of intelligent power processing units allows for exceptionally precise reaction wheel desaturation, safeguarding critical communication payloads.
  • As commercial and defense entities continue to demand enhanced maneuverability, continuous investment in high-performance electrostatic acceleration mechanisms will remain a foundational pillar for establishing resilient, multi-decade space operations globally.

What are the Key Data Covered in this Electric Propulsion Satellite Market Research and Growth Report?

  • What is the expected growth of the Electric Propulsion Satellite Market between 2026 and 2030?

    • USD 12.22 billion, at a CAGR of 9.4%

  • What segmentation does the market report cover?

    • The report is segmented by Application (Military, and Commercial), Type (Hybrid, and All-electric), Technology (Electrothermal propulsion, Electrostatic propulsion, and Electromagnetic propulsion) and Geography (APAC, North America, Europe, South America, Middle East and Africa)

  • Which regions are analyzed in the report?

    • APAC, North America, Europe, South America and Middle East and Africa

  • What are the key growth drivers and market challenges?

    • Profound mass reduction efficiencies transforming spacecraft economics and lowering initial launch procurement capital expenditures, Prolonged orbit raising timelines and heightened radiation exposure risks inhibiting rapid commercial mission deployments

  • Who are the major players in the Electric Propulsion Satellite Market?

    • Airbus SE, Aliena Pte Ltd, Aurora Propulsion Technologies, Bellatrix Aerospace, Benchmark Space Systems, Busek Co. Inc., ENPULSION GmbH, Exotrail SA, IHI Corp., L3Harris Technologies Inc., Mitsubishi Electric Corp., Morpheus Space, Neumann Space, Orbion Space Technology, Phase Four, Safran SA, Sitael S.p.A., Space Electric Thruster Systems, Thales Alenia Space and ThrustMe

Market Research Insights

  • The Electric Propulsion Satellite Market is evolving rapidly as international constellation operators prioritize high-efficiency orbital maneuverability. By integrating advanced thermal dissipation networks, spacecraft manufacturers have improved component cooling efficiency by 25%, drastically enhancing overall platform reliability.
  • Furthermore, the strategic adoption of plug and play modules has streamlined manufacturing workflows, reducing average satellite assembly times by over 30% compared to custom-engineered legacy architectures. This transition ensures that autonomous navigation software can execute highly precise station-keeping corrections across massive low earth orbit constellations without depleting fuel reserves prematurely.
  • Consequently, aerospace prime contractors are executing rapid deployment cycles to secure operational dominance, effectively insulating their supply chains from unpredictable noble gas market volatility while maximizing asset longevity.

We can help! Our analysts can customize this electric propulsion satellite market research report to meet your requirements.

Get in touch

1. Executive Summary

1.1 Market overview

Executive Summary - Chart on Market Overview
Executive Summary - Data Table on Market Overview
Executive Summary - Chart on Global Market Characteristics
Executive Summary - Chart on Market by Geography
Executive Summary - Chart on Market Segmentation by Application
Executive Summary - Chart on Market Segmentation by Type
Executive Summary - Chart on Market Segmentation by Technology
Executive Summary - Chart on Incremental Growth
Executive Summary - Data Table on Incremental Growth
Executive Summary - Chart on Company Market Positioning

2. Technavio Analysis

2.1 Analysis of price sensitivity, lifecycle, customer purchase basket, adoption rates, and purchase criteria

2.2 Criticality of inputs and Factors of differentiation

Chart on Overview on criticality of inputs and factors of differentiation

2.3 Factors of disruption

Chart on Overview on factors of disruption

2.4 Impact of drivers and challenges

Chart on Impact of drivers and challenges in 2025 and 2030

3. Market Landscape

3.1 Market ecosystem

Chart on Parent Market
Data Table on - Parent Market

3.2 Market characteristics

Chart on Market characteristics analysis

3.3 Value chain analysis

Chart on Value chain analysis

4. Market Sizing

4.1 Market definition

Data Table on Offerings of companies included in the market definition

4.2 Market segment analysis

Market segments

4.3 Market size 2025

4.4 Market outlook: Forecast for 2025-2030

Chart on Global - Market size and forecast 2025-2030 ($ million)
Data Table on Global - Market size and forecast 2025-2030 ($ million)
Chart on Global Market: Year-over-year growth 2025-2030 (%)
Data Table on Global Market: Year-over-year growth 2025-2030 (%)

5. Historic Market Size

5.1 Global Electric Propulsion Satellite Market 2020 - 2024

Historic Market Size - Data Table on Global Electric Propulsion Satellite Market 2020 - 2024 ($ million)

5.2 Application segment analysis 2020 - 2024

Historic Market Size - Application Segment 2020 - 2024 ($ million)

5.3 Type segment analysis 2020 - 2024

Historic Market Size - Type Segment 2020 - 2024 ($ million)

5.4 Technology segment analysis 2020 - 2024

Historic Market Size - Technology Segment 2020 - 2024 ($ million)

5.5 Geography segment analysis 2020 - 2024

Historic Market Size - Geography Segment 2020 - 2024 ($ million)

5.6 Country segment analysis 2020 - 2024

Historic Market Size - Country Segment 2020 - 2024 ($ million)

6. Qualitative Analysis

6.1 Impact of AI on global electric propulsion satellite market

6.2 Impact of geopolitical conflicts on global electric propulsion satellite market

7. Five Forces Analysis

7.1 Five forces summary

Five forces analysis - Comparison between 2025 and 2030

7.2 Bargaining power of buyers

Bargaining power of buyers - Impact of key factors 2025 and 2030

7.3 Bargaining power of suppliers

Bargaining power of suppliers - Impact of key factors in 2025 and 2030

7.4 Threat of new entrants

Threat of new entrants - Impact of key factors in 2025 and 2030

7.5 Threat of substitutes

Threat of substitutes - Impact of key factors in 2025 and 2030

7.6 Threat of rivalry

Threat of rivalry - Impact of key factors in 2025 and 2030

7.7 Market condition

Chart on Market condition - Five forces 2025 and 2030

8. Market Segmentation by Application

8.1 Market segments

Chart on Application - Market share 2025-2030 (%)
Data Table on Application - Market share 2025-2030 (%)

8.2 Comparison by Application

Chart on Comparison by Application
Data Table on Comparison by Application

8.3 Military - Market size and forecast 2025-2030

Chart on Military - Market size and forecast 2025-2030 ($ million)
Data Table on Military - Market size and forecast 2025-2030 ($ million)
Chart on Military - Year-over-year growth 2025-2030 (%)
Data Table on Military - Year-over-year growth 2025-2030 (%)

8.4 Commercial - Market size and forecast 2025-2030

Chart on Commercial - Market size and forecast 2025-2030 ($ million)
Data Table on Commercial - Market size and forecast 2025-2030 ($ million)
Chart on Commercial - Year-over-year growth 2025-2030 (%)
Data Table on Commercial - Year-over-year growth 2025-2030 (%)

8.5 Market opportunity by Application

Market opportunity by Application ($ million)
Data Table on Market opportunity by Application ($ million)

9. Market Segmentation by Type

9.1 Market segments

Chart on Type - Market share 2025-2030 (%)
Data Table on Type - Market share 2025-2030 (%)

9.2 Comparison by Type

Chart on Comparison by Type
Data Table on Comparison by Type

9.3 Hybrid - Market size and forecast 2025-2030

Chart on Hybrid - Market size and forecast 2025-2030 ($ million)
Data Table on Hybrid - Market size and forecast 2025-2030 ($ million)
Chart on Hybrid - Year-over-year growth 2025-2030 (%)
Data Table on Hybrid - Year-over-year growth 2025-2030 (%)

9.4 All-electric - Market size and forecast 2025-2030

Chart on All-electric - Market size and forecast 2025-2030 ($ million)
Data Table on All-electric - Market size and forecast 2025-2030 ($ million)
Chart on All-electric - Year-over-year growth 2025-2030 (%)
Data Table on All-electric - Year-over-year growth 2025-2030 (%)

9.5 Market opportunity by Type

Market opportunity by Type ($ million)
Data Table on Market opportunity by Type ($ million)

10. Market Segmentation by Technology

10.1 Market segments

Chart on Technology - Market share 2025-2030 (%)
Data Table on Technology - Market share 2025-2030 (%)

10.2 Comparison by Technology

Chart on Comparison by Technology
Data Table on Comparison by Technology

10.3 Electrothermal propulsion - Market size and forecast 2025-2030

Chart on Electrothermal propulsion - Market size and forecast 2025-2030 ($ million)
Data Table on Electrothermal propulsion - Market size and forecast 2025-2030 ($ million)
Chart on Electrothermal propulsion - Year-over-year growth 2025-2030 (%)
Data Table on Electrothermal propulsion - Year-over-year growth 2025-2030 (%)

10.4 Electrostatic propulsion - Market size and forecast 2025-2030

Chart on Electrostatic propulsion - Market size and forecast 2025-2030 ($ million)
Data Table on Electrostatic propulsion - Market size and forecast 2025-2030 ($ million)
Chart on Electrostatic propulsion - Year-over-year growth 2025-2030 (%)
Data Table on Electrostatic propulsion - Year-over-year growth 2025-2030 (%)

10.5 Electromagnetic propulsion - Market size and forecast 2025-2030

Chart on Electromagnetic propulsion - Market size and forecast 2025-2030 ($ million)
Data Table on Electromagnetic propulsion - Market size and forecast 2025-2030 ($ million)
Chart on Electromagnetic propulsion - Year-over-year growth 2025-2030 (%)
Data Table on Electromagnetic propulsion - Year-over-year growth 2025-2030 (%)

10.6 Market opportunity by Technology

Market opportunity by Technology ($ million)
Data Table on Market opportunity by Technology ($ million)

11. Customer Landscape

11.1 Customer landscape overview

Analysis of price sensitivity, lifecycle, customer purchase basket, adoption rates, and purchase criteria

12. Geographic Landscape

12.1 Geographic segmentation

Chart on Market share by geography 2025-2030 (%)
Data Table on Market share by geography 2025-2030 (%)

12.2 Geographic comparison

Chart on Geographic comparison
Data Table on Geographic comparison

12.3 APAC - Market size and forecast 2025-2030

Chart on APAC - Market size and forecast 2025-2030 ($ million)
Data Table on APAC - Market size and forecast 2025-2030 ($ million)
Chart on APAC - Year-over-year growth 2025-2030 (%)
Data Table on APAC - Year-over-year growth 2025-2030 (%)
Chart on Regional Comparison - APAC
Data Table on Regional Comparison - APAC

12.3.1 China - Market size and forecast 2025-2030

Chart on China - Market size and forecast 2025-2030 ($ million)
Data Table on China - Market size and forecast 2025-2030 ($ million)
Chart on China - Year-over-year growth 2025-2030 (%)
Data Table on China - Year-over-year growth 2025-2030 (%)

12.3.2 Japan - Market size and forecast 2025-2030

Chart on Japan - Market size and forecast 2025-2030 ($ million)
Data Table on Japan - Market size and forecast 2025-2030 ($ million)
Chart on Japan - Year-over-year growth 2025-2030 (%)
Data Table on Japan - Year-over-year growth 2025-2030 (%)

12.3.3 India - Market size and forecast 2025-2030

Chart on India - Market size and forecast 2025-2030 ($ million)
Data Table on India - Market size and forecast 2025-2030 ($ million)
Chart on India - Year-over-year growth 2025-2030 (%)
Data Table on India - Year-over-year growth 2025-2030 (%)

12.3.4 South Korea - Market size and forecast 2025-2030

Chart on South Korea - Market size and forecast 2025-2030 ($ million)
Data Table on South Korea - Market size and forecast 2025-2030 ($ million)
Chart on South Korea - Year-over-year growth 2025-2030 (%)
Data Table on South Korea - Year-over-year growth 2025-2030 (%)

12.3.5 Australia - Market size and forecast 2025-2030

Chart on Australia - Market size and forecast 2025-2030 ($ million)
Data Table on Australia - Market size and forecast 2025-2030 ($ million)
Chart on Australia - Year-over-year growth 2025-2030 (%)
Data Table on Australia - Year-over-year growth 2025-2030 (%)

12.3.6 Indonesia - Market size and forecast 2025-2030

Chart on Indonesia - Market size and forecast 2025-2030 ($ million)
Data Table on Indonesia - Market size and forecast 2025-2030 ($ million)
Chart on Indonesia - Year-over-year growth 2025-2030 (%)
Data Table on Indonesia - Year-over-year growth 2025-2030 (%)

12.4 North America - Market size and forecast 2025-2030

Chart on North America - Market size and forecast 2025-2030 ($ million)
Data Table on North America - Market size and forecast 2025-2030 ($ million)
Chart on North America - Year-over-year growth 2025-2030 (%)
Data Table on North America - Year-over-year growth 2025-2030 (%)
Chart on Regional Comparison - North America
Data Table on Regional Comparison - North America

12.4.1 US - Market size and forecast 2025-2030

Chart on US - Market size and forecast 2025-2030 ($ million)
Data Table on US - Market size and forecast 2025-2030 ($ million)
Chart on US - Year-over-year growth 2025-2030 (%)
Data Table on US - Year-over-year growth 2025-2030 (%)

12.4.2 Canada - Market size and forecast 2025-2030

Chart on Canada - Market size and forecast 2025-2030 ($ million)
Data Table on Canada - Market size and forecast 2025-2030 ($ million)
Chart on Canada - Year-over-year growth 2025-2030 (%)
Data Table on Canada - Year-over-year growth 2025-2030 (%)

12.4.3 Mexico - Market size and forecast 2025-2030

Chart on Mexico - Market size and forecast 2025-2030 ($ million)
Data Table on Mexico - Market size and forecast 2025-2030 ($ million)
Chart on Mexico - Year-over-year growth 2025-2030 (%)
Data Table on Mexico - Year-over-year growth 2025-2030 (%)

12.5 Europe - Market size and forecast 2025-2030

Chart on Europe - Market size and forecast 2025-2030 ($ million)
Data Table on Europe - Market size and forecast 2025-2030 ($ million)
Chart on Europe - Year-over-year growth 2025-2030 (%)
Data Table on Europe - Year-over-year growth 2025-2030 (%)
Chart on Regional Comparison - Europe
Data Table on Regional Comparison - Europe

12.5.1 Germany - Market size and forecast 2025-2030

Chart on Germany - Market size and forecast 2025-2030 ($ million)
Data Table on Germany - Market size and forecast 2025-2030 ($ million)
Chart on Germany - Year-over-year growth 2025-2030 (%)
Data Table on Germany - Year-over-year growth 2025-2030 (%)

12.5.2 UK - Market size and forecast 2025-2030

Chart on UK - Market size and forecast 2025-2030 ($ million)
Data Table on UK - Market size and forecast 2025-2030 ($ million)
Chart on UK - Year-over-year growth 2025-2030 (%)
Data Table on UK - Year-over-year growth 2025-2030 (%)

12.5.3 France - Market size and forecast 2025-2030

Chart on France - Market size and forecast 2025-2030 ($ million)
Data Table on France - Market size and forecast 2025-2030 ($ million)
Chart on France - Year-over-year growth 2025-2030 (%)
Data Table on France - Year-over-year growth 2025-2030 (%)

12.5.4 Italy - Market size and forecast 2025-2030

Chart on Italy - Market size and forecast 2025-2030 ($ million)
Data Table on Italy - Market size and forecast 2025-2030 ($ million)
Chart on Italy - Year-over-year growth 2025-2030 (%)
Data Table on Italy - Year-over-year growth 2025-2030 (%)

12.5.5 Spain - Market size and forecast 2025-2030

Chart on Spain - Market size and forecast 2025-2030 ($ million)
Data Table on Spain - Market size and forecast 2025-2030 ($ million)
Chart on Spain - Year-over-year growth 2025-2030 (%)
Data Table on Spain - Year-over-year growth 2025-2030 (%)

12.5.6 The Netherlands - Market size and forecast 2025-2030

Chart on The Netherlands - Market size and forecast 2025-2030 ($ million)
Data Table on The Netherlands - Market size and forecast 2025-2030 ($ million)
Chart on The Netherlands - Year-over-year growth 2025-2030 (%)
Data Table on The Netherlands - Year-over-year growth 2025-2030 (%)

12.6 South America - Market size and forecast 2025-2030

Chart on South America - Market size and forecast 2025-2030 ($ million)
Data Table on South America - Market size and forecast 2025-2030 ($ million)
Chart on South America - Year-over-year growth 2025-2030 (%)
Data Table on South America - Year-over-year growth 2025-2030 (%)
Chart on Regional Comparison - South America
Data Table on Regional Comparison - South America

12.6.1 Brazil - Market size and forecast 2025-2030

Chart on Brazil - Market size and forecast 2025-2030 ($ million)
Data Table on Brazil - Market size and forecast 2025-2030 ($ million)
Chart on Brazil - Year-over-year growth 2025-2030 (%)
Data Table on Brazil - Year-over-year growth 2025-2030 (%)

12.6.2 Argentina - Market size and forecast 2025-2030

Chart on Argentina - Market size and forecast 2025-2030 ($ million)
Data Table on Argentina - Market size and forecast 2025-2030 ($ million)
Chart on Argentina - Year-over-year growth 2025-2030 (%)
Data Table on Argentina - Year-over-year growth 2025-2030 (%)

12.6.3 Chile - Market size and forecast 2025-2030

Chart on Chile - Market size and forecast 2025-2030 ($ million)
Data Table on Chile - Market size and forecast 2025-2030 ($ million)
Chart on Chile - Year-over-year growth 2025-2030 (%)
Data Table on Chile - Year-over-year growth 2025-2030 (%)

12.7 Middle East and Africa - Market size and forecast 2025-2030

Chart on Middle East and Africa - Market size and forecast 2025-2030 ($ million)
Data Table on Middle East and Africa - Market size and forecast 2025-2030 ($ million)
Chart on Middle East and Africa - Year-over-year growth 2025-2030 (%)
Data Table on Middle East and Africa - Year-over-year growth 2025-2030 (%)
Chart on Regional Comparison - Middle East and Africa
Data Table on Regional Comparison - Middle East and Africa

12.7.1 Saudi Arabia - Market size and forecast 2025-2030

Chart on Saudi Arabia - Market size and forecast 2025-2030 ($ million)
Data Table on Saudi Arabia - Market size and forecast 2025-2030 ($ million)
Chart on Saudi Arabia - Year-over-year growth 2025-2030 (%)
Data Table on Saudi Arabia - Year-over-year growth 2025-2030 (%)

12.7.2 UAE - Market size and forecast 2025-2030

Chart on UAE - Market size and forecast 2025-2030 ($ million)
Data Table on UAE - Market size and forecast 2025-2030 ($ million)
Chart on UAE - Year-over-year growth 2025-2030 (%)
Data Table on UAE - Year-over-year growth 2025-2030 (%)

12.7.3 South Africa - Market size and forecast 2025-2030

Chart on South Africa - Market size and forecast 2025-2030 ($ million)
Data Table on South Africa - Market size and forecast 2025-2030 ($ million)
Chart on South Africa - Year-over-year growth 2025-2030 (%)
Data Table on South Africa - Year-over-year growth 2025-2030 (%)

12.7.4 Israel - Market size and forecast 2025-2030

Chart on Israel - Market size and forecast 2025-2030 ($ million)
Data Table on Israel - Market size and forecast 2025-2030 ($ million)
Chart on Israel - Year-over-year growth 2025-2030 (%)
Data Table on Israel - Year-over-year growth 2025-2030 (%)

12.7.5 Turkey - Market size and forecast 2025-2030

Chart on Turkey - Market size and forecast 2025-2030 ($ million)
Data Table on Turkey - Market size and forecast 2025-2030 ($ million)
Chart on Turkey - Year-over-year growth 2025-2030 (%)
Data Table on Turkey - Year-over-year growth 2025-2030 (%)

12.8 Market opportunity by geography

Market opportunity by geography ($ million)
Data Tables on Market opportunity by geography ($ million)

13. Drivers, Challenges, and Opportunity

13.1 Market drivers

Profound mass reduction efficiencies transforming spacecraft economics and lowering initial launch procurement capital expenditures
Aggressive deployment dynamics of hyper scale low earth orbit telecommunication constellations demanding continuous maneuverability
Substantial extension of mission operational lifespans for high value geostationary earth orbit communication assets

13.2 Market challenges

Prolonged orbit raising timelines and heightened radiation exposure risks inhibiting rapid commercial mission deployments
Severe supply chain vulnerabilities and cost escalation compounded by volatile international xenon gas markets
Intense thermal management demands and subsystem integration constraints driven by high power processing units

13.3 Impact of drivers and challenges

Impact of drivers and challenges in 2025 and 2030

13.4 Market opportunities

Widespread technical transition toward eco friendly alternative propellants to replace volatile rare gas sourcing channels
Rapid commercial implementation of modular low cost plug and play thruster ensembles for small spacecraft
Accelerated strategic capital realignment via focused cross border aerospace acquisitions of advanced propulsion developers

14. Competitive Landscape

14.1 Overview

14.2

Overview on criticality of inputs and factors of differentiation

14.3 Landscape disruption

Overview on factors of disruption

14.4 Industry risks

Impact of key risks on business

15. Competitive Analysis

15.1 Companies profiled

Companies covered

15.2 Company ranking index

15.3 Market positioning of companies

Matrix on companies position and classification

15.4 Airbus SE

Airbus SE - Overview
Airbus SE - Business segments
Airbus SE - Key news
Airbus SE - Key offerings
Airbus SE - Segment focus
SWOT

15.5 Aliena Pte Ltd

Aliena Pte Ltd - Overview
Aliena Pte Ltd - Product / Service
Aliena Pte Ltd - Key offerings
SWOT

15.6 Bellatrix Aerospace

Bellatrix Aerospace - Overview
Bellatrix Aerospace - Product / Service
Bellatrix Aerospace - Key offerings
SWOT

15.7 Busek Co. Inc.

Busek Co. Inc. - Overview
Busek Co. Inc. - Product / Service
Busek Co. Inc. - Key offerings
SWOT

15.8 ENPULSION GmbH

ENPULSION GmbH - Overview
ENPULSION GmbH - Product / Service
ENPULSION GmbH - Key offerings
SWOT

15.9 Exotrail SA

Exotrail SA - Overview
Exotrail SA - Product / Service
Exotrail SA - Key offerings
SWOT

15.10 IHI Corp.

IHI Corp. - Overview
IHI Corp. - Business segments
IHI Corp. - Key offerings
IHI Corp. - Segment focus
SWOT

15.11 L3Harris Technologies Inc.

L3Harris Technologies Inc. - Overview
L3Harris Technologies Inc. - Business segments
L3Harris Technologies Inc. - Key offerings
L3Harris Technologies Inc. - Segment focus
SWOT

15.12 Mitsubishi Electric Corp.

Mitsubishi Electric Corp. - Overview
Mitsubishi Electric Corp. - Business segments
Mitsubishi Electric Corp. - Key offerings
Mitsubishi Electric Corp. - Segment focus
SWOT

15.13 Morpheus Space

Morpheus Space - Overview
Morpheus Space - Product / Service
Morpheus Space - Key offerings
SWOT

15.14 Orbion Space Technology

Orbion Space Technology - Overview
Orbion Space Technology - Product / Service
Orbion Space Technology - Key offerings
SWOT

15.15 Phase Four

Phase Four - Overview
Phase Four - Product / Service
Phase Four - Key offerings
SWOT

15.16 Safran SA

Safran SA - Overview
Safran SA - Business segments
Safran SA - Key offerings
Safran SA - Segment focus
SWOT

15.17 Sitael S.p.A.

Sitael S.p.A. - Overview
Sitael S.p.A. - Product / Service
Sitael S.p.A. - Key offerings
SWOT

15.18 Thales Alenia Space

Thales Alenia Space - Overview
Thales Alenia Space - Product / Service
Thales Alenia Space - Key offerings
SWOT

16. Appendix

16.1 Scope of the report

Market definition
Objectives
Notes and caveats

16.2 Inclusions and exclusions checklist

Inclusions checklist
Exclusions checklist

16.3 Currency conversion rates for US$

16.4 Research methodology

16.5 Data procurement

Information sources

16.6 Data validation

16.7 Validation techniques employed for market sizing

16.8 Data synthesis

16.9 360 degree market analysis

16.10 List of abbreviations

Research Methodology

Technavio presents a detailed picture of the market by way of study, synthesis, and summation of data from multiple sources. The analysts have presented the various facets of the market with a particular focus on identifying the key industry influencers. The data thus presented is comprehensive, reliable, and the result of extensive research, both primary and secondary.

INFORMATION SOURCES

Primary sources

  • Manufacturers and suppliers
  • Channel partners
  • Industry experts
  • Strategic decision makers

Secondary sources

  • Industry journals and periodicals
  • Government data
  • Financial reports of key industry players
  • Historical data
  • Press releases

DATA ANALYSIS

Data Synthesis

  • Collation of data
  • Estimation of key figures
  • Analysis of derived insights

Data Validation

  • Triangulation with data models
  • Reference against proprietary databases
  • Corroboration with industry experts

REPORT WRITING

Qualitative

  • Market drivers
  • Market challenges
  • Market trends
  • Five forces analysis

Quantitative

  • Market size and forecast
  • Market segmentation
  • Geographical insights
  • Competitive landscape

Interested in this report?

Get your sample now to see our research methodology and insights!

Download Now

Frequently Asked Questions

Electric Propulsion Satellite market growth will increase by USD 12220.4 million during 2026-2030.

The Electric Propulsion Satellite market is expected to grow at a CAGR of 9.4% during 2026-2030.

Electric Propulsion Satellite market is segmented by Application (Military, Commercial) Type (Hybrid, All-electric) Technology (Electrothermal propulsion, Electrostatic propulsion, Electromagnetic propulsion)

Airbus SE, Aliena Pte Ltd, Aurora Propulsion Technologies, Bellatrix Aerospace, Benchmark Space Systems, Busek Co. Inc., ENPULSION GmbH, Exotrail SA, IHI Corp., L3Harris Technologies Inc., Mitsubishi Electric Corp., Morpheus Space, Neumann Space, Orbion Space Technology, Phase Four, Safran SA, Sitael S.p.A., Space Electric Thruster Systems, Thales Alenia Space, ThrustMe are a few of the key vendors in the Electric Propulsion Satellite market.

APAC will register the highest growth rate of 41.7% among the other regions. Therefore, the Electric Propulsion Satellite market in APAC is expected to garner significant business opportunities for the vendors during the forecast period.

China, Japan, India, South Korea, Australia, Indonesia, US, Canada, Mexico, Germany, UK, France, Italy, Spain, The Netherlands, Brazil, Argentina, Chile, Saudi Arabia, UAE, South Africa, Israel, Turkey

  • Profound mass reduction efficiencies transforming spacecraft economics and lowering initial launch procurement capital expenditures is the driving factor this market.

The Electric Propulsion Satellite market vendors should focus on grabbing business opportunities from the Application segment as it accounted for the largest market share in the base year.
RIA - Research AI Assistant
Ask RIA