Small Satellite Market Analysis, Size, and Forecast 2026-2030: North America (US, Canada, and Mexico), APAC (China, Japan, and India), Europe (UK, Germany, and France), Middle East and Africa (UAE, Saudi Arabia, and South Africa), South America (Brazil, Argentina, and Colombia), and Rest of World (ROW)

Small Satellite Market Analysis, Size, and Forecast 2026-2030:
North America (US, Canada, and Mexico), APAC (China, Japan, and India), Europe (UK, Germany, and France), Middle East and Africa (UAE, Saudi Arabia, and South Africa), South America (Brazil, Argentina, and Colombia), and Rest of World (ROW)

Published: Mar 2026 334 Pages SKU: IRTNTR75872

Market Overview at a Glance

$8.55 B
Market Opportunity
21.3%
CAGR 2025 - 2030
34.7%
North America Growth
$1.57 B
Earth observation and remote sensing segment 2024

Small Satellite Market Size 2026-2030

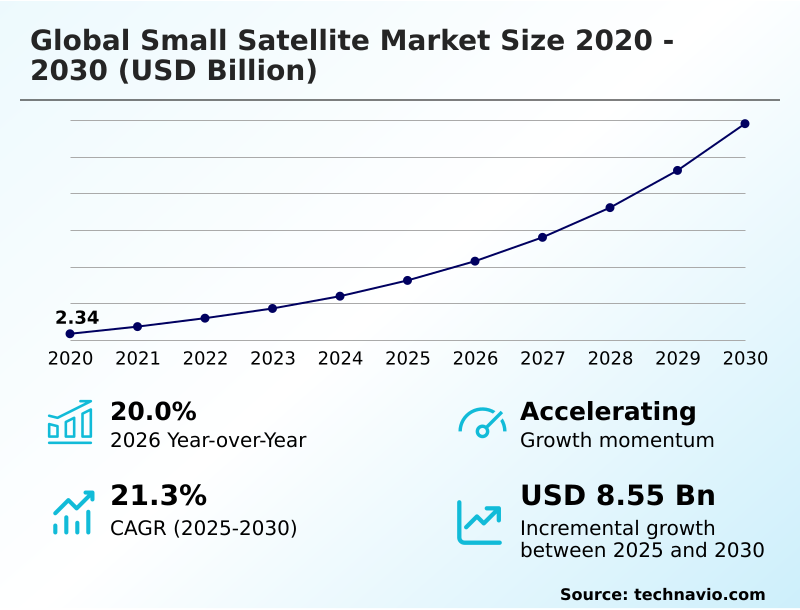
The small satellite market size is valued to increase by USD 8.55 billion, at a CAGR of 21.3% from 2025 to 2030. Democratizing space access with rideshare launches will drive the small satellite market.

Major Market Trends & Insights

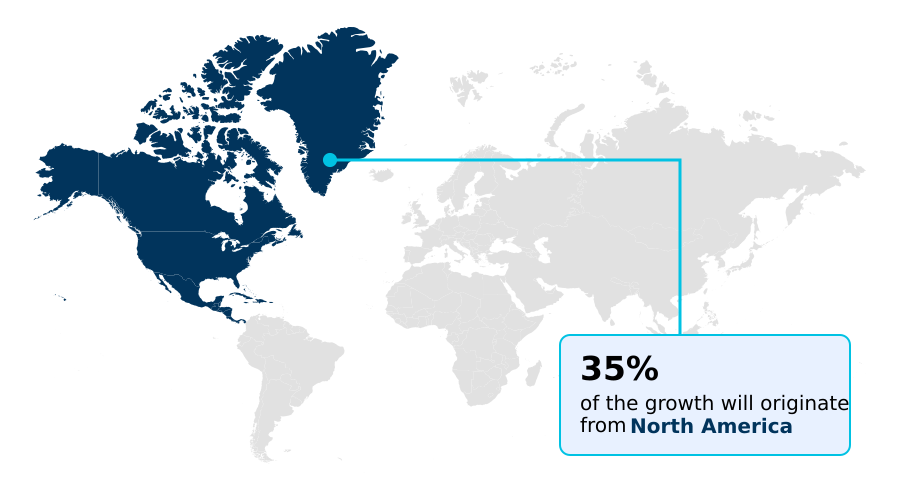
  • North America dominated the market and accounted for a 34.7% growth during the forecast period.
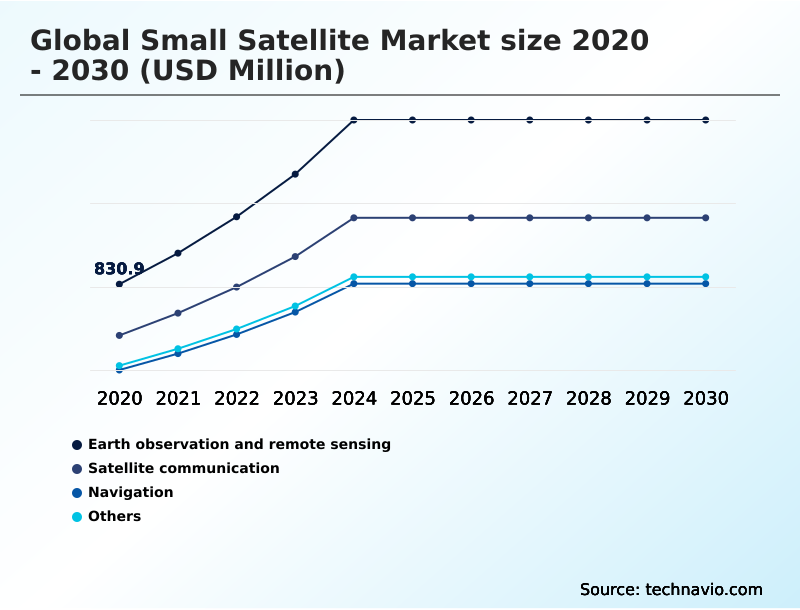
  • By Application - Earth observation and remote sensing segment was valued at USD 1.57 billion in 2024
  • By Type - Minisatellite segment accounted for the largest market revenue share in 2024

Market Size & Forecast

  • Market Opportunities: USD 11.45 billion
  • Market Future Opportunities: USD 8.55 billion
  • CAGR from 2025 to 2030 : 21.3%

Market Summary

  • The small satellite market is undergoing a period of significant growth, fueled by technological advancements and expanding commercial demand. This dynamic market is characterized by rapid innovation, with new applications emerging at an unprecedented rate.
  • The proliferation of low earth orbit (LEO) constellations is a key factor, enabling a new era of global connectivity and data services through advanced satellite communication. This environment fosters intense competition, leading to the development of more sophisticated and cost-effective small satellite platforms, including the popular cubesat standard.
  • The market's growth is not just quantitative; it represents a qualitative shift in how space is utilized, with small satellites becoming integral to critical infrastructure worldwide. For instance, a logistics company can now leverage a nanosatellite network for real-time, global asset tracking, a service previously unfeasible due to cost.
  • This capability, alongside developments in earth observation, is reshaping industries by providing timely, actionable data. However, this rapid expansion also brings challenges, such as the need for robust space situational awareness (SSA) to manage orbital congestion and mitigate collision risks. The industry's trajectory points toward increased autonomy, with onboard ai processing becoming standard for data handling and operational efficiency.

What will be the Size of the Small Satellite Market during the forecast period?

Get Key Insights on Market Forecast (PDF) Request Free Sample

How is the Small Satellite Market Segmented?

The small satellite industry research report provides comprehensive data (region-wise segment analysis), with forecasts and estimates in "USD million" for the period 2026-2030, as well as historical data from 2020-2024 for the following segments.

  • Application
    • Earth observation and remote sensing
    • Satellite communication
    • Navigation
    • Others
  • Type
    • Minisatellite
    • Nanosatellite
    • Microsatellite
  • Product type
    • LEO
    • MEO
    • GEO
  • End-user
    • Government and military
    • Commercial
    • Academic
    • Others
  • Geography
    • North America
      • US
      • Canada
      • Mexico
    • APAC
      • China
      • Japan
      • India
    • Europe
      • UK
      • Germany
      • France
    • Middle East and Africa
      • UAE
      • Saudi Arabia
      • South Africa
    • South America
      • Brazil
      • Argentina
      • Colombia
    • Rest of World (ROW)

By Application Insights

The earth observation and remote sensing segment is estimated to witness significant growth during the forecast period.

The earth observation and remote sensing segment is a primary driver within the market, where demand for high-frequency geospatial data is escalating.

This area has been transformed by the use of satellite constellation deployment, enabling daily or even hourly monitoring of changes on the Earth's surface, a feat not possible with older, monolithic satellites.

The market uses a mix of minisatellite, microsatellite, and nanosatellite platforms, each integrated with advanced remote sensing technology. These systems support industries from agriculture to finance by providing actionable intelligence.

Through sophisticated satellite data fusion and analysis, data processing for cloud detection can be optimized by over 40%, allowing for more efficient delivery of valuable information from high-throughput satellite (HTS) networks and those with hyperspectral imaging sensor capabilities.

Request Free Sample

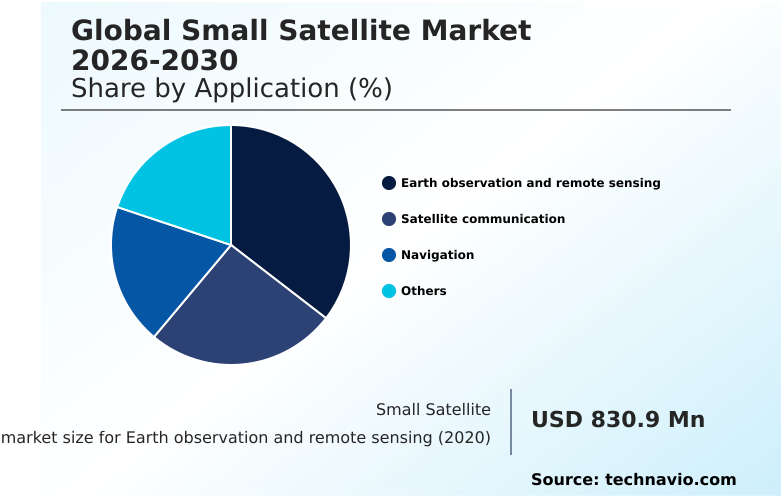
The Earth observation and remote sensing segment was valued at USD 1.57 billion in 2024 and showed a gradual increase during the forecast period.

Request Free Sample

Regional Analysis

North America is estimated to contribute 34.7% to the growth of the global market during the forecast period.Technavio’s analysts have elaborately explained the regional trends and drivers that shape the market during the forecast period.

See How Small Satellite Market Demand is Rising in North America Request Free Sample

The geographic landscape of the small satellite market is led by North America, which accounts for over 34% of the market's incremental growth, driven by extensive private and government investment in the US.

The APAC region is the fastest-growing, with a projected growth rate of 23.5%, as countries like China, India, and Japan expand their sovereign space capabilities. Europe maintains a strong position through collaborative programs and specialized industrial expertise.

Activity is even expanding into geostationary earth orbit (GEO) for specialized missions. A key application driving global adoption is satellite communication, which bridges the digital divide in underserved regions of South America and Africa.

Furthermore, the deployment of synthetic aperture radar (SAR) satellites for all-weather imaging and cubesat platforms for scientific research highlights the technological diversification across all regions.

Market Dynamics

Our researchers analyzed the data with 2025 as the base year, along with the key drivers, trends, and challenges. A holistic analysis of drivers will help companies refine their marketing strategies to gain a competitive advantage.

  • The strategic considerations within the global small satellite market 2026-2030 are increasingly nuanced, focusing on specific trade-offs and applications. A key debate involves minisatellite vs microsatellite capabilities, where operators weigh higher payload capacity against deployment costs. The rapid expansion of the nanosatellite constellation for IoT is a testament to the value of scaled, low-cost platforms for global connectivity.
  • The LEO satellite latency advantage remains a critical differentiator for broadband services, enabling real-time applications that are impossible from higher orbits. For persistent monitoring, the SAR satellite for all-weather imaging provides invaluable data regardless of cloud cover or time of day.
  • Economically, the cost-benefit of COTS components in space has been a primary enabler, though this is balanced by the need for radiation hardening of electronic components in harsher orbits. Operationally, the challenges of space debris mitigation are forcing innovation in end-of-life planning. The use of a software-defined radio for mission flexibility allows operators to adapt to changing market demands post-launch.
  • This adaptability is enhanced by AI for onboard satellite data processing, which can reduce data downlink volumes by over 50%, directly lowering ground segment costs for constellations. Inter-satellite links for mesh networks are creating a resilient, space-based internet backbone. However, regulatory hurdles for spectrum licensing remain a significant barrier.
  • Innovations like electric propulsion for small satellites are extending mission lifecycles, enabling new use cases like the GEO small satellite inspection use case and PNT augmentation with LEO satellites.
  • The complexity of the rideshare mission payload integration process is being streamlined, while advances in phased array antenna for satellite broadband are boosting connectivity speeds, all contributing to the growth in high-revisit rate earth observation services.

What are the key market drivers leading to the rise in the adoption of Small Satellite Industry?

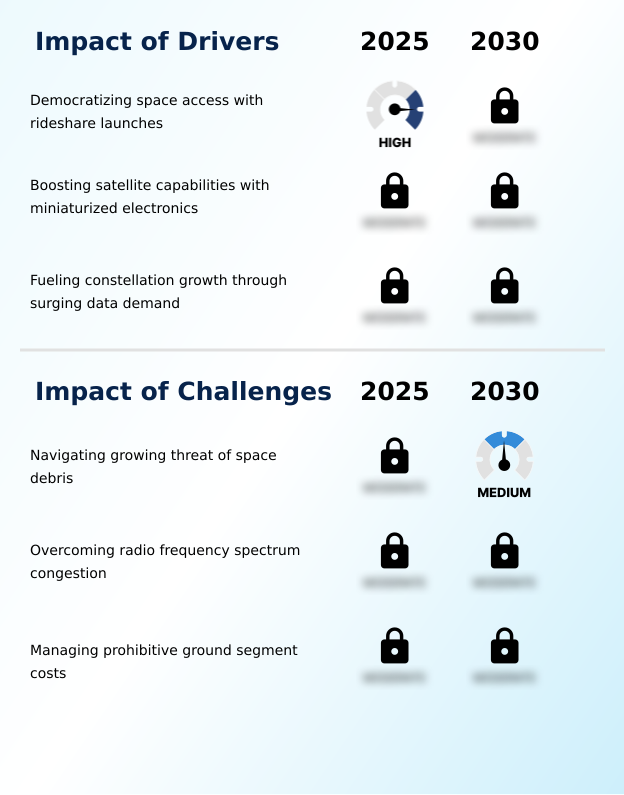
  • The democratization of space access, driven by lower-cost rideshare launches and reusable rocket technology, is a primary factor accelerating market expansion.

  • The market's rapid expansion is fueled by the convergence of several key drivers. The proliferation of rideshare launch mission opportunities and the development of responsive launch capability have democratized space access.
  • Simultaneously, satellite payload miniaturization, underpinned by the availability of high-performance commercial-off-the-shelf (COTS) parts, allows for more capable systems within smaller, lighter satellite bus platform designs.
  • Modern onboard computers, for instance, can now fit within a 10cm x 10cm x 5cm volume while delivering gigaflop-level processing power. This has spurred the growth of sophisticated geospatial data analytics services.
  • Furthermore, nations are increasingly focused on establishing sovereign satellite capability, driving domestic investment in the entire value chain, from manufacturing to on-orbit servicing and manufacturing (OSAM). Advances in phased array antenna technology are also pivotal for enabling high-throughput communication services.

What are the market trends shaping the Small Satellite Industry?

  • The integration of onboard artificial intelligence is enabling a shift toward autonomous satellite operations and real-time, in-orbit data analysis.

  • Key trends are reshaping the global small satellite market 2026-2030, driven by the integration of onboard AI processing and autonomous satellite operations. This allows for edge computing in space, where satellites can analyze data in orbit, with algorithms capable of filtering out unusable imagery, thereby optimizing downlink bandwidth by over 40%.
  • The widespread adoption of optical inter-satellite links (OISL), a form of inter-satellite laser communication, is creating high-speed mesh networks capable of gigabit-per-second data rates. This architecture significantly reduces latency for real-time services. Another transformative trend is in-orbit reconfigurability, enabled by the software-defined radio (SDR) and software-defined satellite payload, allowing operators to repurpose assets after launch.
  • This flexibility is complemented by the increasing use of advanced electric propulsion system technology, extending mission lifetimes and enabling more complex orbital maneuvers.

What challenges does the Small Satellite Industry face during its growth?

  • Navigating the growing threat of orbital debris and space congestion presents a significant challenge to the sustainability and safety of small satellite operations.

  • The market faces significant operational and regulatory challenges. The proliferation of satellites in low earth orbit (LEO) has intensified the problem of orbital debris, with over 36,500 tracked objects larger than 10cm posing a catastrophic risk. This necessitates advanced space situational awareness (SSA) and robust space traffic management (STM) protocols, including adherence to end-of-life deorbiting guidelines.
  • Another major constraint is radio frequency spectrum allocation, a complex and costly process that can significantly delay service deployment. Furthermore, while launch costs have decreased, the high expense of establishing a global ground station network or paying for ground station as a service (GSaaS) remains a substantial financial barrier.
  • Operating in higher orbits like medium earth orbit (MEO) also requires costly radiation-hardened components to withstand the harsh environment, impacting the business case for certain missions.

Exclusive Technavio Analysis on Customer Landscape

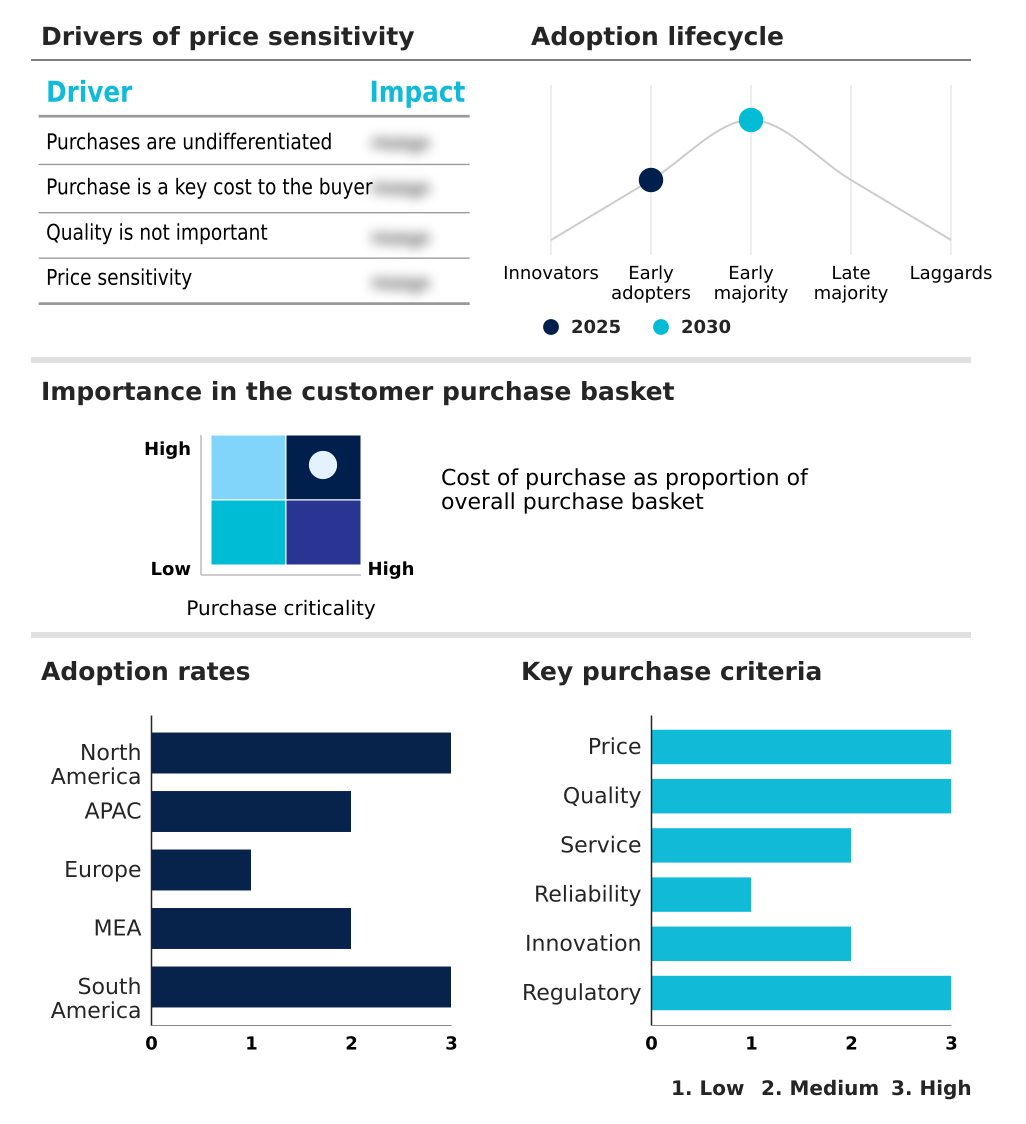
The small satellite market forecasting report includes the adoption lifecycle of the market, covering from the innovator’s stage to the laggard’s stage. It focuses on adoption rates in different regions based on penetration. Furthermore, the small satellite market report also includes key purchase criteria and drivers of price sensitivity to help companies evaluate and develop their market growth analysis strategies.

Customer Landscape of Small Satellite Industry

Competitive Landscape

Companies are implementing various strategies, such as strategic alliances, small satellite market forecast, partnerships, mergers and acquisitions, geographical expansion, and product/service launches, to enhance their presence in the industry.

AAC Clyde Space AB - Offerings encompass integrated small satellite solutions, from mission design and turnkey systems to specialized components and subscription-based data services for diverse applications.

The industry research and growth report includes detailed analyses of the competitive landscape of the market and information about key companies, including:

  • AAC Clyde Space AB
  • Airbus SE
  • Capella Space Corp.
  • China Aerospace S and T Corp.
  • GomSpace Group AB
  • L3Harris Technologies Inc.
  • Lockheed Martin Corp.
  • Maxar Technologies Inc.
  • MDA Corp.
  • Mitsubishi Electric Corp.
  • Northrop Grumman Corp.
  • OHB SE
  • Planet Labs PBC
  • Rocket Lab USA Inc.
  • Sierra Nevada Corp.
  • Space Exploration Tech. Corp.
  • Spire Global Inc.
  • ST Engineering Ltd.
  • Thales Alenia Space
  • The Boeing Co.

Qualitative and quantitative analysis of companies has been conducted to help clients understand the wider business environment as well as the strengths and weaknesses of key industry players. Data is qualitatively analyzed to categorize companies as pure play, category-focused, industry-focused, and diversified; it is quantitatively analyzed to categorize companies as dominant, leading, strong, tentative, and weak.

Recent Development and News in Small satellite market

  • In December, 2024, Airbus Defence and Space received a contract from Eutelsat Communications to build the next-generation OneWeb Low Earth Orbit constellation, ensuring continuity for the satellite broadband network.
  • In January, 2025, The United States National Aeronautics and Space Administration launched the Technology Education Satellite 22 (TES-22) CubeSat to advance educational and technological development objectives.
  • In March, 2025, The Saudi Space Agency announced the launch of two small satellites designed and built by university students as a strategic initiative to cultivate a skilled national workforce for its future space industry.
  • In April, 2025, OHB SE secured a contract to deliver six electric propulsion systems for SWISSto12's small geostationary satellite platform, highlighting the trend toward more efficient and longer-duration missions.

Dive into Technavio’s robust research methodology, blending expert interviews, extensive data synthesis, and validated models for unparalleled Small Satellite Market insights. See full methodology.

Market Scope
Page number 334
Base year 2025
Historic period 2020-2024
Forecast period 2026-2030
Growth momentum & CAGR Accelerate at a CAGR of 21.3%
Market growth 2026-2030 USD 8549.1 million
Market structure Fragmented
YoY growth 2025-2026(%) 20.0%
Key countries US, Canada, Mexico, China, Japan, India, South Korea, Australia, Indonesia, UK, Germany, France, Italy, Russia, Spain, UAE, Saudi Arabia, South Africa, Egypt, Nigeria, Brazil, Argentina and Colombia
Competitive landscape Leading Companies, Market Positioning of Companies, Competitive Strategies, and Industry Risks

Request Free Sample

Research Analyst Overview

  • The small satellite market is defined by a strategic shift from monolithic spacecraft to distributed constellations, primarily in low earth orbit (LEO), which leverage platforms like the minisatellite, microsatellite, and the standardized cubesat. This transition is enabled by the accessibility of commercial-off-the-shelf (COTS) parts and the availability of frequent rideshare launch mission opportunities.
  • Key applications driving this architecture are earth observation and global satellite communication, with remote sensing technology providing unprecedented geospatial data analytics. For boardroom decisions, the trend of in-orbit reconfigurability, made possible by software-defined radio (SDR) and electric propulsion system technology, is critical for maximizing long-term asset value and adapting to new market opportunities.
  • The adoption of COTS components has been shown to shorten satellite development timelines by up to 60%, a crucial metric for maintaining competitive agility. Payloads like synthetic aperture radar (SAR) and advanced phased array antenna systems are becoming more common on smaller satellite bus platform designs. However, operating in MEO and GEO presents challenges related to radiation-hardened components.
  • The entire ecosystem relies on a robust ground station network and effective space situational awareness (SSA) for management, with onboard AI processing emerging as a key differentiator.

What are the Key Data Covered in this Small Satellite Market Research and Growth Report?

  • What is the expected growth of the Small Satellite Market between 2026 and 2030?

    • USD 8.55 billion, at a CAGR of 21.3%

  • What segmentation does the market report cover?

    • The report is segmented by Application (Earth observation and remote sensing, Satellite communication, Navigation, and Others), Type (Minisatellite, Nanosatellite, and Microsatellite), Product Type (LEO, MEO, and GEO), End-user (Government and military, Commercial, Academic, and Others) and Geography (North America, APAC, Europe, Middle East and Africa, South America)

  • Which regions are analyzed in the report?

    • North America, APAC, Europe, Middle East and Africa and South America

  • What are the key growth drivers and market challenges?

    • Democratizing space access with rideshare launches, Navigating growing threat of space debris

  • Who are the major players in the Small Satellite Market?

    • AAC Clyde Space AB, Airbus SE, Capella Space Corp., China Aerospace S and T Corp., GomSpace Group AB, L3Harris Technologies Inc., Lockheed Martin Corp., Maxar Technologies Inc., MDA Corp., Mitsubishi Electric Corp., Northrop Grumman Corp., OHB SE, Planet Labs PBC, Rocket Lab USA Inc., Sierra Nevada Corp., Space Exploration Tech. Corp., Spire Global Inc., ST Engineering Ltd., Thales Alenia Space and The Boeing Co.

Market Research Insights

  • Market dynamics are shaped by the strategic shift toward proliferated LEO architecture, which enhances service resilience and coverage. This trend is supported by an expanding ecosystem of ground station as a service (GSaaS) providers, which reduces upfront capital expenditure for operators, with antenna time priced between $3 and $10 per minute.
  • The development of a responsive launch capability further accelerates constellation deployment. The adoption of dual-use satellite technology meets both commercial and government needs, while resilient PNT services are being developed to augment existing navigation systems.
  • Utilizing satellite data for insurance purposes can reduce claim assessment costs by 30% to 40%, demonstrating a clear return on investment and driving further adoption of space-based data solutions.

We can help! Our analysts can customize this small satellite market research report to meet your requirements.

Get in touch

1. Executive Summary

1.1 Market overview

Executive Summary - Chart on Market Overview
Executive Summary - Data Table on Market Overview
Executive Summary - Chart on Global Market Characteristics
Executive Summary - Chart on Market by Geography
Executive Summary - Chart on Market Segmentation by Application
Executive Summary - Chart on Market Segmentation by Type
Executive Summary - Chart on Market Segmentation by Product Type
Executive Summary - Chart on Market Segmentation by End-user
Executive Summary - Chart on Incremental Growth
Executive Summary - Data Table on Incremental Growth
Executive Summary - Chart on Company Market Positioning

2. Technavio Analysis

2.1 Analysis of price sensitivity, lifecycle, customer purchase basket, adoption rates, and purchase criteria

2.2 Criticality of inputs and Factors of differentiation

Chart on Overview on criticality of inputs and factors of differentiation

2.3 Factors of disruption

Chart on Overview on factors of disruption

2.4 Impact of drivers and challenges

Chart on Impact of drivers and challenges in 2025 and 2030

3. Market Landscape

3.1 Market ecosystem

Chart on Parent Market
Data Table on - Parent Market

3.2 Market characteristics

Chart on Market characteristics analysis

3.3 Value chain analysis

Chart on Value chain analysis

4. Market Sizing

4.1 Market definition

Data Table on Offerings of companies included in the market definition

4.2 Market segment analysis

Market segments

4.3 Market size 2025

4.4 Market outlook: Forecast for 2025-2030

Chart on Global - Market size and forecast 2025-2030 ($ million)
Data Table on Global - Market size and forecast 2025-2030 ($ million)
Chart on Global Market: Year-over-year growth 2025-2030 (%)
Data Table on Global Market: Year-over-year growth 2025-2030 (%)

5. Historic Market Size

5.1 Global Small Satellite Market 2020 - 2024

Historic Market Size - Data Table on Global Small Satellite Market 2020 - 2024 ($ million)

5.2 Application segment analysis 2020 - 2024

Historic Market Size - Application Segment 2020 - 2024 ($ million)

5.3 Type segment analysis 2020 - 2024

Historic Market Size - Type Segment 2020 - 2024 ($ million)

5.4 Product Type segment analysis 2020 - 2024

Historic Market Size - Product Type Segment 2020 - 2024 ($ million)

5.5 End-user segment analysis 2020 - 2024

Historic Market Size - End-user Segment 2020 - 2024 ($ million)

5.6 Geography segment analysis 2020 - 2024

Historic Market Size - Geography Segment 2020 - 2024 ($ million)

5.7 Country segment analysis 2020 - 2024

Historic Market Size - Country Segment 2020 - 2024 ($ million)

6. Qualitative Analysis

6.1 Impact of AI on global small satellite market

6.2 Impact of geopolitical conflicts on global small satellite market

7. Five Forces Analysis

7.1 Five forces summary

Five forces analysis - Comparison between 2025 and 2030

7.2 Bargaining power of buyers

Bargaining power of buyers - Impact of key factors 2025 and 2030

7.3 Bargaining power of suppliers

Bargaining power of suppliers - Impact of key factors in 2025 and 2030

7.4 Threat of new entrants

Threat of new entrants - Impact of key factors in 2025 and 2030

7.5 Threat of substitutes

Threat of substitutes - Impact of key factors in 2025 and 2030

7.6 Threat of rivalry

Threat of rivalry - Impact of key factors in 2025 and 2030

7.7 Market condition

Chart on Market condition - Five forces 2025 and 2030

8. Market Segmentation by Application

8.1 Market segments

Chart on Application - Market share 2025-2030 (%)
Data Table on Application - Market share 2025-2030 (%)

8.2 Comparison by Application

Chart on Comparison by Application
Data Table on Comparison by Application

8.3 Earth observation and remote sensing - Market size and forecast 2025-2030

Chart on Earth observation and remote sensing - Market size and forecast 2025-2030 ($ million)
Data Table on Earth observation and remote sensing - Market size and forecast 2025-2030 ($ million)
Chart on Earth observation and remote sensing - Year-over-year growth 2025-2030 (%)
Data Table on Earth observation and remote sensing - Year-over-year growth 2025-2030 (%)

8.4 Satellite communication - Market size and forecast 2025-2030

Chart on Satellite communication - Market size and forecast 2025-2030 ($ million)
Data Table on Satellite communication - Market size and forecast 2025-2030 ($ million)
Chart on Satellite communication - Year-over-year growth 2025-2030 (%)
Data Table on Satellite communication - Year-over-year growth 2025-2030 (%)

8.5 Navigation - Market size and forecast 2025-2030

Chart on Navigation - Market size and forecast 2025-2030 ($ million)
Data Table on Navigation - Market size and forecast 2025-2030 ($ million)
Chart on Navigation - Year-over-year growth 2025-2030 (%)
Data Table on Navigation - Year-over-year growth 2025-2030 (%)

8.6 Others - Market size and forecast 2025-2030

Chart on Others - Market size and forecast 2025-2030 ($ million)
Data Table on Others - Market size and forecast 2025-2030 ($ million)
Chart on Others - Year-over-year growth 2025-2030 (%)
Data Table on Others - Year-over-year growth 2025-2030 (%)

8.7 Market opportunity by Application

Market opportunity by Application ($ million)
Data Table on Market opportunity by Application ($ million)

9. Market Segmentation by Type

9.1 Market segments

Chart on Type - Market share 2025-2030 (%)
Data Table on Type - Market share 2025-2030 (%)

9.2 Comparison by Type

Chart on Comparison by Type
Data Table on Comparison by Type

9.3 Minisatellite - Market size and forecast 2025-2030

Chart on Minisatellite - Market size and forecast 2025-2030 ($ million)
Data Table on Minisatellite - Market size and forecast 2025-2030 ($ million)
Chart on Minisatellite - Year-over-year growth 2025-2030 (%)
Data Table on Minisatellite - Year-over-year growth 2025-2030 (%)

9.4 Nanosatellite - Market size and forecast 2025-2030

Chart on Nanosatellite - Market size and forecast 2025-2030 ($ million)
Data Table on Nanosatellite - Market size and forecast 2025-2030 ($ million)
Chart on Nanosatellite - Year-over-year growth 2025-2030 (%)
Data Table on Nanosatellite - Year-over-year growth 2025-2030 (%)

9.5 Microsatellite - Market size and forecast 2025-2030

Chart on Microsatellite - Market size and forecast 2025-2030 ($ million)
Data Table on Microsatellite - Market size and forecast 2025-2030 ($ million)
Chart on Microsatellite - Year-over-year growth 2025-2030 (%)
Data Table on Microsatellite - Year-over-year growth 2025-2030 (%)

9.6 Market opportunity by Type

Market opportunity by Type ($ million)
Data Table on Market opportunity by Type ($ million)

10. Market Segmentation by Product Type

10.1 Market segments

Chart on Product Type - Market share 2025-2030 (%)
Data Table on Product Type - Market share 2025-2030 (%)

10.2 Comparison by Product Type

Chart on Comparison by Product Type
Data Table on Comparison by Product Type

10.3 LEO - Market size and forecast 2025-2030

Chart on LEO - Market size and forecast 2025-2030 ($ million)
Data Table on LEO - Market size and forecast 2025-2030 ($ million)
Chart on LEO - Year-over-year growth 2025-2030 (%)
Data Table on LEO - Year-over-year growth 2025-2030 (%)

10.4 MEO - Market size and forecast 2025-2030

Chart on MEO - Market size and forecast 2025-2030 ($ million)
Data Table on MEO - Market size and forecast 2025-2030 ($ million)
Chart on MEO - Year-over-year growth 2025-2030 (%)
Data Table on MEO - Year-over-year growth 2025-2030 (%)

10.5 GEO - Market size and forecast 2025-2030

Chart on GEO - Market size and forecast 2025-2030 ($ million)
Data Table on GEO - Market size and forecast 2025-2030 ($ million)
Chart on GEO - Year-over-year growth 2025-2030 (%)
Data Table on GEO - Year-over-year growth 2025-2030 (%)

10.6 Market opportunity by Product Type

Market opportunity by Product Type ($ million)
Data Table on Market opportunity by Product Type ($ million)

11. Market Segmentation by End-user

11.1 Market segments

Chart on End-user - Market share 2025-2030 (%)
Data Table on End-user - Market share 2025-2030 (%)

11.2 Comparison by End-user

Chart on Comparison by End-user
Data Table on Comparison by End-user

11.3 Government and military - Market size and forecast 2025-2030

Chart on Government and military - Market size and forecast 2025-2030 ($ million)
Data Table on Government and military - Market size and forecast 2025-2030 ($ million)
Chart on Government and military - Year-over-year growth 2025-2030 (%)
Data Table on Government and military - Year-over-year growth 2025-2030 (%)

11.4 Commercial - Market size and forecast 2025-2030

Chart on Commercial - Market size and forecast 2025-2030 ($ million)
Data Table on Commercial - Market size and forecast 2025-2030 ($ million)
Chart on Commercial - Year-over-year growth 2025-2030 (%)
Data Table on Commercial - Year-over-year growth 2025-2030 (%)

11.5 Academic - Market size and forecast 2025-2030

Chart on Academic - Market size and forecast 2025-2030 ($ million)
Data Table on Academic - Market size and forecast 2025-2030 ($ million)
Chart on Academic - Year-over-year growth 2025-2030 (%)
Data Table on Academic - Year-over-year growth 2025-2030 (%)

11.6 Others - Market size and forecast 2025-2030

Chart on Others - Market size and forecast 2025-2030 ($ million)
Data Table on Others - Market size and forecast 2025-2030 ($ million)
Chart on Others - Year-over-year growth 2025-2030 (%)
Data Table on Others - Year-over-year growth 2025-2030 (%)

11.7 Market opportunity by End-user

Market opportunity by End-user ($ million)
Data Table on Market opportunity by End-user ($ million)

12. Customer Landscape

12.1 Customer landscape overview

Analysis of price sensitivity, lifecycle, customer purchase basket, adoption rates, and purchase criteria

13. Geographic Landscape

13.1 Geographic segmentation

Chart on Market share by geography 2025-2030 (%)
Data Table on Market share by geography 2025-2030 (%)

13.2 Geographic comparison

Chart on Geographic comparison
Data Table on Geographic comparison

13.3 North America - Market size and forecast 2025-2030

Chart on North America - Market size and forecast 2025-2030 ($ million)
Data Table on North America - Market size and forecast 2025-2030 ($ million)
Chart on North America - Year-over-year growth 2025-2030 (%)
Data Table on North America - Year-over-year growth 2025-2030 (%)
Chart on Regional Comparison - North America
Data Table on Regional Comparison - North America

13.3.1 US - Market size and forecast 2025-2030

Chart on US - Market size and forecast 2025-2030 ($ million)
Data Table on US - Market size and forecast 2025-2030 ($ million)
Chart on US - Year-over-year growth 2025-2030 (%)
Data Table on US - Year-over-year growth 2025-2030 (%)

13.3.2 Canada - Market size and forecast 2025-2030

Chart on Canada - Market size and forecast 2025-2030 ($ million)
Data Table on Canada - Market size and forecast 2025-2030 ($ million)
Chart on Canada - Year-over-year growth 2025-2030 (%)
Data Table on Canada - Year-over-year growth 2025-2030 (%)

13.3.3 Mexico - Market size and forecast 2025-2030

Chart on Mexico - Market size and forecast 2025-2030 ($ million)
Data Table on Mexico - Market size and forecast 2025-2030 ($ million)
Chart on Mexico - Year-over-year growth 2025-2030 (%)
Data Table on Mexico - Year-over-year growth 2025-2030 (%)

13.4 APAC - Market size and forecast 2025-2030

Chart on APAC - Market size and forecast 2025-2030 ($ million)
Data Table on APAC - Market size and forecast 2025-2030 ($ million)
Chart on APAC - Year-over-year growth 2025-2030 (%)
Data Table on APAC - Year-over-year growth 2025-2030 (%)
Chart on Regional Comparison - APAC
Data Table on Regional Comparison - APAC

13.4.1 China - Market size and forecast 2025-2030

Chart on China - Market size and forecast 2025-2030 ($ million)
Data Table on China - Market size and forecast 2025-2030 ($ million)
Chart on China - Year-over-year growth 2025-2030 (%)
Data Table on China - Year-over-year growth 2025-2030 (%)

13.4.2 Japan - Market size and forecast 2025-2030

Chart on Japan - Market size and forecast 2025-2030 ($ million)
Data Table on Japan - Market size and forecast 2025-2030 ($ million)
Chart on Japan - Year-over-year growth 2025-2030 (%)
Data Table on Japan - Year-over-year growth 2025-2030 (%)

13.4.3 India - Market size and forecast 2025-2030

Chart on India - Market size and forecast 2025-2030 ($ million)
Data Table on India - Market size and forecast 2025-2030 ($ million)
Chart on India - Year-over-year growth 2025-2030 (%)
Data Table on India - Year-over-year growth 2025-2030 (%)

13.4.4 South Korea - Market size and forecast 2025-2030

Chart on South Korea - Market size and forecast 2025-2030 ($ million)
Data Table on South Korea - Market size and forecast 2025-2030 ($ million)
Chart on South Korea - Year-over-year growth 2025-2030 (%)
Data Table on South Korea - Year-over-year growth 2025-2030 (%)

13.4.5 Australia - Market size and forecast 2025-2030

Chart on Australia - Market size and forecast 2025-2030 ($ million)
Data Table on Australia - Market size and forecast 2025-2030 ($ million)
Chart on Australia - Year-over-year growth 2025-2030 (%)
Data Table on Australia - Year-over-year growth 2025-2030 (%)

13.4.6 Indonesia - Market size and forecast 2025-2030

Chart on Indonesia - Market size and forecast 2025-2030 ($ million)
Data Table on Indonesia - Market size and forecast 2025-2030 ($ million)
Chart on Indonesia - Year-over-year growth 2025-2030 (%)
Data Table on Indonesia - Year-over-year growth 2025-2030 (%)

13.5 Europe - Market size and forecast 2025-2030

Chart on Europe - Market size and forecast 2025-2030 ($ million)
Data Table on Europe - Market size and forecast 2025-2030 ($ million)
Chart on Europe - Year-over-year growth 2025-2030 (%)
Data Table on Europe - Year-over-year growth 2025-2030 (%)
Chart on Regional Comparison - Europe
Data Table on Regional Comparison - Europe

13.5.1 UK - Market size and forecast 2025-2030

Chart on UK - Market size and forecast 2025-2030 ($ million)
Data Table on UK - Market size and forecast 2025-2030 ($ million)
Chart on UK - Year-over-year growth 2025-2030 (%)
Data Table on UK - Year-over-year growth 2025-2030 (%)

13.5.2 Germany - Market size and forecast 2025-2030

Chart on Germany - Market size and forecast 2025-2030 ($ million)
Data Table on Germany - Market size and forecast 2025-2030 ($ million)
Chart on Germany - Year-over-year growth 2025-2030 (%)
Data Table on Germany - Year-over-year growth 2025-2030 (%)

13.5.3 France - Market size and forecast 2025-2030

Chart on France - Market size and forecast 2025-2030 ($ million)
Data Table on France - Market size and forecast 2025-2030 ($ million)
Chart on France - Year-over-year growth 2025-2030 (%)
Data Table on France - Year-over-year growth 2025-2030 (%)

13.5.4 Italy - Market size and forecast 2025-2030

Chart on Italy - Market size and forecast 2025-2030 ($ million)
Data Table on Italy - Market size and forecast 2025-2030 ($ million)
Chart on Italy - Year-over-year growth 2025-2030 (%)
Data Table on Italy - Year-over-year growth 2025-2030 (%)

13.5.5 Russia - Market size and forecast 2025-2030

Chart on Russia - Market size and forecast 2025-2030 ($ million)
Data Table on Russia - Market size and forecast 2025-2030 ($ million)
Chart on Russia - Year-over-year growth 2025-2030 (%)
Data Table on Russia - Year-over-year growth 2025-2030 (%)

13.5.6 Spain - Market size and forecast 2025-2030

Chart on Spain - Market size and forecast 2025-2030 ($ million)
Data Table on Spain - Market size and forecast 2025-2030 ($ million)
Chart on Spain - Year-over-year growth 2025-2030 (%)
Data Table on Spain - Year-over-year growth 2025-2030 (%)

13.6 Middle East and Africa - Market size and forecast 2025-2030

Chart on Middle East and Africa - Market size and forecast 2025-2030 ($ million)
Data Table on Middle East and Africa - Market size and forecast 2025-2030 ($ million)
Chart on Middle East and Africa - Year-over-year growth 2025-2030 (%)
Data Table on Middle East and Africa - Year-over-year growth 2025-2030 (%)
Chart on Regional Comparison - Middle East and Africa
Data Table on Regional Comparison - Middle East and Africa

13.6.1 UAE - Market size and forecast 2025-2030

Chart on UAE - Market size and forecast 2025-2030 ($ million)
Data Table on UAE - Market size and forecast 2025-2030 ($ million)
Chart on UAE - Year-over-year growth 2025-2030 (%)
Data Table on UAE - Year-over-year growth 2025-2030 (%)

13.6.2 Saudi Arabia - Market size and forecast 2025-2030

Chart on Saudi Arabia - Market size and forecast 2025-2030 ($ million)
Data Table on Saudi Arabia - Market size and forecast 2025-2030 ($ million)
Chart on Saudi Arabia - Year-over-year growth 2025-2030 (%)
Data Table on Saudi Arabia - Year-over-year growth 2025-2030 (%)

13.6.3 South Africa - Market size and forecast 2025-2030

Chart on South Africa - Market size and forecast 2025-2030 ($ million)
Data Table on South Africa - Market size and forecast 2025-2030 ($ million)
Chart on South Africa - Year-over-year growth 2025-2030 (%)
Data Table on South Africa - Year-over-year growth 2025-2030 (%)

13.6.4 Egypt - Market size and forecast 2025-2030

Chart on Egypt - Market size and forecast 2025-2030 ($ million)
Data Table on Egypt - Market size and forecast 2025-2030 ($ million)
Chart on Egypt - Year-over-year growth 2025-2030 (%)
Data Table on Egypt - Year-over-year growth 2025-2030 (%)

13.6.5 Nigeria - Market size and forecast 2025-2030

Chart on Nigeria - Market size and forecast 2025-2030 ($ million)
Data Table on Nigeria - Market size and forecast 2025-2030 ($ million)
Chart on Nigeria - Year-over-year growth 2025-2030 (%)
Data Table on Nigeria - Year-over-year growth 2025-2030 (%)

13.7 South America - Market size and forecast 2025-2030

Chart on South America - Market size and forecast 2025-2030 ($ million)
Data Table on South America - Market size and forecast 2025-2030 ($ million)
Chart on South America - Year-over-year growth 2025-2030 (%)
Data Table on South America - Year-over-year growth 2025-2030 (%)
Chart on Regional Comparison - South America
Data Table on Regional Comparison - South America

13.7.1 Brazil - Market size and forecast 2025-2030

Chart on Brazil - Market size and forecast 2025-2030 ($ million)
Data Table on Brazil - Market size and forecast 2025-2030 ($ million)
Chart on Brazil - Year-over-year growth 2025-2030 (%)
Data Table on Brazil - Year-over-year growth 2025-2030 (%)

13.7.2 Argentina - Market size and forecast 2025-2030

Chart on Argentina - Market size and forecast 2025-2030 ($ million)
Data Table on Argentina - Market size and forecast 2025-2030 ($ million)
Chart on Argentina - Year-over-year growth 2025-2030 (%)
Data Table on Argentina - Year-over-year growth 2025-2030 (%)

13.7.3 Colombia - Market size and forecast 2025-2030

Chart on Colombia - Market size and forecast 2025-2030 ($ million)
Data Table on Colombia - Market size and forecast 2025-2030 ($ million)
Chart on Colombia - Year-over-year growth 2025-2030 (%)
Data Table on Colombia - Year-over-year growth 2025-2030 (%)

13.8 Market opportunity by geography

Market opportunity by geography ($ million)
Data Tables on Market opportunity by geography ($ million)

14. Drivers, Challenges, and Opportunity

14.1 Market drivers

Democratizing space access with rideshare launches
Boosting satellite capabilities with miniaturized electronics
Fueling constellation growth through surging data demand

14.2 Market challenges

Navigating growing threat of space debris
Overcoming radio frequency spectrum congestion
Managing prohibitive ground segment costs

14.3 Impact of drivers and challenges

Impact of drivers and challenges in 2025 and 2030

14.4 Market opportunities

Integrating onboard AI for autonomous operations
Networking constellations with laser communication
Reprogramming satellites for mission flexibility

15. Competitive Landscape

15.1 Overview

15.2

Overview on criticality of inputs and factors of differentiation

15.3 Landscape disruption

Overview on factors of disruption

15.4 Industry risks

Impact of key risks on business

16. Competitive Analysis

16.1 Companies profiled

Companies covered

16.2 Company ranking index

16.3 Market positioning of companies

Matrix on companies position and classification

16.4 AAC Clyde Space AB

AAC Clyde Space AB - Overview
AAC Clyde Space AB - Business segments
AAC Clyde Space AB - Key offerings
AAC Clyde Space AB - Segment focus
SWOT

16.5 Airbus SE

Airbus SE - Overview
Airbus SE - Business segments
Airbus SE - Key news
Airbus SE - Key offerings
Airbus SE - Segment focus
SWOT

16.6 Capella Space Corp.

Capella Space Corp. - Overview
Capella Space Corp. - Product / Service
Capella Space Corp. - Key offerings
SWOT

16.7 GomSpace Group AB

GomSpace Group AB - Overview
GomSpace Group AB - Product / Service
GomSpace Group AB - Key offerings
SWOT

16.8 L3Harris Technologies Inc.

L3Harris Technologies Inc. - Overview
L3Harris Technologies Inc. - Business segments
L3Harris Technologies Inc. - Key news
L3Harris Technologies Inc. - Key offerings
L3Harris Technologies Inc. - Segment focus
SWOT

16.9 Lockheed Martin Corp.

Lockheed Martin Corp. - Overview
Lockheed Martin Corp. - Business segments
Lockheed Martin Corp. - Key news
Lockheed Martin Corp. - Key offerings
Lockheed Martin Corp. - Segment focus
SWOT

16.10 MDA Corp.

MDA Corp. - Overview
MDA Corp. - Business segments
MDA Corp. - Key offerings
MDA Corp. - Segment focus
SWOT

16.11 Mitsubishi Electric Corp.

Mitsubishi Electric Corp. - Overview
Mitsubishi Electric Corp. - Business segments
Mitsubishi Electric Corp. - Key offerings
Mitsubishi Electric Corp. - Segment focus
SWOT

16.12 Northrop Grumman Corp.

Northrop Grumman Corp. - Overview
Northrop Grumman Corp. - Business segments
Northrop Grumman Corp. - Key news
Northrop Grumman Corp. - Key offerings
Northrop Grumman Corp. - Segment focus
SWOT

16.13 Planet Labs PBC

Planet Labs PBC - Overview
Planet Labs PBC - Product / Service
Planet Labs PBC - Key offerings
SWOT

16.14 Sierra Nevada Corp.

Sierra Nevada Corp. - Overview
Sierra Nevada Corp. - Product / Service
Sierra Nevada Corp. - Key offerings
SWOT

16.15 Space Exploration Tech. Corp.

Space Exploration Tech. Corp. - Overview
Space Exploration Tech. Corp. - Product / Service
Space Exploration Tech. Corp. - Key offerings
SWOT

16.16 Spire Global Inc.

Spire Global Inc. - Overview
Spire Global Inc. - Product / Service
Spire Global Inc. - Key offerings
SWOT

16.17 ST Engineering Ltd.

ST Engineering Ltd. - Overview
ST Engineering Ltd. - Business segments
ST Engineering Ltd. - Key news
ST Engineering Ltd. - Key offerings
ST Engineering Ltd. - Segment focus
SWOT

16.18 The Boeing Co.

The Boeing Co. - Overview
The Boeing Co. - Business segments
The Boeing Co. - Key news
The Boeing Co. - Key offerings
The Boeing Co. - Segment focus
SWOT

17. Appendix

17.1 Scope of the report

Market definition
Objectives
Notes and caveats

17.2 Inclusions and exclusions checklist

Inclusions checklist
Exclusions checklist

17.3 Currency conversion rates for US$

17.4 Research methodology

17.5 Data procurement

Information sources

17.6 Data validation

17.7 Validation techniques employed for market sizing

17.8 Data synthesis

17.9 360 degree market analysis

17.10 List of abbreviations

Research Methodology

Technavio presents a detailed picture of the market by way of study, synthesis, and summation of data from multiple sources. The analysts have presented the various facets of the market with a particular focus on identifying the key industry influencers. The data thus presented is comprehensive, reliable, and the result of extensive research, both primary and secondary.

INFORMATION SOURCES

Primary sources

  • Manufacturers and suppliers
  • Channel partners
  • Industry experts
  • Strategic decision makers

Secondary sources

  • Industry journals and periodicals
  • Government data
  • Financial reports of key industry players
  • Historical data
  • Press releases

DATA ANALYSIS

Data Synthesis

  • Collation of data
  • Estimation of key figures
  • Analysis of derived insights

Data Validation

  • Triangulation with data models
  • Reference against proprietary databases
  • Corroboration with industry experts

REPORT WRITING

Qualitative

  • Market drivers
  • Market challenges
  • Market trends
  • Five forces analysis

Quantitative

  • Market size and forecast
  • Market segmentation
  • Geographical insights
  • Competitive landscape

Interested in this report?

Get your sample now to see our research methodology and insights!

Download Now

Frequently Asked Questions

Small Satellite market growth will increase by USD 8549.1 million during 2026-2030.

The Small Satellite market is expected to grow at a CAGR of 21.3% during 2026-2030.

Small Satellite market is segmented by Application (Earth observation and remote sensing, Satellite communication, Navigation, Others) Type (Minisatellite, Nanosatellite, Microsatellite) Product type (LEO, MEO, GEO) End-user (Government and military, Commercial, Academic, Others)

AAC Clyde Space AB, Airbus SE, Capella Space Corp., China Aerospace S and T Corp., GomSpace Group AB, L3Harris Technologies Inc., Lockheed Martin Corp., Maxar Technologies Inc., MDA Corp., Mitsubishi Electric Corp., Northrop Grumman Corp., OHB SE, Planet Labs PBC, Rocket Lab USA Inc., Sierra Nevada Corp., Space Exploration Tech. Corp., Spire Global Inc., ST Engineering Ltd., Thales Alenia Space, The Boeing Co. are a few of the key vendors in the Small Satellite market.

North America will register the highest growth rate of 34.7% among the other regions. Therefore, the Small Satellite market in North America is expected to garner significant business opportunities for the vendors during the forecast period.

US, Canada, Mexico, China, Japan, India, South Korea, Australia, Indonesia, UK, Germany, France, Italy, Russia, Spain, UAE, Saudi Arabia, South Africa, Egypt, Nigeria, Brazil, Argentina, Colombia

  • Democratizing space access with rideshare launches is the driving factor this market.

The Small Satellite market vendors should focus on grabbing business opportunities from the Application segment as it accounted for the largest market share in the base year.