Satellite-Based Earth Observation Market Analysis, Size, and Forecast 2025-2029: North America (US and Canada), Europe (Germany, Russia, and UK), Middle East and Africa (UAE), APAC (China, Japan, and South Korea), South America (Brazil), and Rest of World (ROW)

Satellite-Based Earth Observation Market Analysis, Size, and Forecast 2025-2029:
North America (US and Canada), Europe (Germany, Russia, and UK), Middle East and Africa (UAE), APAC (China, Japan, and South Korea), South America (Brazil), and Rest of World (ROW)

Published: Dec 2024 210 Pages SKU: IRTNTR40651

Market Overview at a Glance

$9.66 B
Market Opportunity
12%
CAGR
10.4
YoY growth 2024-2025(%)

Satellite-Based Earth Observation Market Size 2025-2029

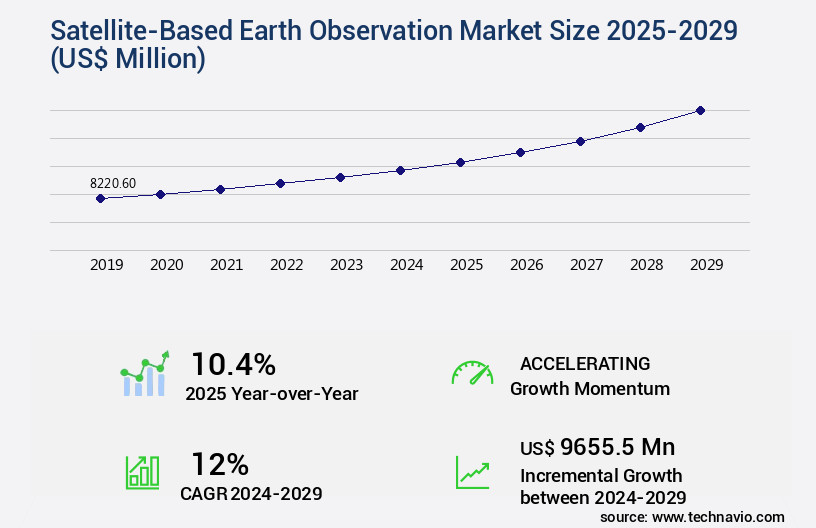
The satellite-based earth observation market size is valued to increase USD 9.66 billion, at a CAGR of 12% from 2024 to 2029. Use of satellites for advanced environment monitoring will drive the satellite-based earth observation market.

Major Market Trends & Insights

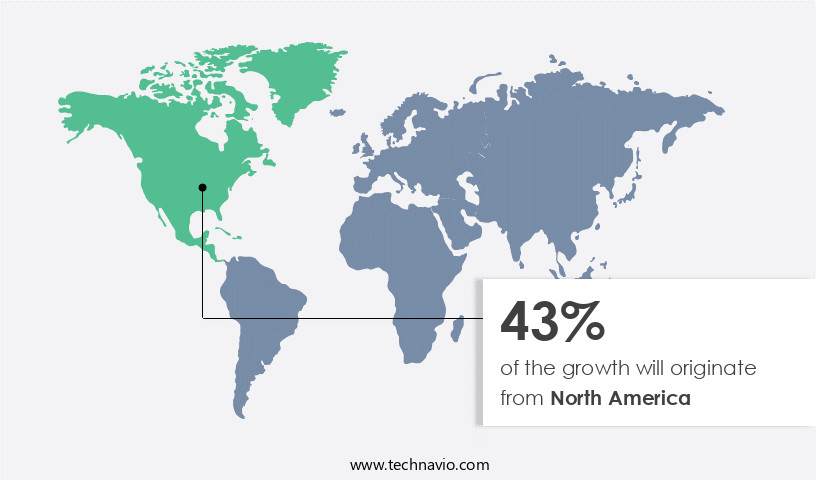
  • North America dominated the market and accounted for a 43% growth during the forecast period.
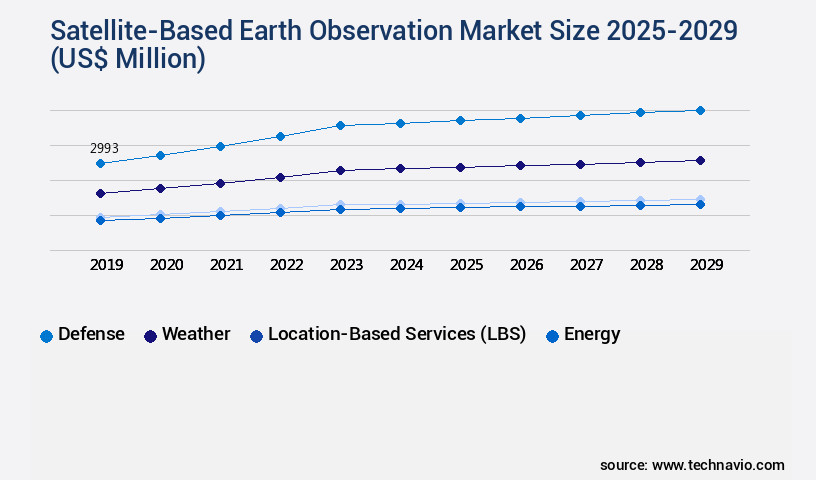
  • By Application - Defense segment was valued at USD 2.99 billion in 2023
  • By Type - Value-Added Services (VAS) segment accounted for the largest market revenue share in 2023

Market Size & Forecast

  • Market Opportunities: USD 171.22 million
  • Market Future Opportunities: USD 9655.50 million
  • CAGR from 2024 to 2029 : 12%

Market Summary

  • The market is experiencing significant expansion, driven by the increasing demand for real-time, high-resolution data to address environmental and socio-economic challenges. Small satellites, with their cost-effective production and deployment, are gaining popularity, contributing to the market's expansion. These agile spacecraft offer enhanced flexibility and customization, catering to various applications, from agriculture and forestry to disaster management and urban planning. However, competition from alternate technologies, such as drones and airborne sensors, poses challenges to the market's growth.
  • Satellite-based solutions, while offering extensive coverage and longer data collection periods, face limitations in terms of spatial and temporal resolution. To maintain their competitive edge, market players are investing in technological advancements, including hyperspectral and multispectral imaging, machine learning algorithms, and real-time data processing capabilities. The future of the market lies in the integration of these technologies to deliver actionable insights, enabling informed decision-making for businesses and governments alike.

What will be the Size of the Satellite-Based Earth Observation Market during the forecast period?

Satellite-Based Earth Observation Market Size

Get Key Insights on Market Forecast (PDF) Request Free Sample

How is the Satellite-Based Earth Observation Market Segmented ?

The satellite-based earth observation industry research report provides comprehensive data (region-wise segment analysis), with forecasts and estimates in "USD million" for the period 2025-2029, as well as historical data from 2019-2023 for the following segments.

  • Application
    • Defense
    • Weather
    • Location-Based Services (LBS)
    • Energy
    • Others
  • Type
    • Value-Added Services (VAS)
    • Data
  • Technology
    • Synthetic aperture radar (SAR)
    • Optical
  • End-User
    • Government
    • Commercial
    • Academic/Research
  • Geography
    • North America
      • US
      • Canada
    • Europe
      • Germany
      • Russia
      • UK
    • Middle East and Africa
      • UAE
    • APAC
      • China
      • Japan
      • South Korea
    • South America
      • Brazil
    • Rest of World (ROW)

By Application Insights

The defense segment is estimated to witness significant growth during the forecast period.

The market continues to evolve, with radar satellite data playing a pivotal role in applications such as crop yield prediction, land cover mapping, and infrastructure monitoring. Radiometric calibration, image classification algorithms, and geometric correction are essential techniques for enhancing the accuracy of remote sensing imagery and Lidar data acquisition. Change detection techniques and spectral signature analysis facilitate natural resource assessment, environmental monitoring systems, and climate change modeling. In 2024, the defense segment accounted for a substantial share of the market, with ongoing investment in satellite technologies for surveillance, regional security, and intelligence gathering by countries like China, India, and Russia.

For instance, Airbus secured agreements with the Czech Republic and the Netherlands to deliver satellite communications for their armed forces, marking a significant contribution to the UHF military communications hosted payload on board the EUTELSAT 36D telecommunications satellite. Geospatial data analytics, image registration techniques, cloud computing platforms, and satellite data processing are integral components of this dynamic industry, enabling precision agriculture applications, disaster response management, pollution detection methods, urban planning initiatives, and multispectral imagery analysis.

Satellite-Based Earth Observation Market Size

Request Free Sample

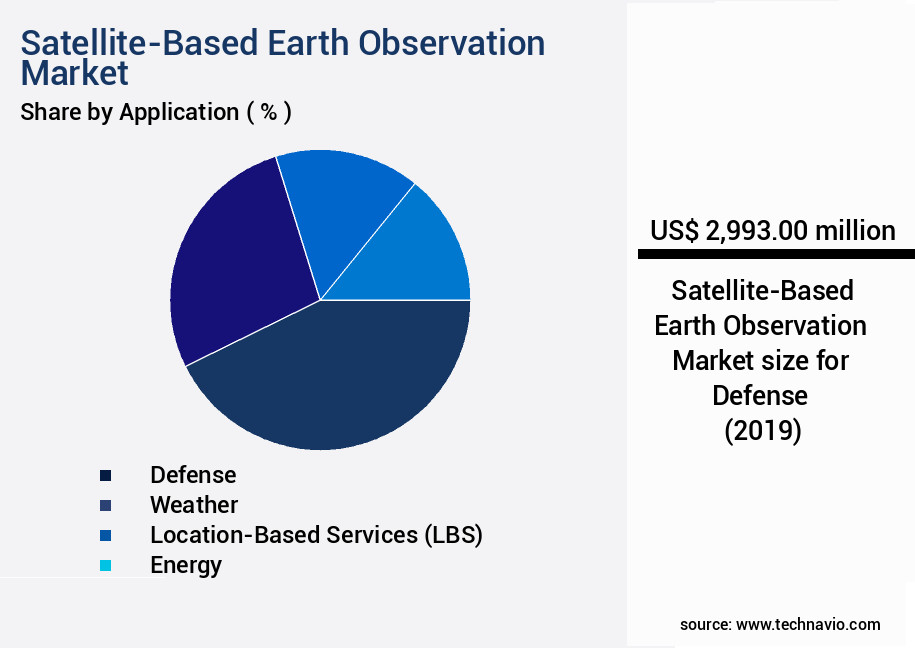
The Defense segment was valued at USD 2.99 billion in 2019 and showed a gradual increase during the forecast period.

Satellite-Based Earth Observation Market Size

Request Free Sample

Regional Analysis

North America is estimated to contribute 43% to the growth of the global market during the forecast period.Technavio’s analysts have elaborately explained the regional trends and drivers that shape the market during the forecast period.

Satellite-Based Earth Observation Market Share by Geography

See How Satellite-Based Earth Observation Market Demand is Rising in North America Request Free Sample

The satellite-based Earth observation (EO) market is a significant and evolving sector, with the United States leading the global landscape. Approximately one-third of all satellites in orbit are operated by US entities, primarily for applications in communications, surveillance and intelligence, national security, weather, disaster management, environmental observation, and navigation. The US has been a pioneer in satellite-based EO since its inception, with NASA spearheading most missions. Recently, a growing number of private players have entered the US market, focusing on providing satellite imagery-based analytics and Value-Added Services (VAS).

This influx of private entities is expanding the market's scope, with some even launching their own small satellites for data collection. The US satellite-based EO sector's diverse applications and continuous innovation underscore its robust presence in the global arena.

Market Dynamics

Our researchers analyzed the data with 2024 as the base year, along with the key drivers, trends, and challenges. A holistic analysis of drivers will help companies refine their marketing strategies to gain a competitive advantage.

The market is a dynamic and innovative industry that leverages advanced technologies to provide valuable insights and data for various sectors. This market encompasses a range of applications, from satellite imagery for precision agriculture and hyperspectral data for vegetation monitoring, to lidar point cloud processing for urban planning and remote sensing applications in disaster management. Geospatial data analytics for environmental monitoring is another significant area of growth, with multispectral imagery classification for land cover mapping and radar satellite data for deforestation detection playing crucial roles. In the realm of agriculture, satellite imagery offers farmers unprecedented insights into crop health and growth patterns, enabling more efficient use of resources and increased yields.

Meanwhile, hyperspectral data allows for a deeper understanding of vegetation conditions, helping to optimize nutrient management and improve overall productivity. Urban planning benefits from lidar point cloud processing, which generates highly detailed 3D models of urban landscapes, aiding in infrastructure development and city planning. Remote sensing is also essential in disaster management, providing critical information for emergency response and damage assessment. Environmental monitoring is another key application, with geospatial data analytics playing a pivotal role in tracking climate change and monitoring natural resources. Time series analysis of satellite data offers valuable insights into trends and patterns, while image fusion and object-based image analysis contribute to improved land use analysis and infrastructure monitoring.

The adoption of satellite-based earth observation technologies is gaining momentum, with more than 70% of new product developments focusing on emerging markets. This growth is driven by increasing demand for accurate and timely data, as well as advancements in satellite technology and data processing capabilities. In conclusion, the market is a vibrant and evolving industry, offering a wealth of opportunities for businesses and organizations seeking to gain a competitive edge through data-driven insights and decision-making. From agriculture and urban planning to disaster management and environmental monitoring, the potential applications are vast and diverse, making this an exciting and dynamic sector to watch.

Satellite-Based Earth Observation Market Size

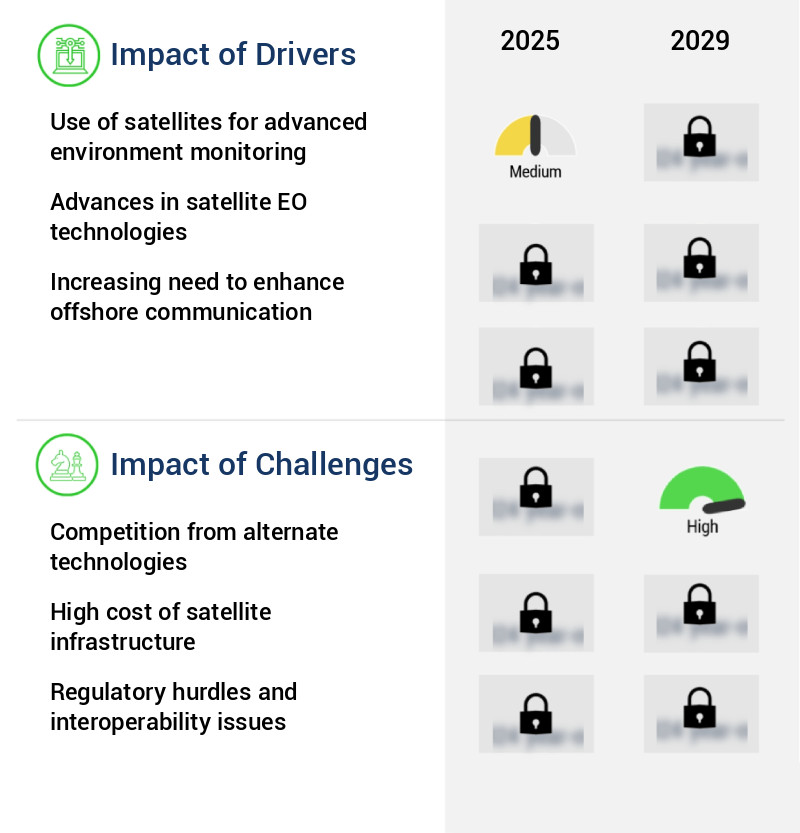
What are the key market drivers leading to the rise in the adoption of Satellite-Based Earth Observation Industry?

  • The utilization of satellites plays a crucial role in driving the market forward, particularly in the realm of advanced environment monitoring. 
  • Satellites have become indispensable tools for environmental monitoring due to their unique capability to observe the macroscopic environment and detect hidden features and short-term and long-term weather events that are not discernible through ground-based observation. These satellites provide real-time, continuous data on atmospheric conditions, enabling accurate weather forecasting. The importance of satellites in advanced environmental monitoring is increasingly recognized, with applications ranging from greenhouse gas emissions and changes in polar ice to deforestation, wildfires, and coral bleaching. Technological advancements in sensing and imaging technologies over the past decade have led to the development of superior observation satellites, offering higher-resolution images and the measurement of a multitude of metrics.
  • This data is vital for various sectors, including agriculture, meteorology, and climate science, to make informed decisions and mitigate potential risks.

What are the market trends shaping the Satellite-Based Earth Observation Industry?

  • The increasing demand for small satellites represents a significant market trend in the aerospace industry. Small satellites are experiencing growing demand within the aerospace market.
  • The small satellite market has experienced a substantial growth trajectory over the last decade. Small satellites, or SmallSats and CubeSats, range from shoebox to washing machine sizes and weigh as little as 10 kilograms. Their diminutive stature is matched by their affordability and minimal capital investment, making them increasingly popular. The scientific community and Earth observation sectors have shown significant interest in SmallSats due to their cost-effective nature, enabling a higher number of satellites in constellations.
  • This trend is not confined to a single sector, as various industries explore the potential of these agile and cost-effective space assets. The increasing demand for remote sensing, communication, and scientific research applications further underscores the market's dynamism and potential for continuous expansion.

What challenges does the Satellite-Based Earth Observation Industry face during its growth?

  • The expansion of the industry is significantly influenced by the intense competition posed by emerging technologies, serving as a major challenge that must be addressed by market participants. 
  • The market faces escalating competition from emerging observational technologies, including unmanned aerial vehicles (UAVs), drones, and stratospheric balloons (stratolites). Stratospheric balloons offer a cost-effective alternative to satellite-based solutions, as they can carry telescopes and sensors weighing from a few kilograms to over a ton to altitudes of up to 40,000 meters. This enables service providers and researchers to gather atmospheric and geological data with less expense than satellites. Furthermore, stratospheric balloons are advantageous for satellite data validation due to reduced interference compared to satellites.
  • Notable industry players like Google and World View Enterprises are investing heavily in high-altitude balloon technology, posing a growing threat to satellite-based Earth observation. This trend is expected to intensify as more service providers adopt balloons for weather forecasting and meteorological data acquisition.

Exclusive Technavio Analysis on Customer Landscape

The satellite-based earth observation market forecasting report includes the adoption lifecycle of the market, covering from the innovator’s stage to the laggard’s stage. It focuses on adoption rates in different regions based on penetration. Furthermore, the satellite-based earth observation market report also includes key purchase criteria and drivers of price sensitivity to help companies evaluate and develop their market growth analysis strategies.

Satellite-Based Earth Observation Market Share by Geography

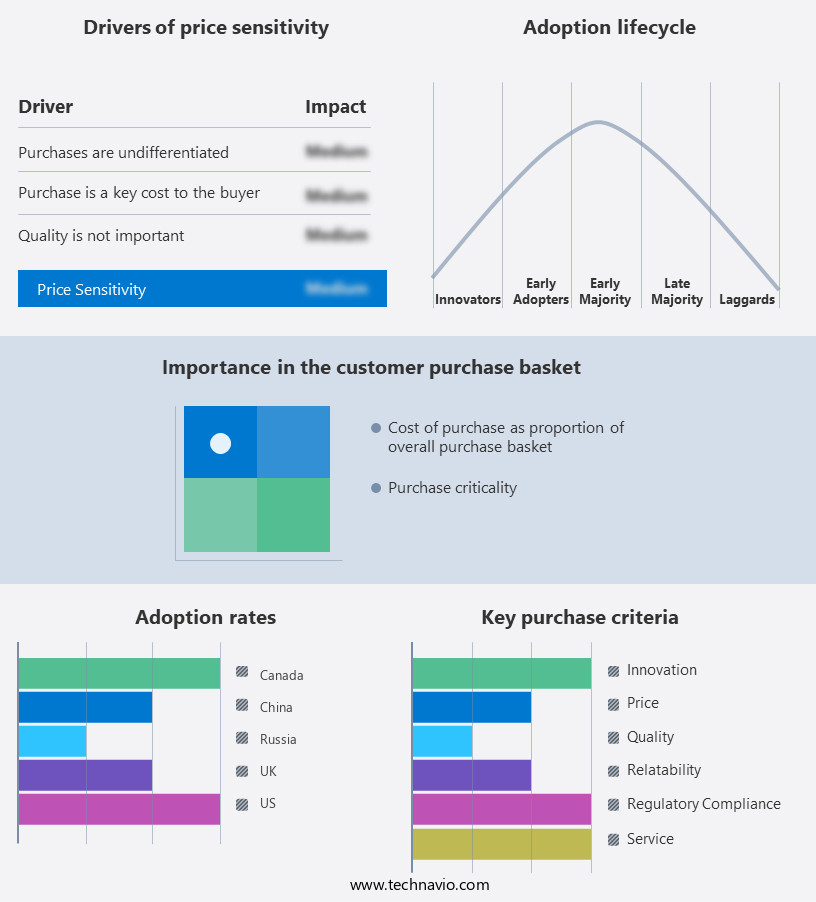
 Customer Landscape of Satellite-Based Earth Observation Industry

Competitive Landscape

Companies are implementing various strategies, such as strategic alliances, satellite-based earth observation market forecast, partnerships, mergers and acquisitions, geographical expansion, and product/service launches, to enhance their presence in the industry.

Airbus SE - This company specializes in satellite-based Earth observation services, featuring OPAZ, an electro-optical sensor delivering real-time high-resolution imagery and video (18cm). The infra-red capability enables night and day operations, offering valuable insights for various industries.

The industry research and growth report includes detailed analyses of the competitive landscape of the market and information about key companies, including:

  • Airbus SE
  • Antrix Corp. Ltd.
  • BAE Systems Plc
  • Eagle View Technologies Inc.
  • EarthDaily Analytics
  • Geoimage
  • Global Surface Intelligence Ltd.
  • Imagesat International I.S.I Ltd.
  • Kleos Space S.A
  • L3Harris Technologies Inc.
  • Lockheed Martin Corp.
  • Maxar Technologies Inc.
  • Northrop Grumman Corp.
  • OHB SE
  • Orbital Insight Inc.
  • Orbital Micro Systems
  • Planet Labs PBC
  • PlanetiQ
  • RTX Corp.
  • Thales Group

Qualitative and quantitative analysis of companies has been conducted to help clients understand the wider business environment as well as the strengths and weaknesses of key industry players. Data is qualitatively analyzed to categorize companies as pure play, category-focused, industry-focused, and diversified; it is quantitatively analyzed to categorize companies as dominant, leading, strong, tentative, and weak.

Recent Development and News in Satellite-Based Earth Observation Market

  • In January 2024, Airbus Defence and Space announced the successful launch of the Pléiades Neo high-resolution Earth observation satellite, marking a significant technological advancement in the market. The satellite, which is part of the European Space Agency's (ESA) Earth Observation Program, offers improved resolution and agility, enhancing the ability to monitor environmental changes and support disaster management efforts (Airbus Defence and Space press release, 2024).
  • In March 2024, Planet Labs and Maxar Technologies announced a strategic partnership to expand their Earth observation capabilities. The collaboration combines Planet Labs' daily global coverage and agile constellation with Maxar's high-resolution imagery and geospatial analytics, creating a comprehensive Earth observation solution for various industries, including agriculture, forestry, and disaster response (Planet Labs press release, 2024).
  • In May 2024, DigitalGlobe, a Maxar Technologies company, secured a contract worth USD150 million from the National Geospatial-Intelligence Agency (NGA) to provide high-resolution satellite imagery and geospatial data services. This contract extension further solidified DigitalGlobe's position as a key provider of Earth observation solutions to the U.S. Government (Maxar Technologies press release, 2024).
  • In April 2025, BlackSky, a leading provider of real-time satellite imagery and geospatial intelligence, announced the successful deployment of its Global-scale Constellation, consisting of 60 small satellites. This expansion significantly increased the company's revisit rate, enabling near-real-time monitoring and analysis of global events (BlackSky press release, 2025).

Dive into Technavio’s robust research methodology, blending expert interviews, extensive data synthesis, and validated models for unparalleled Satellite-Based Earth Observation Market insights. See full methodology.

Market Scope

Report Coverage

Details

Page number

210

Base year

2024

Historic period

2019-2023

Forecast period

2025-2029

Growth momentum & CAGR

Accelerate at a CAGR of 12%

Market growth 2025-2029

USD 9655.5 million

Market structure

Fragmented

YoY growth 2024-2025(%)

10.4

Key countries

US, Russia, China, Japan, UK, South Korea, Canada, Germany, Brazil, Saudi Arabia, and UAE

Competitive landscape

Leading Companies, Market Positioning of Companies, Competitive Strategies, and Industry Risks

Request Free Sample

Research Analyst Overview

  • Amidst the rapidly advancing technological landscape, the market continues to evolve, revolutionizing industries and addressing critical societal needs. Earth observation sensors, such as radar and multispectral, harness the power of remote sensing imagery to deliver insights that were once unattainable. Radar satellite data, for instance, plays a pivotal role in crop yield prediction, enabling farmers to optimize irrigation and fertilizer usage. Radiometric calibration ensures data accuracy, while change detection techniques reveal land cover transformations. Infrastructure monitoring benefits from precise image classification algorithms and geometric correction, ensuring safety and efficiency. Precision farming techniques and natural resource assessment rely on data fusion methods, integrating various data types for comprehensive analysis.
  • Climate change modeling and environmental monitoring systems leverage hyperspectral imaging, atmospheric correction methods, and GIS software integration to provide valuable insights. Satellite data processing, including Lidar data acquisition, is essential for water resource management, pollution detection, and deforestation detection. Spectral signature analysis and object detection models aid in urban planning initiatives and disaster response management. Geospatial data analytics, image registration techniques, and cloud computing platforms facilitate the efficient handling and interpretation of vast amounts of data. The market's continuous growth is fueled by the increasing demand for accurate, real-time information and the integration of advanced technologies like AI and machine learning.
  • Key drivers include the need for efficient resource management, environmental protection, and disaster risk reduction. Challenges include data accessibility, affordability, and the need for standardization and interoperability. Despite these challenges, the potential benefits of satellite-based earth observation are immense, making it an indispensable tool for businesses and governments alike. According to recent research, the market is projected to account for over 30% of the overall geospatial technology market by 2025. This underscores the market's significant impact and the immense potential for growth.

What are the Key Data Covered in this Satellite-Based Earth Observation Market Research and Growth Report?

  • What is the expected growth of the Satellite-Based Earth Observation Market between 2025 and 2029?

    • USD 9.66 billion, at a CAGR of 12%

  • What segmentation does the market report cover?

    • The report is segmented by Application (Defense, Weather, Location-Based Services (LBS), Energy, and Others), Type (Value-Added Services (VAS) and Data), Geography (North America, APAC, Europe, South America, Middle East and Africa, and Rest of World (ROW)), Technology (Synthetic aperture radar (SAR) and Optical), and End-User (Government, Commercial, and Academic/Research)

  • Which regions are analyzed in the report?

    • North America, APAC, Europe, South America, and Middle East and Africa

  • What are the key growth drivers and market challenges?

    • Use of satellites for advanced environment monitoring, Competition from alternate technologies

  • Who are the major players in the Satellite-Based Earth Observation Market?

    • Airbus SE, Antrix Corp. Ltd., BAE Systems Plc, Eagle View Technologies Inc., EarthDaily Analytics, Geoimage, Global Surface Intelligence Ltd., Imagesat International I.S.I Ltd., Kleos Space S.A, L3Harris Technologies Inc., Lockheed Martin Corp., Maxar Technologies Inc., Northrop Grumman Corp., OHB SE, Orbital Insight Inc., Orbital Micro Systems, Planet Labs PBC, PlanetiQ, RTX Corp., and Thales Group

Market Research Insights

  • The market encompasses the provision of remote sensing data and value-added services, facilitating decision-making across various industries. This expansion is driven by the increasing demand for high-resolution, real-time earth observation data for applications in agriculture, forestry, disaster management, and infrastructure development. Data uncertainty quantification and interpretation techniques play a crucial role in ensuring the accuracy and reliability of satellite-derived information. For instance, atmospheric interference and temporal resolution effects can significantly impact the precision of satellite data.
  • To mitigate these challenges, advanced regression modeling techniques and machine learning algorithms are employed for data preprocessing and analysis. Additionally, geostatistical modeling and time series analysis are used for data integration workflows and error propagation assessment. Despite these advancements, field data validation remains essential for ensuring the quality and relevance of satellite data. Overall, the market continues to evolve, with remote sensing platforms and data processing techniques advancing to meet the growing demand for actionable insights.

We can help! Our analysts can customize this satellite-based earth observation market research report to meet your requirements.

Get in touch

1 Executive Summary

  • 1.1 Market overview
    • Executive Summary - Chart on Market Overview
    • Executive Summary - Data Table on Market Overview
    • Executive Summary - Chart on Global Market Characteristics
    • Executive Summary - Chart on Market by Geography
    • Executive Summary - Chart on Market Segmentation by Application
    • Executive Summary - Chart on Market Segmentation by Type
    • Executive Summary - Chart on Incremental Growth
    • Executive Summary - Data Table on Incremental Growth
    • Executive Summary - Chart on Company Market Positioning

2 Technavio Analysis

  • 2.1 Analysis of price sensitivity, lifecycle, customer purchase basket, adoption rates, and purchase criteria
    • Analysis of price sensitivity, lifecycle, customer purchase basket, adoption rates, and purchase criteria
  • 2.2 Criticality of inputs and Factors of differentiation
    • Overview on criticality of inputs and factors of differentiation
  • 2.3 Factors of disruption
    • Overview on factors of disruption
  • 2.4 Impact of drivers and challenges
    • Impact of drivers and challenges in 2024 and 2029

3 Market Landscape

  • 3.1 Market ecosystem
    • Parent Market
    • Data Table on - Parent Market
  • 3.2 Market characteristics
    • Market characteristics analysis
  • 3.3 Value chain analysis
    • Value chain analysis

4 Market Sizing

  • 4.1 Market definition
    • Offerings of companies included in the market definition
  • 4.2 Market segment analysis
    • Market segments
  • 4.3 Market size 2024
    • 4.4 Market outlook: Forecast for 2024-2029
      • Chart on Global - Market size and forecast 2024-2029 ($ million)
      • Data Table on Global - Market size and forecast 2024-2029 ($ million)
      • Chart on Global Market: Year-over-year growth 2024-2029 (%)
      • Data Table on Global Market: Year-over-year growth 2024-2029 (%)

    5 Historic Market Size

    • 5.1 Global Satellite-Based Earth Observation Market 2019 - 2023
      • Historic Market Size - Data Table on Global Satellite-Based Earth Observation Market 2019 - 2023 ($ million)
    • 5.2 Application segment analysis 2019 - 2023
      • Historic Market Size - Application Segment 2019 - 2023 ($ million)
    • 5.3 Type segment analysis 2019 - 2023
      • Historic Market Size - Type Segment 2019 - 2023 ($ million)
    • 5.4 Geography segment analysis 2019 - 2023
      • Historic Market Size - Geography Segment 2019 - 2023 ($ million)
    • 5.5 Country segment analysis 2019 - 2023
      • Historic Market Size - Country Segment 2019 - 2023 ($ million)

    6 Qualitative Analysis

    • 6.1 Impact of AI on Global Satellite-based Earth Observation Market

      7 Five Forces Analysis

      • 7.1 Five forces summary
        • Five forces analysis - Comparison between 2024 and 2029
      • 7.2 Bargaining power of buyers
        • Bargaining power of buyers - Impact of key factors 2024 and 2029
      • 7.3 Bargaining power of suppliers
        • Bargaining power of suppliers - Impact of key factors in 2024 and 2029
      • 7.4 Threat of new entrants
        • Threat of new entrants - Impact of key factors in 2024 and 2029
      • 7.5 Threat of substitutes
        • Threat of substitutes - Impact of key factors in 2024 and 2029
      • 7.6 Threat of rivalry
        • Threat of rivalry - Impact of key factors in 2024 and 2029
      • 7.7 Market condition
        • Chart on Market condition - Five forces 2024 and 2029

      8 Market Segmentation by Application

      • 8.1 Market segments
        • Chart on Application - Market share (2024-2029) (%)
        • Data Table on Application - Market share (2024-2029) (%)
      • 8.2 Comparison by Application
        • Chart on Comparison by Application
        • Data Table on Comparison by Application
      • 8.3 Defense - Market size and forecast (2024-2029)
        • Chart on Defense - Market size and forecast (2024-2029) ($ million)
        • Data Table on Defense - Market size and forecast (2024-2029) ($ million)
        • Chart on Defense - Year-over-year growth (2024-2029) (%)
        • Data Table on Defense - Year-over-year growth (2024-2029) (%)
      • 8.4 Weather - Market size and forecast (2024-2029)
        • Chart on Weather - Market size and forecast (2024-2029) ($ million)
        • Data Table on Weather - Market size and forecast (2024-2029) ($ million)
        • Chart on Weather - Year-over-year growth (2024-2029) (%)
        • Data Table on Weather - Year-over-year growth (2024-2029) (%)
      • 8.5 Location-Based Services (LBS) - Market size and forecast (2024-2029)
        • Chart on Location-Based Services (LBS) - Market size and forecast (2024-2029) ($ million)
        • Data Table on Location-Based Services (LBS) - Market size and forecast (2024-2029) ($ million)
        • Chart on Location-Based Services (LBS) - Year-over-year growth (2024-2029) (%)
        • Data Table on Location-Based Services (LBS) - Year-over-year growth (2024-2029) (%)
      • 8.6 Energy - Market size and forecast (2024-2029)
        • Chart on Energy - Market size and forecast (2024-2029) ($ million)
        • Data Table on Energy - Market size and forecast (2024-2029) ($ million)
        • Chart on Energy - Year-over-year growth (2024-2029) (%)
        • Data Table on Energy - Year-over-year growth (2024-2029) (%)
      • 8.7 Others - Market size and forecast (2024-2029)
        • Chart on Others - Market size and forecast (2024-2029) ($ million)
        • Data Table on Others - Market size and forecast (2024-2029) ($ million)
        • Chart on Others - Year-over-year growth (2024-2029) (%)
        • Data Table on Others - Year-over-year growth (2024-2029) (%)
      • 8.8 Market opportunity by Application
        • Market opportunity by Application ($ million)
        • Data Table on Market opportunity by Application ($ million)

      9 Market Segmentation by Type

      • 9.1 Market segments
        • Chart on Type - Market share (2024-2029) (%)
        • Data Table on Type - Market share (2024-2029) (%)
      • 9.2 Comparison by Type
        • Chart on Comparison by Type
        • Data Table on Comparison by Type
      • 9.3 Value-Added Services (VAS) - Market size and forecast (2024-2029)
        • Chart on Value-Added Services (VAS) - Market size and forecast (2024-2029) ($ million)
        • Data Table on Value-Added Services (VAS) - Market size and forecast (2024-2029) ($ million)
        • Chart on Value-Added Services (VAS) - Year-over-year growth (2024-2029) (%)
        • Data Table on Value-Added Services (VAS) - Year-over-year growth (2024-2029) (%)
      • 9.4 Data - Market size and forecast (2024-2029)
        • Chart on Data - Market size and forecast (2024-2029) ($ million)
        • Data Table on Data - Market size and forecast (2024-2029) ($ million)
        • Chart on Data - Year-over-year growth (2024-2029) (%)
        • Data Table on Data - Year-over-year growth (2024-2029) (%)
      • 9.5 Market opportunity by Type
        • Market opportunity by Type ($ million)
        • Data Table on Market opportunity by Type ($ million)

      10 Market Segmentation by Technology

      • 10.1 Market segments
        • Chart on Technology - Market share (2024-2029) (%)
        • Data Table on Technology - Market share (2024-2029) (%)
      • 10.2 Comparison by Technology
        • Chart on Comparison by Technology
        • Data Table on Comparison by Technology
      • 10.3 Synthetic aperture radar (SAR) - Market size and forecast (2024-2029)
        • Chart on Synthetic aperture radar (SAR) - Market size and forecast (2024-2029) ($ million)
        • Data Table on Synthetic aperture radar (SAR) - Market size and forecast (2024-2029) ($ million)
        • Chart on Synthetic aperture radar (SAR) - Year-over-year growth (2024-2029) (%)
        • Data Table on Synthetic aperture radar (SAR) - Year-over-year growth (2024-2029) (%)
      • 10.4 Optical - Market size and forecast (2024-2029)
        • Chart on Optical - Market size and forecast (2024-2029) ($ million)
        • Data Table on Optical - Market size and forecast (2024-2029) ($ million)
        • Chart on Optical - Year-over-year growth (2024-2029) (%)
        • Data Table on Optical - Year-over-year growth (2024-2029) (%)
      • 10.5 Market opportunity by Technology
        • Market opportunity by Technology ($ million)
        • Data Table on Market opportunity by Technology ($ million)

      11 Market Segmentation by End-User

      • 11.1 Market segments
        • Chart on End-User - Market share (2024-2029) (%)
        • Data Table on End-User - Market share (2024-2029) (%)
      • 11.2 Comparison by End-User
        • Chart on Comparison by End-User
        • Data Table on Comparison by End-User
      • 11.3 Government - Market size and forecast (2024-2029)
        • Chart on Government - Market size and forecast (2024-2029) ($ million)
        • Data Table on Government - Market size and forecast (2024-2029) ($ million)
        • Chart on Government - Year-over-year growth (2024-2029) (%)
        • Data Table on Government - Year-over-year growth (2024-2029) (%)
      • 11.4 Commercial - Market size and forecast (2024-2029)
        • Chart on Commercial - Market size and forecast (2024-2029) ($ million)
        • Data Table on Commercial - Market size and forecast (2024-2029) ($ million)
        • Chart on Commercial - Year-over-year growth (2024-2029) (%)
        • Data Table on Commercial - Year-over-year growth (2024-2029) (%)
      • 11.5 Academic/Research - Market size and forecast (2024-2029)
        • Chart on Academic/Research - Market size and forecast (2024-2029) ($ million)
        • Data Table on Academic/Research - Market size and forecast (2024-2029) ($ million)
        • Chart on Academic/Research - Year-over-year growth (2024-2029) (%)
        • Data Table on Academic/Research - Year-over-year growth (2024-2029) (%)
      • 11.6 Market opportunity by End-User
        • Market opportunity by End-User ($ million)
        • Data Table on Market opportunity by End-User ($ million)

      12 Customer Landscape

      • 12.1 Customer landscape overview
        • Analysis of price sensitivity, lifecycle, customer purchase basket, adoption rates, and purchase criteria

      13 Geographic Landscape

      • 13.1 Geographic segmentation
        • Chart on Market share by geography 2024-2029 (%)
        • Data Table on Market share by geography 2024-2029 (%)
      • 13.2 Geographic comparison
        • Chart on Geographic comparison
        • Data Table on Geographic comparison
      • 13.3 North America - Market size and forecast 2024-2029
        • Chart on North America - Market size and forecast 2024-2029 ($ million)
        • Data Table on North America - Market size and forecast 2024-2029 ($ million)
        • Chart on North America - Year-over-year growth 2024-2029 (%)
        • Data Table on North America - Year-over-year growth 2024-2029 (%)
      • 13.4 APAC - Market size and forecast 2024-2029
        • Chart on APAC - Market size and forecast 2024-2029 ($ million)
        • Data Table on APAC - Market size and forecast 2024-2029 ($ million)
        • Chart on APAC - Year-over-year growth 2024-2029 (%)
        • Data Table on APAC - Year-over-year growth 2024-2029 (%)
      • 13.5 Europe - Market size and forecast 2024-2029
        • Chart on Europe - Market size and forecast 2024-2029 ($ million)
        • Data Table on Europe - Market size and forecast 2024-2029 ($ million)
        • Chart on Europe - Year-over-year growth 2024-2029 (%)
        • Data Table on Europe - Year-over-year growth 2024-2029 (%)
      • 13.6 South America - Market size and forecast 2024-2029
        • Chart on South America - Market size and forecast 2024-2029 ($ million)
        • Data Table on South America - Market size and forecast 2024-2029 ($ million)
        • Chart on South America - Year-over-year growth 2024-2029 (%)
        • Data Table on South America - Year-over-year growth 2024-2029 (%)
      • 13.7 Middle East and Africa - Market size and forecast 2024-2029
        • Chart on Middle East and Africa - Market size and forecast 2024-2029 ($ million)
        • Data Table on Middle East and Africa - Market size and forecast 2024-2029 ($ million)
        • Chart on Middle East and Africa - Year-over-year growth 2024-2029 (%)
        • Data Table on Middle East and Africa - Year-over-year growth 2024-2029 (%)
      • 13.8 US - Market size and forecast 2024-2029
        • Chart on US - Market size and forecast 2024-2029 ($ million)
        • Data Table on US - Market size and forecast 2024-2029 ($ million)
        • Chart on US - Year-over-year growth 2024-2029 (%)
        • Data Table on US - Year-over-year growth 2024-2029 (%)
      • 13.9 Russia - Market size and forecast 2024-2029
        • Chart on Russia - Market size and forecast 2024-2029 ($ million)
        • Data Table on Russia - Market size and forecast 2024-2029 ($ million)
        • Chart on Russia - Year-over-year growth 2024-2029 (%)
        • Data Table on Russia - Year-over-year growth 2024-2029 (%)
      • 13.10 China - Market size and forecast 2024-2029
        • Chart on China - Market size and forecast 2024-2029 ($ million)
        • Data Table on China - Market size and forecast 2024-2029 ($ million)
        • Chart on China - Year-over-year growth 2024-2029 (%)
        • Data Table on China - Year-over-year growth 2024-2029 (%)
      • 13.11 Japan - Market size and forecast 2024-2029
        • Chart on Japan - Market size and forecast 2024-2029 ($ million)
        • Data Table on Japan - Market size and forecast 2024-2029 ($ million)
        • Chart on Japan - Year-over-year growth 2024-2029 (%)
        • Data Table on Japan - Year-over-year growth 2024-2029 (%)
      • 13.12 UK - Market size and forecast 2024-2029
        • Chart on UK - Market size and forecast 2024-2029 ($ million)
        • Data Table on UK - Market size and forecast 2024-2029 ($ million)
        • Chart on UK - Year-over-year growth 2024-2029 (%)
        • Data Table on UK - Year-over-year growth 2024-2029 (%)
      • 13.13 South Korea - Market size and forecast 2024-2029
        • Chart on South Korea - Market size and forecast 2024-2029 ($ million)
        • Data Table on South Korea - Market size and forecast 2024-2029 ($ million)
        • Chart on South Korea - Year-over-year growth 2024-2029 (%)
        • Data Table on South Korea - Year-over-year growth 2024-2029 (%)
      • 13.14 Canada - Market size and forecast 2024-2029
        • Chart on Canada - Market size and forecast 2024-2029 ($ million)
        • Data Table on Canada - Market size and forecast 2024-2029 ($ million)
        • Chart on Canada - Year-over-year growth 2024-2029 (%)
        • Data Table on Canada - Year-over-year growth 2024-2029 (%)
      • 13.15 Germany - Market size and forecast 2024-2029
        • Chart on Germany - Market size and forecast 2024-2029 ($ million)
        • Data Table on Germany - Market size and forecast 2024-2029 ($ million)
        • Chart on Germany - Year-over-year growth 2024-2029 (%)
        • Data Table on Germany - Year-over-year growth 2024-2029 (%)
      • 13.16 Brazil - Market size and forecast 2024-2029
        • Chart on Brazil - Market size and forecast 2024-2029 ($ million)
        • Data Table on Brazil - Market size and forecast 2024-2029 ($ million)
        • Chart on Brazil - Year-over-year growth 2024-2029 (%)
        • Data Table on Brazil - Year-over-year growth 2024-2029 (%)
      • 13.17 Saudi Arabia - Market size and forecast 2024-2029
        • Chart on Saudi Arabia - Market size and forecast 2024-2029 ($ million)
        • Data Table on Saudi Arabia - Market size and forecast 2024-2029 ($ million)
        • Chart on Saudi Arabia - Year-over-year growth 2024-2029 (%)
        • Data Table on Saudi Arabia - Year-over-year growth 2024-2029 (%)
      • 13.18 Market opportunity by geography
        • Market opportunity by geography ($ million)
        • Data Tables on Market opportunity by geography ($ million)
      • 13.19 UAE - Market size and forecast (2024-2029)
        • Chart on UAE - Market size and forecast (2024-2029) ($ million)
        • Data Table on UAE - Market size and forecast (2024-2029) ($ million)
        • Chart on UAE - Year-over-year growth (2024-2029) (%)
        • Data Table on UAE - Year-over-year growth (2024-2029) (%)
      • 13.20 Rest of World (ROW) - Market size and forecast (2024-2029)
        • Chart on Rest of World (ROW) - Market size and forecast (2024-2029) ($ million)
        • Data Table on Rest of World (ROW) - Market size and forecast (2024-2029) ($ million)
        • Chart on Rest of World (ROW) - Year-over-year growth (2024-2029) (%)
        • Data Table on Rest of World (ROW) - Year-over-year growth (2024-2029) (%)

      14 Drivers, Challenges, and Opportunity/Restraints

      • 14.1 Market drivers
        • 14.2 Market challenges
          • 14.3 Impact of drivers and challenges
            • Impact of drivers and challenges in 2024 and 2029
          • 14.4 Market opportunities/restraints

            15 Competitive Landscape

            • 15.1 Overview
              • 15.2 Competitive Landscape
                • Overview on criticality of inputs and factors of differentiation
              • 15.3 Landscape disruption
                • Overview on factors of disruption
              • 15.4 Industry risks
                • Impact of key risks on business

              16 Competitive Analysis

              • 16.1 Companies profiled
                • Companies covered
              • 16.2 Company ranking index
                • Company ranking index
              • 16.3 Market positioning of companies
                • Matrix on companies position and classification
              • 16.4 Airbus SE
                • Airbus SE - Overview
                • Airbus SE - Business segments
                • Airbus SE - Key news
                • Airbus SE - Key offerings
                • Airbus SE - Segment focus
                • SWOT
              • 16.5 Antrix Corp. Ltd.
                • Antrix Corp. Ltd. - Overview
                • Antrix Corp. Ltd. - Product / Service
                • Antrix Corp. Ltd. - Key offerings
                • SWOT
              • 16.6 BAE Systems Plc
                • BAE Systems Plc - Overview
                • BAE Systems Plc - Business segments
                • BAE Systems Plc - Key news
                • BAE Systems Plc - Key offerings
                • BAE Systems Plc - Segment focus
                • SWOT
              • 16.7 Geoimage
                • Geoimage - Overview
                • Geoimage - Product / Service
                • Geoimage - Key offerings
                • SWOT
              • 16.8 Global Surface Intelligence Ltd.
                • Global Surface Intelligence Ltd. - Overview
                • Global Surface Intelligence Ltd. - Product / Service
                • Global Surface Intelligence Ltd. - Key offerings
                • SWOT
              • 16.9 Imagesat International I.S.I Ltd.
                • Imagesat International I.S.I Ltd. - Overview
                • Imagesat International I.S.I Ltd. - Product / Service
                • Imagesat International I.S.I Ltd. - Key offerings
                • SWOT
              • 16.10 Kleos Space S.A
                • Kleos Space S.A - Overview
                • Kleos Space S.A - Product / Service
                • Kleos Space S.A - Key offerings
                • SWOT
              • 16.11 L3Harris Technologies Inc.
                • L3Harris Technologies Inc. - Overview
                • L3Harris Technologies Inc. - Business segments
                • L3Harris Technologies Inc. - Key news
                • L3Harris Technologies Inc. - Key offerings
                • L3Harris Technologies Inc. - Segment focus
                • SWOT
              • 16.12 Lockheed Martin Corp.
                • Lockheed Martin Corp. - Overview
                • Lockheed Martin Corp. - Business segments
                • Lockheed Martin Corp. - Key news
                • Lockheed Martin Corp. - Key offerings
                • Lockheed Martin Corp. - Segment focus
                • SWOT
              • 16.13 Maxar Technologies Inc.
                • Maxar Technologies Inc. - Overview
                • Maxar Technologies Inc. - Product / Service
                • Maxar Technologies Inc. - Key news
                • Maxar Technologies Inc. - Key offerings
                • SWOT
              • 16.14 Northrop Grumman Corp.
                • Northrop Grumman Corp. - Overview
                • Northrop Grumman Corp. - Business segments
                • Northrop Grumman Corp. - Key news
                • Northrop Grumman Corp. - Key offerings
                • Northrop Grumman Corp. - Segment focus
                • SWOT
              • 16.15 OHB SE
                • OHB SE - Overview
                • OHB SE - Business segments
                • OHB SE - Key offerings
                • OHB SE - Segment focus
                • SWOT
              • 16.16 Planet Labs PBC
                • Planet Labs PBC - Overview
                • Planet Labs PBC - Product / Service
                • Planet Labs PBC - Key offerings
                • SWOT
              • 16.17 RTX Corp.
                • RTX Corp. - Overview
                • RTX Corp. - Business segments
                • RTX Corp. - Key news
                • RTX Corp. - Key offerings
                • RTX Corp. - Segment focus
                • SWOT
              • 16.18 Thales Group
                • Thales Group - Overview
                • Thales Group - Business segments
                • Thales Group - Key news
                • Thales Group - Key offerings
                • Thales Group - Segment focus
                • SWOT

              17 Appendix

              • 17.1 Scope of the report
                • 17.2 Inclusions and exclusions checklist
                  • Inclusions checklist
                  • Exclusions checklist
                • 17.3 Currency conversion rates for US$
                  • Currency conversion rates for US$
                • 17.4 Research methodology
                  • Research methodology
                • 17.5 Data procurement
                  • Information sources
                • 17.6 Data validation
                  • Data validation
                • 17.7 Validation techniques employed for market sizing
                  • Validation techniques employed for market sizing
                • 17.8 Data synthesis
                  • Data synthesis
                • 17.9 360 degree market analysis
                  • 360 degree market analysis
                • 17.10 List of abbreviations
                  • List of abbreviations

                Research Methodology

                Technavio presents a detailed picture of the market by way of study, synthesis, and summation of data from multiple sources. The analysts have presented the various facets of the market with a particular focus on identifying the key industry influencers. The data thus presented is comprehensive, reliable, and the result of extensive research, both primary and secondary.

                INFORMATION SOURCES

                Primary sources

                • Manufacturers and suppliers
                • Channel partners
                • Industry experts
                • Strategic decision makers

                Secondary sources

                • Industry journals and periodicals
                • Government data
                • Financial reports of key industry players
                • Historical data
                • Press releases

                DATA ANALYSIS

                Data Synthesis

                • Collation of data
                • Estimation of key figures
                • Analysis of derived insights

                Data Validation

                • Triangulation with data models
                • Reference against proprietary databases
                • Corroboration with industry experts

                REPORT WRITING

                Qualitative

                • Market drivers
                • Market challenges
                • Market trends
                • Five forces analysis

                Quantitative

                • Market size and forecast
                • Market segmentation
                • Geographical insights
                • Competitive landscape

                Interested in this report?

                Get your sample now to see our research methodology and insights!

                Download Now

                Frequently Asked Questions

                Satellite-Based Earth Observation market growth will increase by $ 9655.5 mn during 2025-2029.

                The Satellite-Based Earth Observation market is expected to grow at a CAGR of 12% during 2025-2029.

                Satellite-Based Earth Observation market is segmented by Application( Defense, Weather, Location-Based Services (LBS), Energy, Others) Type( Value-Added Services (VAS), Data, Europe, South America, MEA)

                Airbus SE, Antrix Corp. Ltd., BAE Systems Plc, Eagle View Technologies Inc., EarthDaily Analytics, Geoimage, Global Surface Intelligence Ltd., Imagesat International I.S.I Ltd., Kleos Space S.A, L3Harris Technologies Inc., Lockheed Martin Corp., Maxar Technologies Inc., Northrop Grumman Corp., OHB SE, Orbital Insight Inc., Orbital Micro Systems, Planet Labs PBC, PlanetiQ, RTX Corp., Thales Group are a few of the key vendors in the Satellite-Based Earth Observation market.

                North America will register the highest growth rate of 43% among the other regions. Therefore, the Satellite-Based Earth Observation market in North America is expected to garner significant business opportunities for the vendors during the forecast period.

                US, Russia, China, Japan, UK, South Korea, Canada, Germany, Brazil, Saudi Arabia, UAE

                • Use of satellites for advanced environment monitoringSatellites are used for environmental monitoring due to their ability to monitor the macroscopic environment is the driving factor this market.
                • hidden features is the driving factor this market.
                • and short-term and long-term weather events that cannot be discerned through ground-based observation alone. Observation satellites can provide real-time is the driving factor this market.
                • round-the-clock information on atmospheric features and occurrences that are vital for accurate weather forecasting is the driving factor this market.
                • including temperature is the driving factor this market.
                • wind is the driving factor this market.
                • and weather patterns.The use of satellites for advanced environmental condition monitoring is now getting significant with applications like greenhouse gas emissions is the driving factor this market.
                • changes in polar ice is the driving factor this market.
                • deforestation is the driving factor this market.
                • observation of wildfires is the driving factor this market.
                • and coral bleaching. Advances in sensing and imaging technologies in the past decade have led to the development of superior observation satellites for environmental monitoring; these satellites allow for higher-resolution images and the measurement of a large number of metrics. Further is the driving factor this market.
                • the National Oceanic and Atmospheric Association (NOAA) and NASA have partnered to develop the Geostationary Operational Environmental Satellite (GOES) is the driving factor this market.
                • which would even detect lightning and provide early warning for thunderstorms is the driving factor this market.
                • hurricanes is the driving factor this market.
                • and tornadoes. Thus is the driving factor this market.
                • the use of satellites for advanced environment monitoring will drive the global satellite-based Earth observation market during the forecast period. is the driving factor this market.

                The Satellite-Based Earth Observation market vendors should focus on grabbing business opportunities from the Defense segment as it accounted for the largest market share in the base year.