Electric Scooter Battery Market Analysis, Size, and Forecast 2026-2030: APAC (China, India, and Indonesia), Europe (Germany, UK, and France), North America (US, Canada, and Mexico), South America (Brazil, Argentina, and Colombia), Middle East and Africa (Turkey, South Africa, and UAE), and Rest of World (ROW)

Electric Scooter Battery Market Analysis, Size, and Forecast 2026-2030:
APAC (China, India, and Indonesia), Europe (Germany, UK, and France), North America (US, Canada, and Mexico), South America (Brazil, Argentina, and Colombia), Middle East and Africa (Turkey, South Africa, and UAE), and Rest of World (ROW)

Published: Dec 2025 307 Pages SKU: IRTNTR81184

Market Overview at a Glance

$19.83 B
Market Opportunity
17.1%
CAGR 2025 - 2030
86.1%
APAC Growth
$
Lithium‑ion segment 2024

Electric Scooter Battery Market Size 2026-2030

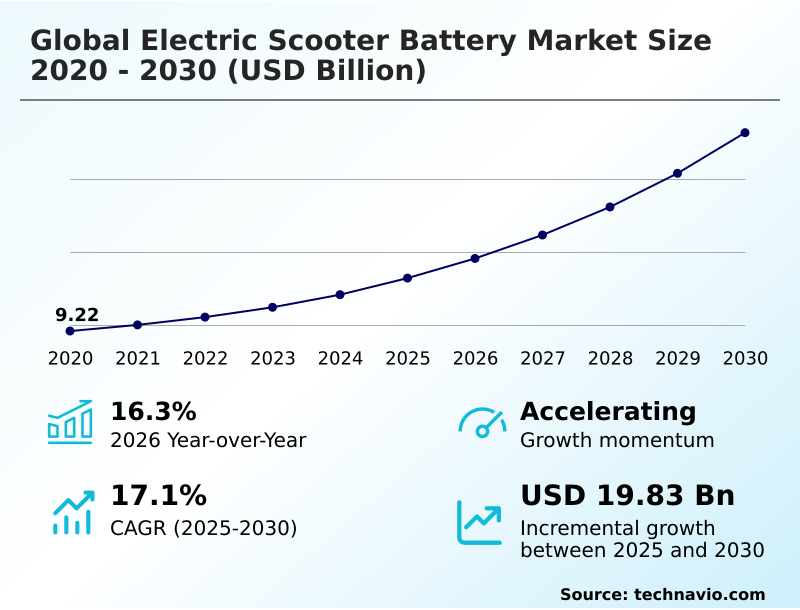
The electric scooter battery market size is valued to increase by USD 19.83 billion, at a CAGR of 17.1% from 2025 to 2030. Supply chain volatility and geopolitical dependencies on critical raw materials will drive the electric scooter battery market.

Major Market Trends & Insights

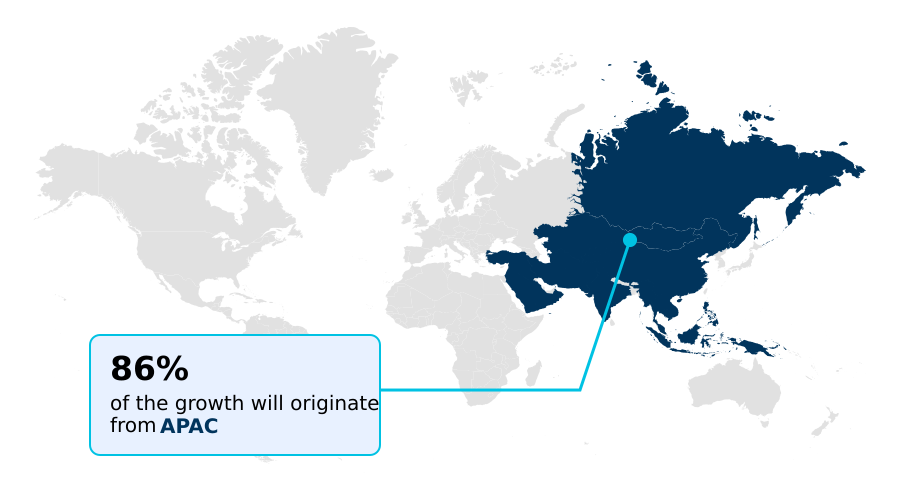
  • APAC dominated the market and accounted for a 86.1% growth during the forecast period.
  • By Battery Type - Lithium‑ion segment was valued at in 2024
  • By Capacity - 20‑50 Ah segment accounted for the largest market revenue share in 2024

Market Size & Forecast

  • Market Opportunities: USD 27.05 billion
  • Market Future Opportunities: USD 19.83 billion
  • CAGR from 2025 to 2030 : 17.1%

Market Summary

  • The electric scooter battery market is undergoing a significant transformation, driven by the convergence of sustainable urban transport initiatives and rapid technological progress. This evolution is defined by a shift toward more advanced chemistries that offer higher performance and safety.
  • As cities grapple with congestion, the demand for efficient last-mile transport solutions fuels the expansion of shared micro-mobility fleets, creating consistent demand for durable, high-cycle batteries. A key industry trend is the development of sophisticated battery management system (BMS) technologies, which are crucial for preventing thermal runaway and optimizing battery health.
  • For instance, a fleet operator can leverage a smart BMS to implement a predictive maintenance schedule, analyzing real-time data to identify underperforming battery packs before they fail, thereby reducing operational downtime and enhancing rider safety. This focus on intelligent systems is complemented by the growth of battery-swapping infrastructure, which addresses consumer range anxiety.
  • However, the market faces challenges related to compliance with evolving UL standards and the establishment of a circular economy for effective end-of-life management of used batteries, pushing for greater sustainability across the value chain.

What will be the Size of the Electric Scooter Battery Market during the forecast period?

Get Key Insights on Market Forecast (PDF) Request Free Sample

How is the Electric Scooter Battery Market Segmented?

The electric scooter battery industry research report provides comprehensive data (region-wise segment analysis), with forecasts and estimates in "USD million" for the period 2026-2030, as well as historical data from 2020-2024 for the following segments.
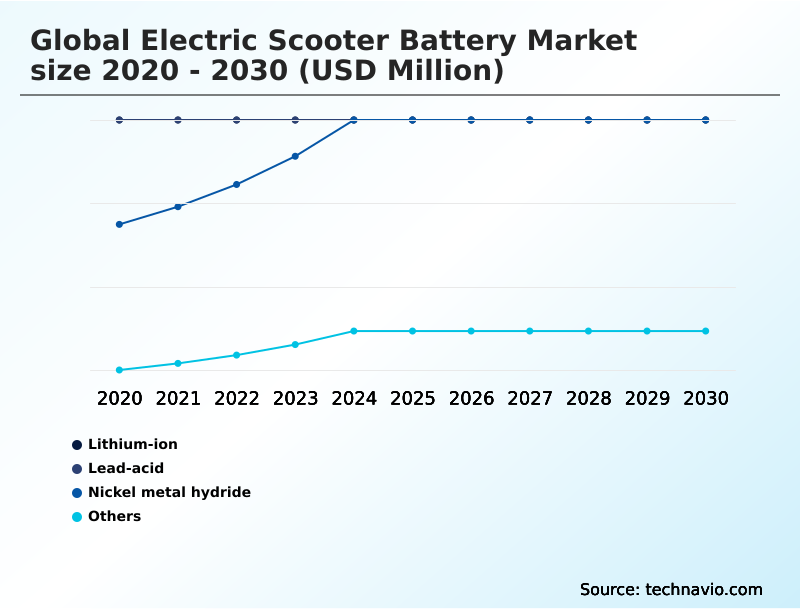
  • Battery type
    • Lithium ion
    • Lead acid
    • Nickel metal hydride
    • Others
  • Capacity
    • Between 20 Ah and 50 Ah
    • Below 20 Ah
    • Above 50 Ah
  • Power output
    • 48 V
    • 36 V
    • 24 V
    • Others
  • Geography
    • APAC
      • China
      • India
      • Indonesia
    • Europe
      • Germany
      • UK
      • France
    • North America
      • US
      • Canada
      • Mexico
    • South America
      • Brazil
      • Argentina
      • Colombia
    • Middle East and Africa
      • Turkey
      • South Africa
      • UAE
    • Rest of World (ROW)

By Battery Type Insights

The lithium ion segment is estimated to witness significant growth during the forecast period.

The market is primarily defined by the performance characteristics of its lithium-ion segment, where distinct chemistries cater to specific applications.

For high-performance consumer models, lithium nickel manganese cobalt oxide (NMC) is favored for its high energy density, enabling longer range and lighter vehicles.

In contrast, lithium iron phosphate (LFP) dominates mass-market and shared mobility applications due to superior safety, exceptional cycle life often exceeding 3,000 charge cycles, and lower cost.

Innovations focus on enhancing fast-charging capabilities and integrating smart battery management systems that provide cell-level monitoring.

The adoption of automotive-grade standards for these commercial-grade products ensures reliability and improves cold weather performance, making electric scooters a more viable all-season transportation solution.

Request Free Sample

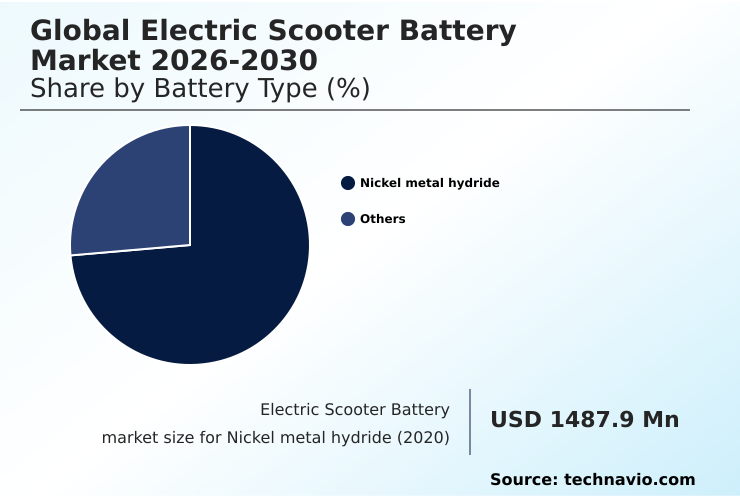
The Lithium ion segment was valued at in 2024 and showed a gradual increase during the forecast period.

Request Free Sample

Regional Analysis

APAC is estimated to contribute 86.1% to the growth of the global market during the forecast period.Technavio’s analysts have elaborately explained the regional trends and drivers that shape the market during the forecast period.

See How Electric Scooter Battery Market Demand is Rising in APAC Request Free Sample

The geographic landscape of the market is dominated by the APAC region, which is projected to contribute approximately 86% of the incremental growth. This dominance is driven by intense urbanization and a well-established manufacturing ecosystem.

In this region, the proliferation of shared micro-mobility services provides essential last-mile connectivity in dense urban centers, creating large-scale demand for robust high-utilization models and a sizable market for aftermarket batteries.

The region's growth, which outpaces other regions with a rate exceeding 17%, is also fueled by the rapid expansion of battery-swapping infrastructure, particularly in China and India.

In contrast, markets in Europe and North America are characterized by a stronger regulatory focus on sustainability and safety standards, shaping product development and creating distinct regional market dynamics.

Market Dynamics

Our researchers analyzed the data with 2025 as the base year, along with the key drivers, trends, and challenges. A holistic analysis of drivers will help companies refine their marketing strategies to gain a competitive advantage.

  • A comprehensive analysis of the electric scooter battery market requires a deep dive into several interconnected technical and strategic considerations. A central debate involves LFP vs NMC battery performance characteristics, where decisions are based on trade-offs between cost, safety, and energy density.
  • The impact of BMS on scooter battery longevity is a critical factor, as advanced systems can significantly extend operational life. Strategically, assessing the commercial viability of sodium-ion batteries is paramount, as they offer a path to mitigate geopolitical risks in cobalt supply chains.
  • Simultaneously, the industry is closely watching developments in solid-state battery safety advantages, which promise to eliminate risks associated with liquid electrolytes. Operationally, implementing a circular economy for batteries is no longer optional, with a focus on the challenges in end-of-life battery logistics and improving hydrometallurgical recycling process efficiency. This includes creating pathways for second-life applications for scooter batteries.
  • The debate between battery swapping versus direct charging models continues, with each having distinct implications for infrastructure, while BaaS models for urban mobility fleets offer a compelling economic alternative. On the technical front, optimizing thermal management for high-capacity packs is essential for preventing failure, just as managing thermal runaway in LFP batteries remains a key safety focus.
  • Energy density improvements in silicon anodes represent a significant R&D frontier, while cost reduction via dry-coating electrodes offers a path to more affordable manufacturing. Finally, ensuring UL standards compliance for micromobility and understanding the extended producer responsibility scheme impact are crucial for market access.
  • The cold weather performance of Na-ion cells provides a key advantage in certain climates, and leveraging predictive maintenance for shared scooter fleets has been shown to reduce operational costs by over 15% compared to reactive maintenance strategies.

What are the key market drivers leading to the rise in the adoption of Electric Scooter Battery Industry?

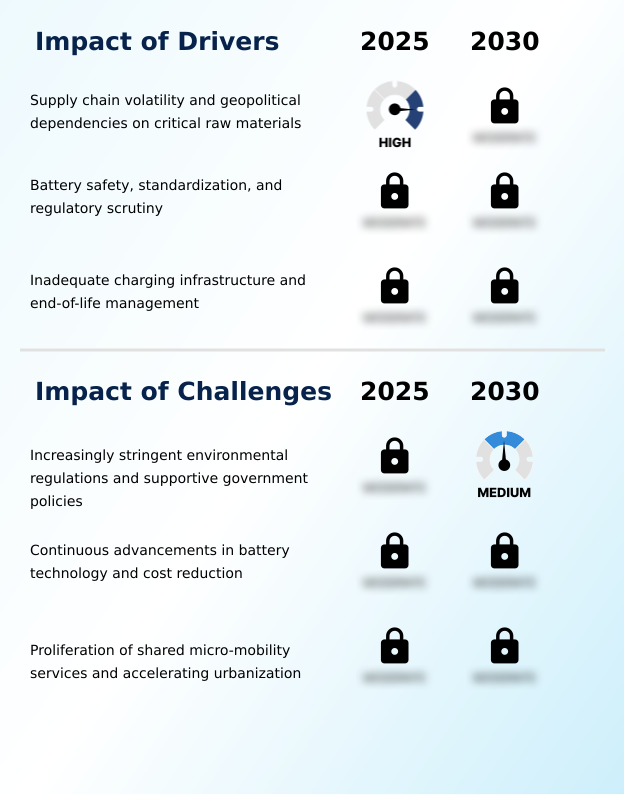
  • Supply chain volatility and geopolitical dependencies on critical raw materials are key factors influencing market strategies and technological development.

  • Market growth is significantly driven by the expansion of shared micro-mobility services, which provide critical last-mile connectivity in congested urban areas. These services create large-scale demand for durable, commercial-grade products and sophisticated swappable battery systems.
  • The build-out of battery-swapping infrastructure is a powerful catalyst, eliminating consumer range anxiety and optimizing operations for high-utilization models. Technological advancements are a parallel driver, with continuous improvements in energy density and power density enhancing vehicle performance.
  • Innovations in manufacturing, such as dry-coating electrodes and improved fast-charging capabilities, are helping to reduce production costs and make advanced battery technologies more accessible to a broader market.

What are the market trends shaping the Electric Scooter Battery Industry?

  • The market is witnessing the emergence of alternative battery chemistries beyond traditional lithium-ion. This shift is creating more sustainable and cost-effective energy solutions for the industry.

  • A key trend is the commercialization of alternative battery chemistries designed to reduce reliance on traditional components. sodium-ion batteries are rapidly gaining traction, offering impressive performance that can achieve an 80% charge in just 15 minutes and retain over 92% of their capacity in cold weather. This is driving investment away from conventional liquid electrolyte systems.
  • Concurrently, solid-state batteries and rechargeable zinc-air battery technologies are advancing toward viability. The integration of intelligence through an advanced BMS platform is enabling innovative business models like battery-as-a-service (BaaS). These platforms are also laying the groundwork for future vehicle-to-grid applications, while R&D in lithium-polymer batteries and anode-free battery technology continues to push performance boundaries.

What challenges does the Electric Scooter Battery Industry face during its growth?

  • Increasingly stringent environmental regulations and supportive government policies present a complex landscape for manufacturers, affecting industry growth and product development.

  • A primary challenge is the volatility of the raw material supply chain for key minerals, which impacts the cost of high-nickel cylindrical cells and other components. Ensuring safety is another critical hurdle, with a focus on preventing thermal runaway and managing the risks associated with unregulated aftermarket batteries and certain low-cost battery options.
  • In response, regulators are enforcing stricter UL standards, creating a complex compliance landscape. The industry also faces the challenge of end-of-life management, with new extended producer responsibility schemes mandating producers to finance recycling. These regulations require investment in advanced thermal management systems and are driving consolidation around vendors who produce certified 46-series cylindrical batteries and other high-quality, compliant products.

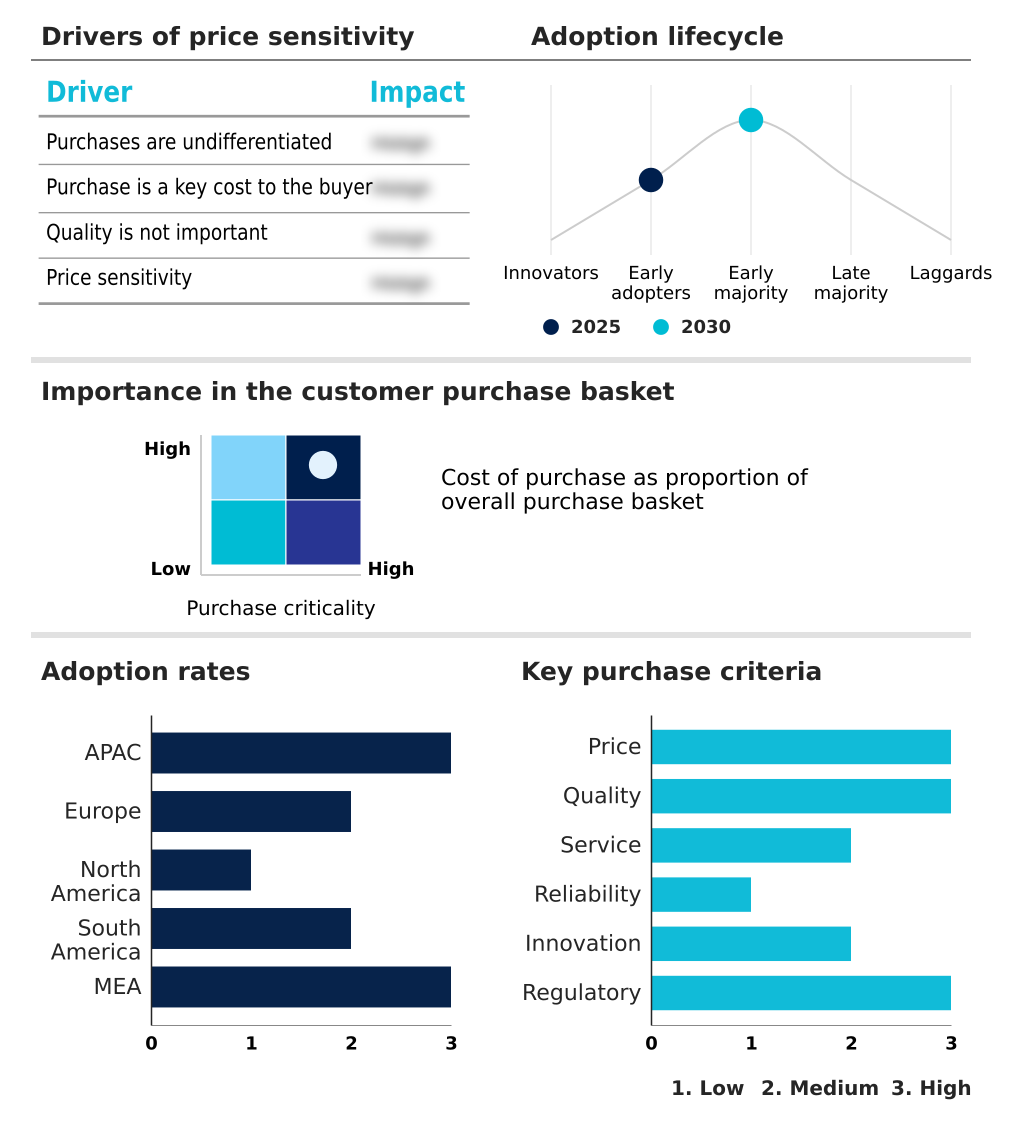
Exclusive Technavio Analysis on Customer Landscape

The electric scooter battery market forecasting report includes the adoption lifecycle of the market, covering from the innovator’s stage to the laggard’s stage. It focuses on adoption rates in different regions based on penetration. Furthermore, the electric scooter battery market report also includes key purchase criteria and drivers of price sensitivity to help companies evaluate and develop their market growth analysis strategies.

Customer Landscape of Electric Scooter Battery Industry

Competitive Landscape

Companies are implementing various strategies, such as strategic alliances, electric scooter battery market forecast, partnerships, mergers and acquisitions, geographical expansion, and product/service launches, to enhance their presence in the industry.

A123 Systems LLC - An analyst viewpoint highlights offerings of nanophosphate lithium-ion modules, engineered for superior power output, abuse tolerance, and extended cycle life in demanding electric mobility applications.

The industry research and growth report includes detailed analyses of the competitive landscape of the market and information about key companies, including:

  • A123 Systems LLC
  • Amperex Technology Ltd.
  • Ather Energy Pvt. Ltd.
  • BYD Co. Ltd.
  • Contemporary Amperex Ltd.
  • EVE Energy Co. Ltd.
  • Exide Technologies
  • GS Yuasa International Ltd.
  • Johnson Controls International
  • LG Chem Ltd.
  • Microvast Holdings Inc.
  • Panasonic Holdings Corp.
  • Resonac Holdings Corp.
  • Samsung SDI Co. Ltd.
  • Toshiba Corp.
  • VARTA AG

Qualitative and quantitative analysis of companies has been conducted to help clients understand the wider business environment as well as the strengths and weaknesses of key industry players. Data is qualitatively analyzed to categorize companies as pure play, category-focused, industry-focused, and diversified; it is quantitatively analyzed to categorize companies as dominant, leading, strong, tentative, and weak.

Recent Development and News in Electric scooter battery market

  • In January 2025, Yadea launched its first commercial series of electric scooters powered by sodium-ion batteries, demonstrating the technology's viability for mass-market micromobility with fast-charging and strong cold-weather performance.
  • In February 2025, Gogoro announced a new strategic joint venture to expand its established battery-swapping network into the Vietnamese market, marking a significant geographic expansion for the Battery-as-a-Service model in Southeast Asia.
  • In April 2025, Contemporary Amperex Technology Ltd. (CATL) announced plans to mass-produce its second-generation sodium-ion battery, specifically targeting the two-wheeler market with a chemistry that offers a lower-cost alternative to traditional lithium-ion.
  • In April 2025, Samsung SDI began production of its next-generation 46-series cylindrical batteries, initially supplying the high-performance cells for micromobility applications and signaling a strategic focus on this growing vehicle segment.

Dive into Technavio’s robust research methodology, blending expert interviews, extensive data synthesis, and validated models for unparalleled Electric Scooter Battery Market insights. See full methodology.

Market Scope
Page number 307
Base year 2025
Historic period 2020-2024
Forecast period 2026-2030
Growth momentum & CAGR Accelerate at a CAGR of 17.1%
Market growth 2026-2030 USD 19832.5 million
Market structure Fragmented
YoY growth 2025-2026(%) 16.3%
Key countries China, India, Indonesia, Japan, South Korea, Australia, Germany, UK, France, Italy, Spain, The Netherlands, US, Canada, Mexico, Brazil, Argentina, Colombia, Turkey, South Africa, UAE, Israel and Saudi Arabia
Competitive landscape Leading Companies, Market Positioning of Companies, Competitive Strategies, and Industry Risks

Request Free Sample

Research Analyst Overview

  • From a research analyst's perspective, the electric scooter battery market is at a critical juncture, driven by the dual imperatives of performance and sustainability. The core of the market revolves around advancing lithium iron phosphate and lithium nickel manganese cobalt oxide chemistries to improve energy density and power density.
  • However, the strategic focus is shifting toward alternative battery chemistries like sodium-ion batteries and, in the long term, solid-state batteries to mitigate raw material supply chain risks. For boardroom decisions, the adoption of a circular economy framework is paramount.
  • This involves navigating the complexities of end-of-life management and extended producer responsibility regulations, which increasingly mandate investment in hydrometallurgical processes and creating pathways for second-life applications. Operationally, the expansion of shared micro-mobility fleets requires batteries with exceptional cycle life and safety features managed by an intelligent battery management system capable of cell-level monitoring to prevent thermal runaway.
  • Compliance with evolving UL standards is non-negotiable. Furthermore, innovative models like battery-as-a-service and supporting battery-swapping infrastructure, alongside manufacturing advances such as dry-coating electrodes to replace the traditional liquid electrolyte and the use of silicon-anode composite materials, are reshaping the competitive landscape.

What are the Key Data Covered in this Electric Scooter Battery Market Research and Growth Report?

  • What is the expected growth of the Electric Scooter Battery Market between 2026 and 2030?

    • USD 19.83 billion, at a CAGR of 17.1%

  • What segmentation does the market report cover?

    • The report is segmented by Battery Type (Lithium‑ion, Lead‑acid, Nickel metal hydride, and Others), Capacity (20‑50 Ah, Below 20 Ah, and Above 50 Ah), Power Output (48 V, 36 V, 24 V, and Others) and Geography (APAC, Europe, North America, South America, Middle East and Africa)

  • Which regions are analyzed in the report?

    • APAC, Europe, North America, South America and Middle East and Africa

  • What are the key growth drivers and market challenges?

    • Supply chain volatility and geopolitical dependencies on critical raw materials, Increasingly stringent environmental regulations and supportive government policies

  • Who are the major players in the Electric Scooter Battery Market?

    • A123 Systems LLC, Amperex Technology Ltd., Ather Energy Pvt. Ltd., BYD Co. Ltd., Contemporary Amperex Ltd., EVE Energy Co. Ltd., Exide Technologies, GS Yuasa International Ltd., Johnson Controls International, LG Chem Ltd., Microvast Holdings Inc., Panasonic Holdings Corp., Resonac Holdings Corp., Samsung SDI Co. Ltd., Toshiba Corp. and VARTA AG

Market Research Insights

  • The market's dynamism is driven by a dual focus on technological sophistication and operational efficiency. High price sensitivity among buyers is compelling a shift toward innovative business models built on swappable battery systems, which can reduce initial vehicle costs by as much as 30%. On the supply side, high capital expenditure requirements for vendors are pushing for value-added services.
  • The integration of an advanced BMS platform enables capabilities like predictive maintenance, which can decrease fleet downtime by over 20%. Furthermore, regulatory pressures are accelerating the adoption of sustainability-focused technologies like the digital battery passport, which mandates carbon footprint disclosure and creates new avenues for competitive differentiation through transparency and compliance.

We can help! Our analysts can customize this electric scooter battery market research report to meet your requirements.

Get in touch

1. Executive Summary

1.1 Market overview

Executive Summary - Chart on Market Overview
Executive Summary - Data Table on Market Overview
Executive Summary - Chart on Global Market Characteristics
Executive Summary - Chart on Market by Geography
Executive Summary - Chart on Market Segmentation by Battery Type
Executive Summary - Chart on Market Segmentation by Capacity
Executive Summary - Chart on Market Segmentation by Power Output
Executive Summary - Chart on Incremental Growth
Executive Summary - Data Table on Incremental Growth
Executive Summary - Chart on Company Market Positioning

2. Technavio Analysis

2.1 Analysis of price sensitivity, lifecycle, customer purchase basket, adoption rates, and purchase criteria

2.2 Criticality of inputs and Factors of differentiation

Chart on Overview on criticality of inputs and factors of differentiation

2.3 Factors of disruption

Chart on Overview on factors of disruption

2.4 Impact of drivers and challenges

Chart on Impact of drivers and challenges in 2025 and 2030

3. Market Landscape

3.1 Market ecosystem

Chart on Parent Market
Data Table on - Parent Market

3.2 Market characteristics

Chart on Market characteristics analysis

3.3 Value chain analysis

Chart on Value chain analysis

4. Market Sizing

4.1 Market definition

Data Table on Offerings of companies included in the market definition

4.2 Market segment analysis

Market segments

4.3 Market size 2025

4.4 Market outlook: Forecast for 2025-2030

Chart on Global - Market size and forecast 2025-2030 ($ million)
Data Table on Global - Market size and forecast 2025-2030 ($ million)
Chart on Global Market: Year-over-year growth 2025-2030 (%)
Data Table on Global Market: Year-over-year growth 2025-2030 (%)

5. Historic Market Size

5.1 Global Electric Scooter Battery Market 2020 - 2024

Historic Market Size - Data Table on Global Electric Scooter Battery Market 2020 - 2024 ($ million)

5.2 Battery Type segment analysis 2020 - 2024

Historic Market Size - Battery Type Segment 2020 - 2024 ($ million)

5.3 Capacity segment analysis 2020 - 2024

Historic Market Size - Capacity Segment 2020 - 2024 ($ million)

5.4 Power Output segment analysis 2020 - 2024

Historic Market Size - Power Output Segment 2020 - 2024 ($ million)

5.5 Geography segment analysis 2020 - 2024

Historic Market Size - Geography Segment 2020 - 2024 ($ million)

5.6 Country segment analysis 2020 - 2024

Historic Market Size - Country Segment 2020 - 2024 ($ million)

6. Qualitative Analysis

6.1 The AI impact on global electric scooter battery market

7. Five Forces Analysis

7.1 Five forces summary

Five forces analysis - Comparison between 2025 and 2030

7.2 Bargaining power of buyers

Bargaining power of buyers - Impact of key factors 2025 and 2030

7.3 Bargaining power of suppliers

Bargaining power of suppliers - Impact of key factors in 2025 and 2030

7.4 Threat of new entrants

Threat of new entrants - Impact of key factors in 2025 and 2030

7.5 Threat of substitutes

Threat of substitutes - Impact of key factors in 2025 and 2030

7.6 Threat of rivalry

Threat of rivalry - Impact of key factors in 2025 and 2030

7.7 Market condition

Chart on Market condition - Five forces 2025 and 2030

8. Market Segmentation by Battery Type

8.1 Market segments

Chart on Battery Type - Market share 2025-2030 (%)
Data Table on Battery Type - Market share 2025-2030 (%)

8.2 Comparison by Battery Type

Chart on Comparison by Battery Type
Data Table on Comparison by Battery Type

8.3 Lithium ion - Market size and forecast 2025-2030

Chart on Lithium ion - Market size and forecast 2025-2030 ($ million)
Data Table on Lithium ion - Market size and forecast 2025-2030 ($ million)
Chart on Lithium ion - Year-over-year growth 2025-2030 (%)
Data Table on Lithium ion - Year-over-year growth 2025-2030 (%)

8.4 Lead acid - Market size and forecast 2025-2030

Chart on Lead acid - Market size and forecast 2025-2030 ($ million)
Data Table on Lead acid - Market size and forecast 2025-2030 ($ million)
Chart on Lead acid - Year-over-year growth 2025-2030 (%)
Data Table on Lead acid - Year-over-year growth 2025-2030 (%)

8.5 Nickel metal hydride - Market size and forecast 2025-2030

Chart on Nickel metal hydride - Market size and forecast 2025-2030 ($ million)
Data Table on Nickel metal hydride - Market size and forecast 2025-2030 ($ million)
Chart on Nickel metal hydride - Year-over-year growth 2025-2030 (%)
Data Table on Nickel metal hydride - Year-over-year growth 2025-2030 (%)

8.6 Others - Market size and forecast 2025-2030

Chart on Others - Market size and forecast 2025-2030 ($ million)
Data Table on Others - Market size and forecast 2025-2030 ($ million)
Chart on Others - Year-over-year growth 2025-2030 (%)
Data Table on Others - Year-over-year growth 2025-2030 (%)

8.7 Market opportunity by Battery Type

Market opportunity by Battery Type ($ million)
Data Table on Market opportunity by Battery Type ($ million)

9. Market Segmentation by Capacity

9.1 Market segments

Chart on Capacity - Market share 2025-2030 (%)
Data Table on Capacity - Market share 2025-2030 (%)

9.2 Comparison by Capacity

Chart on Comparison by Capacity
Data Table on Comparison by Capacity

9.3 Between 20 Ah and 50 Ah - Market size and forecast 2025-2030

Chart on Between 20 Ah and 50 Ah - Market size and forecast 2025-2030 ($ million)
Data Table on Between 20 Ah and 50 Ah - Market size and forecast 2025-2030 ($ million)
Chart on Between 20 Ah and 50 Ah - Year-over-year growth 2025-2030 (%)
Data Table on Between 20 Ah and 50 Ah - Year-over-year growth 2025-2030 (%)

9.4 Below 20 Ah - Market size and forecast 2025-2030

Chart on Below 20 Ah - Market size and forecast 2025-2030 ($ million)
Data Table on Below 20 Ah - Market size and forecast 2025-2030 ($ million)
Chart on Below 20 Ah - Year-over-year growth 2025-2030 (%)
Data Table on Below 20 Ah - Year-over-year growth 2025-2030 (%)

9.5 Above 50 Ah - Market size and forecast 2025-2030

Chart on Above 50 Ah - Market size and forecast 2025-2030 ($ million)
Data Table on Above 50 Ah - Market size and forecast 2025-2030 ($ million)
Chart on Above 50 Ah - Year-over-year growth 2025-2030 (%)
Data Table on Above 50 Ah - Year-over-year growth 2025-2030 (%)

9.6 Market opportunity by Capacity

Market opportunity by Capacity ($ million)
Data Table on Market opportunity by Capacity ($ million)

10. Market Segmentation by Power Output

10.1 Market segments

Chart on Power Output - Market share 2025-2030 (%)
Data Table on Power Output - Market share 2025-2030 (%)

10.2 Comparison by Power Output

Chart on Comparison by Power Output
Data Table on Comparison by Power Output

10.3 48 V - Market size and forecast 2025-2030

Chart on 48 V - Market size and forecast 2025-2030 ($ million)
Data Table on 48 V - Market size and forecast 2025-2030 ($ million)
Chart on 48 V - Year-over-year growth 2025-2030 (%)
Data Table on 48 V - Year-over-year growth 2025-2030 (%)

10.4 36 V - Market size and forecast 2025-2030

Chart on 36 V - Market size and forecast 2025-2030 ($ million)
Data Table on 36 V - Market size and forecast 2025-2030 ($ million)
Chart on 36 V - Year-over-year growth 2025-2030 (%)
Data Table on 36 V - Year-over-year growth 2025-2030 (%)

10.5 24 V - Market size and forecast 2025-2030

Chart on 24 V - Market size and forecast 2025-2030 ($ million)
Data Table on 24 V - Market size and forecast 2025-2030 ($ million)
Chart on 24 V - Year-over-year growth 2025-2030 (%)
Data Table on 24 V - Year-over-year growth 2025-2030 (%)

10.6 Others - Market size and forecast 2025-2030

Chart on Others - Market size and forecast 2025-2030 ($ million)
Data Table on Others - Market size and forecast 2025-2030 ($ million)
Chart on Others - Year-over-year growth 2025-2030 (%)
Data Table on Others - Year-over-year growth 2025-2030 (%)

10.7 Market opportunity by Power Output

Market opportunity by Power Output ($ million)
Data Table on Market opportunity by Power Output ($ million)

11. Customer Landscape

11.1 Customer landscape overview

Analysis of price sensitivity, lifecycle, customer purchase basket, adoption rates, and purchase criteria

12. Geographic Landscape

12.1 Geographic segmentation

Chart on Market share by geography 2025-2030 (%)
Data Table on Market share by geography 2025-2030 (%)

12.2 Geographic comparison

Chart on Geographic comparison
Data Table on Geographic comparison

12.3 APAC - Market size and forecast 2025-2030

Chart on APAC - Market size and forecast 2025-2030 ($ million)
Data Table on APAC - Market size and forecast 2025-2030 ($ million)
Chart on APAC - Year-over-year growth 2025-2030 (%)
Data Table on APAC - Year-over-year growth 2025-2030 (%)
Chart on Regional Comparison - APAC
Data Table on Regional Comparison - APAC

12.3.1 China - Market size and forecast 2025-2030

Chart on China - Market size and forecast 2025-2030 ($ million)
Data Table on China - Market size and forecast 2025-2030 ($ million)
Chart on China - Year-over-year growth 2025-2030 (%)
Data Table on China - Year-over-year growth 2025-2030 (%)

12.3.2 India - Market size and forecast 2025-2030

Chart on India - Market size and forecast 2025-2030 ($ million)
Data Table on India - Market size and forecast 2025-2030 ($ million)
Chart on India - Year-over-year growth 2025-2030 (%)
Data Table on India - Year-over-year growth 2025-2030 (%)

12.3.3 Indonesia - Market size and forecast 2025-2030

Chart on Indonesia - Market size and forecast 2025-2030 ($ million)
Data Table on Indonesia - Market size and forecast 2025-2030 ($ million)
Chart on Indonesia - Year-over-year growth 2025-2030 (%)
Data Table on Indonesia - Year-over-year growth 2025-2030 (%)

12.3.4 Japan - Market size and forecast 2025-2030

Chart on Japan - Market size and forecast 2025-2030 ($ million)
Data Table on Japan - Market size and forecast 2025-2030 ($ million)
Chart on Japan - Year-over-year growth 2025-2030 (%)
Data Table on Japan - Year-over-year growth 2025-2030 (%)

12.3.5 South Korea - Market size and forecast 2025-2030

Chart on South Korea - Market size and forecast 2025-2030 ($ million)
Data Table on South Korea - Market size and forecast 2025-2030 ($ million)
Chart on South Korea - Year-over-year growth 2025-2030 (%)
Data Table on South Korea - Year-over-year growth 2025-2030 (%)

12.3.6 Australia - Market size and forecast 2025-2030

Chart on Australia - Market size and forecast 2025-2030 ($ million)
Data Table on Australia - Market size and forecast 2025-2030 ($ million)
Chart on Australia - Year-over-year growth 2025-2030 (%)
Data Table on Australia - Year-over-year growth 2025-2030 (%)

12.4 Europe - Market size and forecast 2025-2030

Chart on Europe - Market size and forecast 2025-2030 ($ million)
Data Table on Europe - Market size and forecast 2025-2030 ($ million)
Chart on Europe - Year-over-year growth 2025-2030 (%)
Data Table on Europe - Year-over-year growth 2025-2030 (%)
Chart on Regional Comparison - Europe
Data Table on Regional Comparison - Europe

12.4.1 Germany - Market size and forecast 2025-2030

Chart on Germany - Market size and forecast 2025-2030 ($ million)
Data Table on Germany - Market size and forecast 2025-2030 ($ million)
Chart on Germany - Year-over-year growth 2025-2030 (%)
Data Table on Germany - Year-over-year growth 2025-2030 (%)

12.4.2 UK - Market size and forecast 2025-2030

Chart on UK - Market size and forecast 2025-2030 ($ million)
Data Table on UK - Market size and forecast 2025-2030 ($ million)
Chart on UK - Year-over-year growth 2025-2030 (%)
Data Table on UK - Year-over-year growth 2025-2030 (%)

12.4.3 France - Market size and forecast 2025-2030

Chart on France - Market size and forecast 2025-2030 ($ million)
Data Table on France - Market size and forecast 2025-2030 ($ million)
Chart on France - Year-over-year growth 2025-2030 (%)
Data Table on France - Year-over-year growth 2025-2030 (%)

12.4.4 Italy - Market size and forecast 2025-2030

Chart on Italy - Market size and forecast 2025-2030 ($ million)
Data Table on Italy - Market size and forecast 2025-2030 ($ million)
Chart on Italy - Year-over-year growth 2025-2030 (%)
Data Table on Italy - Year-over-year growth 2025-2030 (%)

12.4.5 Spain - Market size and forecast 2025-2030

Chart on Spain - Market size and forecast 2025-2030 ($ million)
Data Table on Spain - Market size and forecast 2025-2030 ($ million)
Chart on Spain - Year-over-year growth 2025-2030 (%)
Data Table on Spain - Year-over-year growth 2025-2030 (%)

12.4.6 The Netherlands - Market size and forecast 2025-2030

Chart on The Netherlands - Market size and forecast 2025-2030 ($ million)
Data Table on The Netherlands - Market size and forecast 2025-2030 ($ million)
Chart on The Netherlands - Year-over-year growth 2025-2030 (%)
Data Table on The Netherlands - Year-over-year growth 2025-2030 (%)

12.5 North America - Market size and forecast 2025-2030

Chart on North America - Market size and forecast 2025-2030 ($ million)
Data Table on North America - Market size and forecast 2025-2030 ($ million)
Chart on North America - Year-over-year growth 2025-2030 (%)
Data Table on North America - Year-over-year growth 2025-2030 (%)
Chart on Regional Comparison - North America
Data Table on Regional Comparison - North America

12.5.1 US - Market size and forecast 2025-2030

Chart on US - Market size and forecast 2025-2030 ($ million)
Data Table on US - Market size and forecast 2025-2030 ($ million)
Chart on US - Year-over-year growth 2025-2030 (%)
Data Table on US - Year-over-year growth 2025-2030 (%)

12.5.2 Canada - Market size and forecast 2025-2030

Chart on Canada - Market size and forecast 2025-2030 ($ million)
Data Table on Canada - Market size and forecast 2025-2030 ($ million)
Chart on Canada - Year-over-year growth 2025-2030 (%)
Data Table on Canada - Year-over-year growth 2025-2030 (%)

12.5.3 Mexico - Market size and forecast 2025-2030

Chart on Mexico - Market size and forecast 2025-2030 ($ million)
Data Table on Mexico - Market size and forecast 2025-2030 ($ million)
Chart on Mexico - Year-over-year growth 2025-2030 (%)
Data Table on Mexico - Year-over-year growth 2025-2030 (%)

12.6 South America - Market size and forecast 2025-2030

Chart on South America - Market size and forecast 2025-2030 ($ million)
Data Table on South America - Market size and forecast 2025-2030 ($ million)
Chart on South America - Year-over-year growth 2025-2030 (%)
Data Table on South America - Year-over-year growth 2025-2030 (%)
Chart on Regional Comparison - South America
Data Table on Regional Comparison - South America

12.6.1 Brazil - Market size and forecast 2025-2030

Chart on Brazil - Market size and forecast 2025-2030 ($ million)
Data Table on Brazil - Market size and forecast 2025-2030 ($ million)
Chart on Brazil - Year-over-year growth 2025-2030 (%)
Data Table on Brazil - Year-over-year growth 2025-2030 (%)

12.6.2 Argentina - Market size and forecast 2025-2030

Chart on Argentina - Market size and forecast 2025-2030 ($ million)
Data Table on Argentina - Market size and forecast 2025-2030 ($ million)
Chart on Argentina - Year-over-year growth 2025-2030 (%)
Data Table on Argentina - Year-over-year growth 2025-2030 (%)

12.6.3 Colombia - Market size and forecast 2025-2030

Chart on Colombia - Market size and forecast 2025-2030 ($ million)
Data Table on Colombia - Market size and forecast 2025-2030 ($ million)
Chart on Colombia - Year-over-year growth 2025-2030 (%)
Data Table on Colombia - Year-over-year growth 2025-2030 (%)

12.7 Middle East and Africa - Market size and forecast 2025-2030

Chart on Middle East and Africa - Market size and forecast 2025-2030 ($ million)
Data Table on Middle East and Africa - Market size and forecast 2025-2030 ($ million)
Chart on Middle East and Africa - Year-over-year growth 2025-2030 (%)
Data Table on Middle East and Africa - Year-over-year growth 2025-2030 (%)
Chart on Regional Comparison - Middle East and Africa
Data Table on Regional Comparison - Middle East and Africa

12.7.1 Turkey - Market size and forecast 2025-2030

Chart on Turkey - Market size and forecast 2025-2030 ($ million)
Data Table on Turkey - Market size and forecast 2025-2030 ($ million)
Chart on Turkey - Year-over-year growth 2025-2030 (%)
Data Table on Turkey - Year-over-year growth 2025-2030 (%)

12.7.2 South Africa - Market size and forecast 2025-2030

Chart on South Africa - Market size and forecast 2025-2030 ($ million)
Data Table on South Africa - Market size and forecast 2025-2030 ($ million)
Chart on South Africa - Year-over-year growth 2025-2030 (%)
Data Table on South Africa - Year-over-year growth 2025-2030 (%)

12.7.3 UAE - Market size and forecast 2025-2030

Chart on UAE - Market size and forecast 2025-2030 ($ million)
Data Table on UAE - Market size and forecast 2025-2030 ($ million)
Chart on UAE - Year-over-year growth 2025-2030 (%)
Data Table on UAE - Year-over-year growth 2025-2030 (%)

12.7.4 Israel - Market size and forecast 2025-2030

Chart on Israel - Market size and forecast 2025-2030 ($ million)
Data Table on Israel - Market size and forecast 2025-2030 ($ million)
Chart on Israel - Year-over-year growth 2025-2030 (%)
Data Table on Israel - Year-over-year growth 2025-2030 (%)

12.7.5 Saudi Arabia - Market size and forecast 2025-2030

Chart on Saudi Arabia - Market size and forecast 2025-2030 ($ million)
Data Table on Saudi Arabia - Market size and forecast 2025-2030 ($ million)
Chart on Saudi Arabia - Year-over-year growth 2025-2030 (%)
Data Table on Saudi Arabia - Year-over-year growth 2025-2030 (%)

12.8 Market opportunity by geography

Market opportunity by geography ($ million)
Data Tables on Market opportunity by geography ($ million)

13. Drivers, Challenges, and Opportunity

13.1 Market drivers

Supply chain volatility and geopolitical dependencies on critical raw materials
Battery safety, standardization, and regulatory scrutiny
Inadequate charging infrastructure and end-of-life management

13.2 Market challenges

Increasingly stringent environmental regulations and supportive government policies
Continuous advancements in battery technology and cost reduction
Proliferation of shared micro-mobility services and accelerating urbanization

13.3 Impact of drivers and challenges

Impact of drivers and challenges in 2025 and 2030

13.4 Market opportunities

Emergence of alternative battery chemistries beyond lithium-ion
Integration of smart technologies and battery-as-a-service (baas) models
Intensified focus on sustainability and circular economy

14. Competitive Landscape

14.1 Overview

14.2

Overview on criticality of inputs and factors of differentiation

14.3 Landscape disruption

Overview on factors of disruption

14.4 Industry risks

Impact of key risks on business

15. Competitive Analysis

15.1 Companies profiled

Companies covered

15.2 Company ranking index

15.3 Market positioning of companies

Matrix on companies position and classification

15.4 A123 Systems LLC

A123 Systems LLC - Overview
A123 Systems LLC - Product / Service
A123 Systems LLC - Key offerings
SWOT

15.5 Amperex Technology Ltd.

Amperex Technology Ltd. - Overview
Amperex Technology Ltd. - Product / Service
Amperex Technology Ltd. - Key offerings
SWOT

15.6 BYD Co. Ltd.

BYD Co. Ltd. - Overview
BYD Co. Ltd. - Business segments
BYD Co. Ltd. - Key news
BYD Co. Ltd. - Key offerings
BYD Co. Ltd. - Segment focus
SWOT

15.7 Contemporary Amperex Ltd.

Contemporary Amperex Ltd. - Overview
Contemporary Amperex Ltd. - Product / Service
Contemporary Amperex Ltd. - Key news
Contemporary Amperex Ltd. - Key offerings
SWOT

15.8 EVE Energy Co. Ltd.

EVE Energy Co. Ltd. - Overview
EVE Energy Co. Ltd. - Product / Service
EVE Energy Co. Ltd. - Key offerings
SWOT

15.9 Exide Technologies

Exide Technologies - Overview
Exide Technologies - Product / Service
Exide Technologies - Key offerings
SWOT

15.10 GS Yuasa International Ltd.

GS Yuasa International Ltd. - Overview
GS Yuasa International Ltd. - Business segments
GS Yuasa International Ltd. - Key news
GS Yuasa International Ltd. - Key offerings
GS Yuasa International Ltd. - Segment focus
SWOT

15.11 Johnson Controls International

Johnson Controls International - Overview
Johnson Controls International - Business segments
Johnson Controls International - Key news
Johnson Controls International - Key offerings
Johnson Controls International - Segment focus
SWOT

15.12 LG Chem Ltd.

LG Chem Ltd. - Overview
LG Chem Ltd. - Business segments
LG Chem Ltd. - Key news
LG Chem Ltd. - Key offerings
LG Chem Ltd. - Segment focus
SWOT

15.13 Microvast Holdings Inc.

Microvast Holdings Inc. - Overview
Microvast Holdings Inc. - Product / Service
Microvast Holdings Inc. - Key offerings
SWOT

15.14 Panasonic Holdings Corp.

Panasonic Holdings Corp. - Overview
Panasonic Holdings Corp. - Business segments
Panasonic Holdings Corp. - Key news
Panasonic Holdings Corp. - Key offerings
Panasonic Holdings Corp. - Segment focus
SWOT

15.15 Resonac Holdings Corp.

Resonac Holdings Corp. - Overview
Resonac Holdings Corp. - Business segments
Resonac Holdings Corp. - Key news
Resonac Holdings Corp. - Key offerings
Resonac Holdings Corp. - Segment focus
SWOT

15.16 Samsung SDI Co. Ltd.

Samsung SDI Co. Ltd. - Overview
Samsung SDI Co. Ltd. - Business segments
Samsung SDI Co. Ltd. - Key news
Samsung SDI Co. Ltd. - Key offerings
Samsung SDI Co. Ltd. - Segment focus
SWOT

15.17 Toshiba Corp.

Toshiba Corp. - Overview
Toshiba Corp. - Business segments
Toshiba Corp. - Key news
Toshiba Corp. - Key offerings
Toshiba Corp. - Segment focus
SWOT

15.18 VARTA AG

VARTA AG - Overview
VARTA AG - Business segments
VARTA AG - Key offerings
VARTA AG - Segment focus
SWOT

16. Appendix

16.1 Scope of the report

Market definition
Objectives
Notes and caveats

16.2 Inclusions and exclusions checklist

Inclusions checklist
Exclusions checklist

16.3 Currency conversion rates for US$

16.4 Research methodology

16.5 Data procurement

Information sources

16.6 Data validation

16.7 Validation techniques employed for market sizing

16.8 Data synthesis

16.9 360 degree market analysis

16.10 List of abbreviations

Research Methodology

Technavio presents a detailed picture of the market by way of study, synthesis, and summation of data from multiple sources. The analysts have presented the various facets of the market with a particular focus on identifying the key industry influencers. The data thus presented is comprehensive, reliable, and the result of extensive research, both primary and secondary.

INFORMATION SOURCES

Primary sources

  • Manufacturers and suppliers
  • Channel partners
  • Industry experts
  • Strategic decision makers

Secondary sources

  • Industry journals and periodicals
  • Government data
  • Financial reports of key industry players
  • Historical data
  • Press releases

DATA ANALYSIS

Data Synthesis

  • Collation of data
  • Estimation of key figures
  • Analysis of derived insights

Data Validation

  • Triangulation with data models
  • Reference against proprietary databases
  • Corroboration with industry experts

REPORT WRITING

Qualitative

  • Market drivers
  • Market challenges
  • Market trends
  • Five forces analysis

Quantitative

  • Market size and forecast
  • Market segmentation
  • Geographical insights
  • Competitive landscape

Interested in this report?

Get your sample now to see our research methodology and insights!

Download Now

Frequently Asked Questions

Electric Scooter Battery market growth will increase by USD 19832.5 million during 2026-2030 .

The Electric Scooter Battery market is expected to grow at a CAGR of 17.1% during 2026-2030 .

Electric Scooter Battery market is segmented by Battery type (Lithium ion, Lead acid, Nickel metal hydride, Others) Capacity (Between 20 Ah and 50 Ah, Below 20 Ah, Above 50 Ah) Power output (48 V, 36 V, 24 V, Others)

A123 Systems LLC, Amperex Technology Ltd., Ather Energy Pvt. Ltd., BYD Co. Ltd., Contemporary Amperex Ltd., EVE Energy Co. Ltd., Exide Technologies, GS Yuasa International Ltd., Johnson Controls International, LG Chem Ltd., Microvast Holdings Inc., Panasonic Holdings Corp., Resonac Holdings Corp., Samsung SDI Co. Ltd., Toshiba Corp., VARTA AG are a few of the key vendors in the Electric Scooter Battery market.

APAC will register the highest growth rate of 86.1% among the other regions. Therefore, the Electric Scooter Battery market in APAC is expected to garner significant business opportunities for the vendors during the forecast period.

China, India, Indonesia, Japan, South Korea, Australia, Germany, UK, France, Italy, Spain, The Netherlands, US, Canada, Mexico, Brazil, Argentina, Colombia, Turkey, South Africa, UAE, Israel, Saudi Arabia

  • Supply chain volatility and geopolitical dependencies on critical raw materials is the driving factor this market.

The Electric Scooter Battery market vendors should focus on grabbing business opportunities from the Battery type segment as it accounted for the largest market share in the base year.