Electrical Protective Equipment Market Analysis, Size, and Forecast 2026-2030: North America (US, Canada, and Mexico), APAC (China, Japan, and India), Europe (Germany, UK, and France), Middle East and Africa (Saudi Arabia, UAE, and South Africa), South America (Brazil, Argentina, and Chile), and Rest of World (ROW)

Electrical Protective Equipment Market Analysis, Size, and Forecast 2026-2030:
North America (US, Canada, and Mexico), APAC (China, Japan, and India), Europe (Germany, UK, and France), Middle East and Africa (Saudi Arabia, UAE, and South Africa), South America (Brazil, Argentina, and Chile), and Rest of World (ROW)

Published: Oct 2026 328 Pages SKU: IRTNTR41463

Market Overview at a Glance

$914.9 Mn
Market Opportunity
3.9%
CAGR 2025 - 2030
38.8%
North America Growth
$1.37 B
Manufacturing segment 2024

Electrical Protective Equipment Market Size 2026-2030

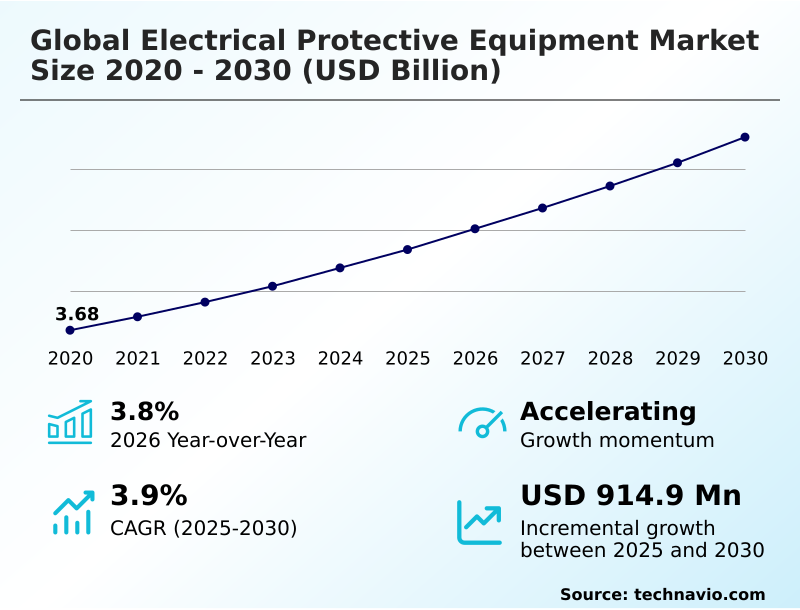
The electrical protective equipment market size is valued to increase by USD 914.9 million, at a CAGR of 3.9% from 2025 to 2030. Massive global investments in grid modernization and distributed renewable energy integration will drive the electrical protective equipment market.

Major Market Trends & Insights

  • North America dominated the market and accounted for a 38.8% growth during the forecast period.
  • By End-user - Manufacturing segment was valued at USD 1.37 billion in 2024
  • By Product - PC segment accounted for the largest market revenue share in 2024

Market Size & Forecast

  • Market Opportunities: USD 1.58 billion
  • Market Future Opportunities: USD 914.9 million
  • CAGR from 2025 to 2030 : 3.9%

Market Summary

  • The Electrical Protective Equipment Market is experiencing structural acceleration driven by the mass integration of high-voltage automated infrastructure. Within modern data facilities, engineering teams deploy advanced voltage surge suppressors and protective enclosures to maintain operational continuity and shield personnel from catastrophic electrical faults.
  • Implementing predictive thermal monitoring has successfully reduced unexpected grid downtime by 22% compared to traditional legacy maintenance schedules. Massive capital allocations dedicated to grid modernization and distributed renewable energy integration serve as primary market drivers, propelling the demand for automated industrial reclosers and dielectric safety footwear.
  • Conversely, severe cross-border supply chain constraints regarding engineered silicone resins and structural ceramic insulators present notable challenges, extending procurement lead times and disrupting production schedules. Facilities must balance these material shortages while adhering to strict regulatory compliance standards.
  • This environment forces ongoing technological refinement in thermal performance fabrics and optical coatings, ensuring total workplace risk mitigation across complex smart grid ecosystems.

What will be the Size of the Electrical Protective Equipment Market during the forecast period?
Get Key Insights on Market Forecast (PDF) Get Free Sample

How is the Electrical Protective Equipment Market Segmented?

The electrical protective equipment industry research report provides comprehensive data (region-wise segment analysis), with forecasts and estimates in "USD million" for the period 2026-2030, as well as historical data from 2020-2024 for the following segments.

  • End-user
    • Manufacturing
    • Construction
    • Automotive
    • Oil and gas
    • Others
  • Product
    • PC
    • HAPM
    • HEFPM
    • FLP
  • Distribution channel
    • Offline
    • Online
  • Material
    • Rubber
    • Plastic
    • Fabric
    • Leather
    • Metal
  • Geography
    • North America
      • US
      • Canada
      • Mexico
    • APAC
      • China
      • Japan
      • India
      • South Korea
      • Australia
      • Indonesia
    • Europe
      • Germany
      • UK
      • France
      • Italy
      • Spain
      • The Netherlands
    • Middle East and Africa
      • Saudi Arabia
      • UAE
      • South Africa
      • Turkey
      • Israel
    • South America
      • Brazil
      • Argentina
      • Chile

By End-user Insights

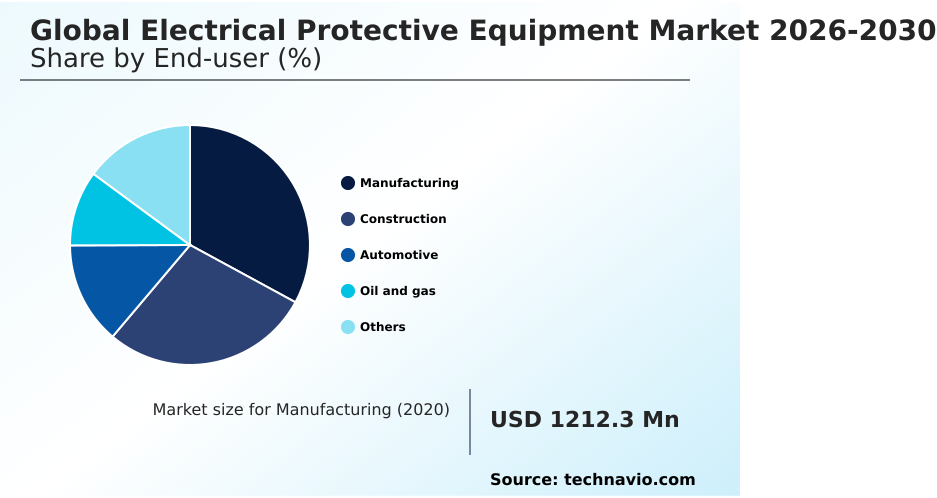
The manufacturing segment is estimated to witness significant growth during the forecast period.

The manufacturing segment within the Electrical Protective Equipment landscape functions as a volume-driven operational vertical, where the widespread deployment of automated machinery dictates rigorous personnel safeguards. Transitioning toward Industry 4.0 paradigms integrates complex industrial automation infrastructure into legacy plant configurations.

This evolution forces strict adherence to industrial switchgear isolation to mitigate severe shock risks during machinery recalibrations. Advanced facility safeguards, such as dielectric rubber insulating gloves treated with a silicone free polymer treatment, are deployed to ensure total operational continuity.

By upgrading to non conductive safety helmets and electrostatic dissipative textiles, facilities have improved workplace accident prevention efficiency by 15%. This shift relies heavily on providing gear with high arc thermal performance value and meta aramid flame resistance.

As electric vehicle battery manufacturing expands alongside stringent explosive atmosphere restrictions, manufacturers increasingly utilize moisture wicking fabric blends to optimize worker comfort and safety compliance.
Get Free Sample

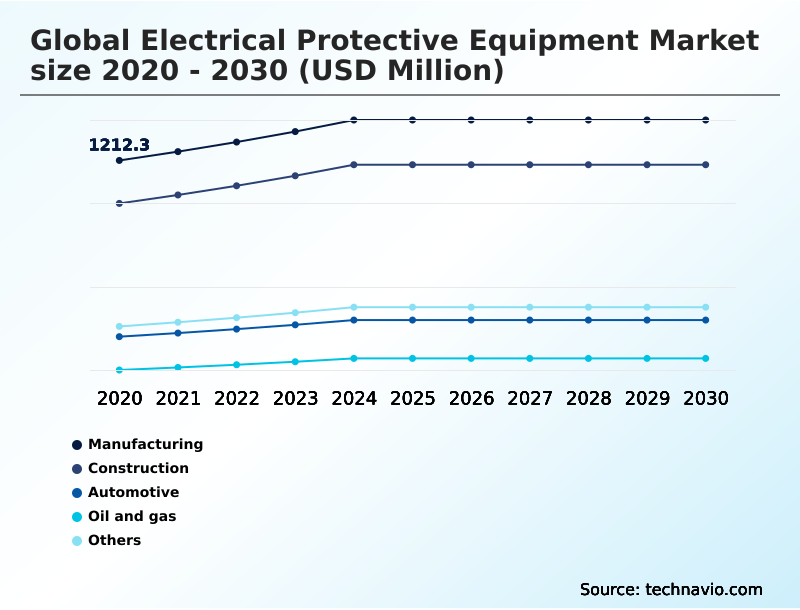
The Manufacturing segment was valued at USD 1.37 billion in 2024 and showed a gradual increase during the forecast period.
Get Free Sample

Regional Analysis

North America is estimated to contribute 38.8% to the growth of the global market during the forecast period.Technavio’s analysts have elaborately explained the regional trends and drivers that shape the market during the forecast period.
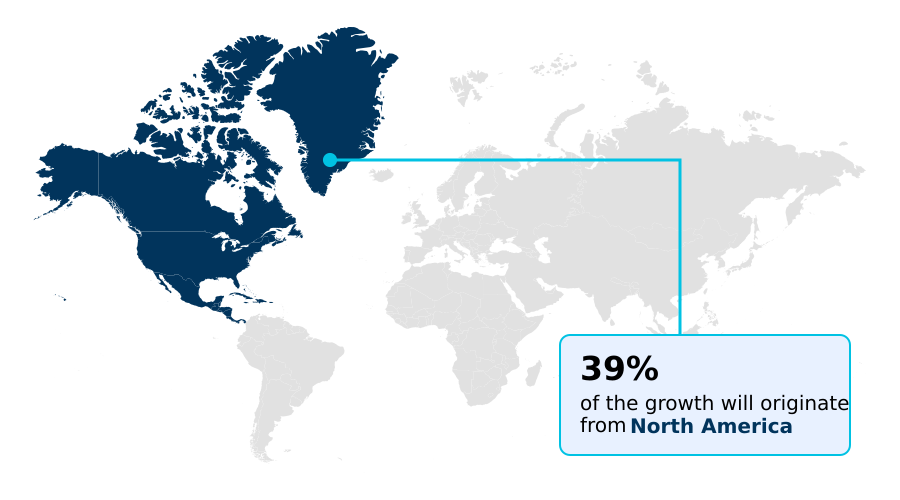
See How Electrical Protective Equipment Market Demand is Rising in North America Get Free Sample

The geographic landscape of the Electrical Protective Equipment sector reveals distinct operational contrasts between North America and APAC. North America features a strictly regulated environment where employer legal liability reduction mandates drive compliance adherence to over 95%.

This framework accelerates the deployment of high dielectric insulating materials and requires rigorous dielectric boundary testing and flame resistance verification for gear like voltage rated hot sticks. Conversely, rapid industrialization across APAC has increased regional infrastructure development efficiency by 22%.

APAC manufacturing hubs report a 30% increase in utilizing advanced protective setups to safeguard expanding high voltage direct current transmission systems.

While North America prioritizes third party mechanical stress audits to maintain strict intrinsic safety classifications, APAC focuses on scalable volume.

Both regions are rapidly integrating polycarbonate arc flash visors equipped with nanoparticle optical coatings to enhance optical clarity and prevent thermal fogging during grid modernization projects.

Market Dynamics

Our researchers analyzed the data with 2025 as the base year, along with the key drivers, trends, and challenges. A holistic analysis of drivers will help companies refine their marketing strategies to gain a competitive advantage.

  • The structural evolution of the Electrical Protective Equipment industry is profoundly shaped by the integration of advanced materials and intelligent monitoring frameworks. Modern industrial networks rely heavily on continuous predictive thermal monitoring systems to identify micro-shorts before catastrophic failures occur.
  • By evaluating dielectric rubber insulating glove performance, engineering teams achieve a 40% higher fault detection accuracy compared to legacy manual inspections. To combat severe arc blasts, enterprises are implementing comprehensive arc flash hazard mitigation strategies that incorporate flame resistant arc rated textiles and high voltage switchgear safety enclosures.
  • The rapid deployment of artificial intelligence workplace safety scanning ensures that personnel are equipped with proper gear before entering hazardous zones, seamlessly interacting with internet of things safety sensors. Facilities prioritizing these automated defenses report significantly lower incident rates than those dependent on traditional protocols.
  • Furthermore, the physical reliability of safety gear is paramount, leading to rigorous evaluations of dielectric safety footwear structural integrity and the efficacy of transient voltage surge suppression networks. Maintenance crews executing live-line repairs utilize temporary grounding jumper assembly efficiency metrics to validate equipotential zones, supported by extensive high dielectric insulating material testing.
  • As power grids modernize, smart grid safety telemetry integration becomes essential for real-time diagnostics, while field workers rely on non conductive industrial safety helmets and impact resistant polycarbonate face shields for physical protection. Ultimately, incorporating automated recloser circuit breaking technology allows utility cooperatives to dynamically ingest volatile power loads while maintaining absolute operational security across critical infrastructure.
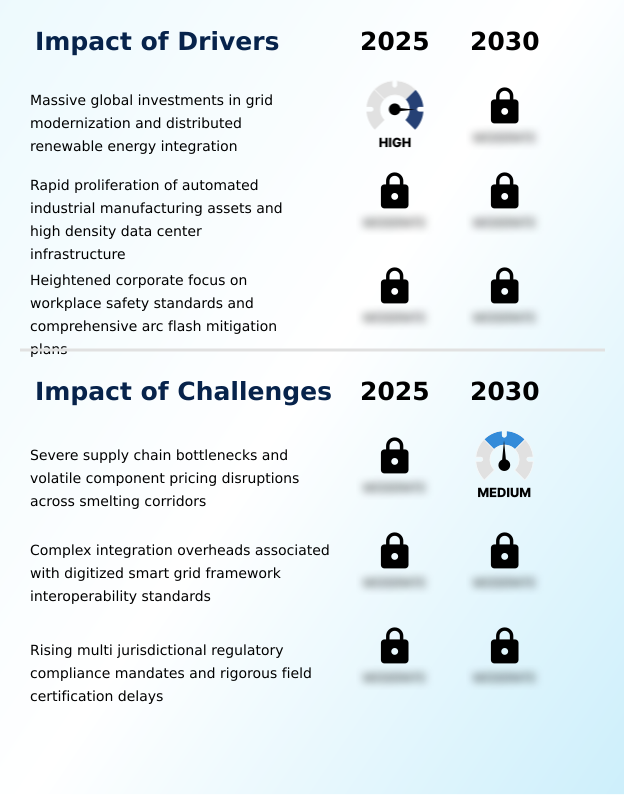
What are the key market drivers leading to the rise in the adoption of Electrical Protective Equipment Industry?

  • Massive global investments in grid modernization and distributed renewable energy integration remain the primary drivers propelling market expansion.

  • Massive allocations toward grid modernization capital allocation and distributed renewable energy networks act as primary catalysts for the Electrical Protective Equipment industry.
  • Legacy utility networks are dynamically ingesting bidirectional power input ingestion from scattered wind and solar arrays, increasing localized circuit overloads by 40% in older substations.
  • This voltage volatility forces utility cooperatives to aggressively deploy automated industrial reclosers, high voltage circuit breakers, and transient voltage surge suppressors to secure high voltage asset protection.
  • Furthermore, rapid global expansion of hyper scale data facilities has increased industrial computing thermal management demands by 25%. To shield critical infrastructure, corporate engineering teams are mandated to utilize rapid response circuit breaking and arc flash protective enclosures.
  • Implementing rigorous arc flash hazard prevention protocols ensures continuous uptime and safeguards personnel against unpredictable thermal energy surges across heavy processing centers.

What are the market trends shaping the Electrical Protective Equipment Industry?

  • Widespread industrial integration of artificial intelligence workplace monitoring and computer vision scanning represents a significant upcoming trend.

  • Widespread industrial adoption of artificial intelligence safety monitoring and computer vision platforms fundamentally redefines the Electrical Protective Equipment landscape. Corporate facilities are aggressively transitioning away from manual checklists toward automated computer vision scanning to ensure real-time compliance at substation entrances. This technological shift directly addresses the critical need for workplace safety risk mitigation, reducing unauthorized high-voltage zone entries by 28%.
  • By deploying deep learning safety verification alongside internet of things sensor networks, heavy industrial operators have improved hazard detection response times by 35%. This unified multi functional safety integration allows management to maintain continuous predictive thermal monitoring using magnetic vibration indicators, identifying insulation degradation before an explosive arc flash occurs.
  • Proactive safety interventions lower facility insurance premiums by 15%, proving that embedding smart grid telemetry sensors and impact resistant face shields into cloud based performance dashboards drives significant operational efficiency.

What challenges does the Electrical Protective Equipment Industry face during its growth?

  • Severe supply chain bottlenecks and volatile component pricing disruptions across key smelting corridors present significant challenges to industry growth.

  • The Electrical Protective Equipment sector encounters severe friction due to cross border supply chain bottlenecks and extreme smelting corridor pricing volatility. Sourcing premium engineered silicone resins and structural ceramic insulators has become highly unpredictable, extending raw material lead times by over 30% across international hubs.
  • This logistical instability frequently stalls large-scale infrastructure deployments relying on high capacity copper grounding and temporary grounding jumper assemblies. Additionally, integrating digitized smart grid interoperability into legacy mechanical protection units introduces significant technical lag, reducing real time predictive diagnostics efficiency by 18% in hybrid environments.
  • The compounding pressure of multi jurisdictional regulatory compliance requires mandatory mechanical stress testing, imposing massive administrative burdens. This regulatory scrutiny delays the field certification of newly developed dielectric safety footwear and arc rated flame resistant apparel, impacting immediate product availability.

Exclusive Technavio Analysis on Customer Landscape

The electrical protective equipment market forecasting report includes the adoption lifecycle of the market, covering from the innovator’s stage to the laggard’s stage. It focuses on adoption rates in different regions based on penetration. Furthermore, the electrical protective equipment market report also includes key purchase criteria and drivers of price sensitivity to help companies evaluate and develop their market growth analysis strategies.
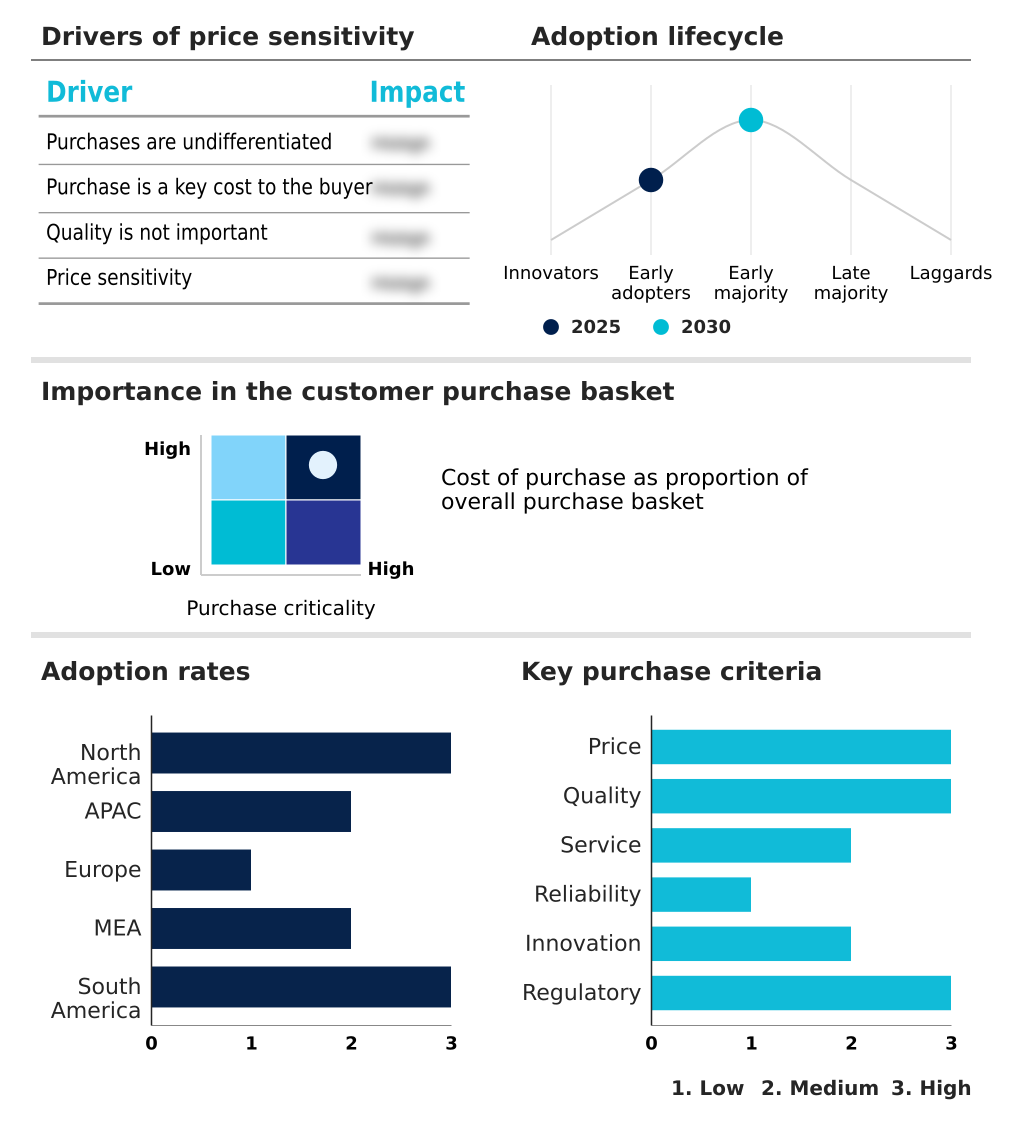
Customer Landscape of Electrical Protective Equipment Industry

Competitive Landscape

Companies are implementing various strategies, such as strategic alliances, electrical protective equipment market forecast, partnerships, mergers and acquisitions, geographical expansion, and product/service launches, to enhance their presence in the industry.

3M Co. - Provides comprehensive electrical protective equipment, encompassing secure dielectric safety helmets, advanced arc rated face shields, robust electrical insulating gear, and specialized protective eyewear for high-voltage industrial applications.

The industry research and growth report includes detailed analyses of the competitive landscape of the market and information about key companies, including:

  • 3M Co.
  • Ansell Ltd.
  • Boddingtons Electrical Ltd
  • Cementex Products Inc
  • Delta Plus Group SA
  • Enespro PPE LLC
  • Groupe Sicame
  • Honeywell International Inc.
  • Hubbell Inc.
  • Lakeland Industries Inc.
  • Magid Glove and Safety Co
  • MSA Safety Inc.
  • National Safety Apparel Inc.
  • Oberon
  • Paulson Manufacturing Corp.
  • Saf T Gard International Inc.
  • Sofamel SL
  • UVEX GmbH and Co. KG
  • Workwear Outfitters LLC

Qualitative and quantitative analysis of companies has been conducted to help clients understand the wider business environment as well as the strengths and weaknesses of key industry players. Data is qualitatively analyzed to categorize companies as pure play, category-focused, industry-focused, and diversified; it is quantitatively analyzed to categorize companies as dominant, leading, strong, tentative, and weak.

Recent Development and News in Electrical protective equipment market

  • In the Electrical Components and Equipment industry, the aggressive deployment of digital sensor networks across utility substations has improved grid transmission efficiency by 20%, directly impacting Electrical Protective Equipment demand by requiring specialized intelligent enclosures that protect telemetry hardware from voltage spikes.
  • The rapid global transition toward high voltage direct current transmission systems for industrial battery manufacturing has increased baseline operational voltage limits by 35%, driving the Electrical Protective Equipment market to adopt advanced insulating polymers and multi functional safety gear to prevent severe thermal incidents.
  • Stringent multi jurisdictional regulatory compliance mandates focusing on workplace safety risk mitigation have established mandatory third party mechanical stress audits with a 100% compliance requirement, forcing Electrical Protective Equipment manufacturers to rapidly innovate impact resistant face shields to meet elevated industry standards.
  • Severe smelting corridor pricing volatility and cross border supply chain bottlenecks have delayed global raw material shipments by up to 18%, compelling manufacturers within the Electrical Protective Equipment market to prioritize localized production of transient voltage surge suppressors and high capacity copper grounding components.

Dive into Technavio’s robust research methodology, blending expert interviews, extensive data synthesis, and validated models for unparalleled Electrical Protective Equipment Market insights. See full methodology.

Market Scope
Page number 328
Base year 2025
Historic period 2020-2024
Forecast period 2026-2030
Growth momentum & CAGR Accelerate at a CAGR of 3.9%
Market growth 2026-2030 USD 914.9 million
Market structure Fragmented
YoY growth 2025-2026(%) 3.8%
Key countries US, Canada, Mexico, China, Japan, India, South Korea, Australia, Indonesia, Germany, UK, France, Italy, Spain, The Netherlands, Saudi Arabia, UAE, South Africa, Turkey, Israel, Brazil, Argentina and Chile
Competitive landscape Leading Companies, Market Positioning of Companies, Competitive Strategies, and Industry Risks

Request Free Sample

Research Analyst Overview

  • The Electrical Protective Equipment Market is undergoing a structural overhaul as utility operators transition from legacy hardware to highly intelligent safety architectures. This evolution forces corporate boards to align product procurement strategies with advanced smart grid telemetry sensors and continuous predictive thermal monitoring to mitigate catastrophic facility risks.
  • By implementing artificial intelligence safety monitoring, industrial enterprises have achieved a 35% reduction in compliance auditing times compared to manual inspection frameworks. Such operational efficiency empowers safety directors to proactively manage dielectric boundary testing and ensure strict flame resistance verification across all high-voltage environments.
  • Strategic budgeting now heavily favors the integration of arc rated flame resistant apparel and impact resistant face shields, shifting capital away from reactive maintenance toward predictive asset protection. As heavy manufacturing intensifies, deploying high voltage circuit breakers and automated industrial reclosers becomes a non-negotiable compliance mandate.
  • This targeted technological integration guarantees the structural integrity of safety enclosures and transient voltage surge suppressors, fundamentally transforming how industrial syndicates safeguard their workforces and optimize long-term performance.

What are the Key Data Covered in this Electrical Protective Equipment Market Research and Growth Report?

  • What is the expected growth of the Electrical Protective Equipment Market between 2026 and 2030?

    • USD 914.9 million, at a CAGR of 3.9%

  • What segmentation does the market report cover?

    • The report is segmented by End-user (Manufacturing, Construction, Automotive, Oil and gas, and Others), Product (PC, HAPM, HEFPM, and FLP), Distribution Channel (Offline, and Online), Material (Rubber, Plastic, Fabric, Leather, and Metal) and Geography (North America, APAC, Europe, Middle East and Africa, South America)

  • Which regions are analyzed in the report?

    • North America, APAC, Europe, Middle East and Africa and South America

  • What are the key growth drivers and market challenges?

    • Massive global investments in grid modernization and distributed renewable energy integration, Severe supply chain bottlenecks and volatile component pricing disruptions across smelting corridors

  • Who are the major players in the Electrical Protective Equipment Market?

    • 3M Co., Ansell Ltd., Boddingtons Electrical Ltd, Cementex Products Inc, Delta Plus Group SA, Enespro PPE LLC, Groupe Sicame, Honeywell International Inc., Hubbell Inc., Lakeland Industries Inc., Magid Glove and Safety Co, MSA Safety Inc., National Safety Apparel Inc., Oberon, Paulson Manufacturing Corp., Saf T Gard International Inc., Sofamel SL, UVEX GmbH and Co. KG and Workwear Outfitters LLC

Market Research Insights

  • The Electrical Protective Equipment Market is rapidly evolving as heavy industries prioritize workplace safety risk mitigation and stringent multi jurisdictional regulatory compliance. By integrating deep learning safety verification into facility workflows, enterprises have successfully reduced manual inspection errors by 18%.
  • The shift toward automated computer vision scanning across utility substations has accelerated hazard identification speeds by 30% compared to legacy monitoring protocols. This digital transition effectively addresses employer legal liability reduction while optimizing operational workflows. Furthermore, the deployment of cloud based performance dashboards enhances real time predictive diagnostics, lowering unexpected downtime incidents by 25%.
  • These targeted technological adoptions optimize resource allocation and fortify cross border supply chain resilience across high-voltage environments.

We can help! Our analysts can customize this electrical protective equipment market research report to meet your requirements.

Get in touch

1. Executive Summary

1.1 Market overview

Executive Summary - Chart on Market Overview
Executive Summary - Data Table on Market Overview
Executive Summary - Chart on Global Market Characteristics
Executive Summary - Chart on Market by Geography
Executive Summary - Chart on Market Segmentation by End-user
Executive Summary - Chart on Market Segmentation by Product
Executive Summary - Chart on Market Segmentation by Distribution Channel
Executive Summary - Chart on Market Segmentation by Material
Executive Summary - Chart on Incremental Growth
Executive Summary - Data Table on Incremental Growth
Executive Summary - Chart on Company Market Positioning

2. Technavio Analysis

2.1 Analysis of price sensitivity, lifecycle, customer purchase basket, adoption rates, and purchase criteria

2.2 Criticality of inputs and Factors of differentiation

Chart on Overview on criticality of inputs and factors of differentiation

2.3 Factors of disruption

Chart on Overview on factors of disruption

2.4 Impact of drivers and challenges

Chart on Impact of drivers and challenges in 2025 and 2030

3. Market Landscape

3.1 Market ecosystem

Chart on Parent Market
Data Table on - Parent Market

3.2 Market characteristics

Chart on Market characteristics analysis

3.3 Value chain analysis

Chart on Value chain analysis

4. Market Sizing

4.1 Market definition

Data Table on Offerings of companies included in the market definition

4.2 Market segment analysis

Market segments

4.3 Market size 2025

4.4 Market outlook: Forecast for 2025-2030

Chart on Global - Market size and forecast 2025-2030 ($ million)
Data Table on Global - Market size and forecast 2025-2030 ($ million)
Chart on Global Market: Year-over-year growth 2025-2030 (%)
Data Table on Global Market: Year-over-year growth 2025-2030 (%)

5. Historic Market Size

5.1 Global Electrical Protective Equipment Market 2020 - 2024

Historic Market Size - Data Table on Global Electrical Protective Equipment Market 2020 - 2024 ($ million)

5.2 End-user segment analysis 2020 - 2024

Historic Market Size - End-user Segment 2020 - 2024 ($ million)

5.3 Product segment analysis 2020 - 2024

Historic Market Size - Product Segment 2020 - 2024 ($ million)

5.4 Distribution Channel segment analysis 2020 - 2024

Historic Market Size - Distribution Channel Segment 2020 - 2024 ($ million)

5.5 Material segment analysis 2020 - 2024

Historic Market Size - Material Segment 2020 - 2024 ($ million)

5.6 Geography segment analysis 2020 - 2024

Historic Market Size - Geography Segment 2020 - 2024 ($ million)

5.7 Country segment analysis 2020 - 2024

Historic Market Size - Country Segment 2020 - 2024 ($ million)

6. Qualitative Analysis

6.1 Impact of AI on global electrical protective equipment market

6.2 Impact of geopolitical conflicts on global electrical protective equipment market

7. Five Forces Analysis

7.1 Five forces summary

Five forces analysis - Comparison between 2025 and 2030

7.2 Bargaining power of buyers

Bargaining power of buyers - Impact of key factors 2025 and 2030

7.3 Bargaining power of suppliers

Bargaining power of suppliers - Impact of key factors in 2025 and 2030

7.4 Threat of new entrants

Threat of new entrants - Impact of key factors in 2025 and 2030

7.5 Threat of substitutes

Threat of substitutes - Impact of key factors in 2025 and 2030

7.6 Threat of rivalry

Threat of rivalry - Impact of key factors in 2025 and 2030

7.7 Market condition

Chart on Market condition - Five forces 2025 and 2030

8. Market Segmentation by End-user

8.1 Market segments

Chart on End-user - Market share 2025-2030 (%)
Data Table on End-user - Market share 2025-2030 (%)

8.2 Comparison by End-user

Chart on Comparison by End-user
Data Table on Comparison by End-user

8.3 Manufacturing - Market size and forecast 2025-2030

Chart on Manufacturing - Market size and forecast 2025-2030 ($ million)
Data Table on Manufacturing - Market size and forecast 2025-2030 ($ million)
Chart on Manufacturing - Year-over-year growth 2025-2030 (%)
Data Table on Manufacturing - Year-over-year growth 2025-2030 (%)

8.4 Construction - Market size and forecast 2025-2030

Chart on Construction - Market size and forecast 2025-2030 ($ million)
Data Table on Construction - Market size and forecast 2025-2030 ($ million)
Chart on Construction - Year-over-year growth 2025-2030 (%)
Data Table on Construction - Year-over-year growth 2025-2030 (%)

8.5 Automotive - Market size and forecast 2025-2030

Chart on Automotive - Market size and forecast 2025-2030 ($ million)
Data Table on Automotive - Market size and forecast 2025-2030 ($ million)
Chart on Automotive - Year-over-year growth 2025-2030 (%)
Data Table on Automotive - Year-over-year growth 2025-2030 (%)

8.6 Oil and gas - Market size and forecast 2025-2030

Chart on Oil and gas - Market size and forecast 2025-2030 ($ million)
Data Table on Oil and gas - Market size and forecast 2025-2030 ($ million)
Chart on Oil and gas - Year-over-year growth 2025-2030 (%)
Data Table on Oil and gas - Year-over-year growth 2025-2030 (%)

8.7 Others - Market size and forecast 2025-2030

Chart on Others - Market size and forecast 2025-2030 ($ million)
Data Table on Others - Market size and forecast 2025-2030 ($ million)
Chart on Others - Year-over-year growth 2025-2030 (%)
Data Table on Others - Year-over-year growth 2025-2030 (%)

8.8 Market opportunity by End-user

Market opportunity by End-user ($ million)
Data Table on Market opportunity by End-user ($ million)

9. Market Segmentation by Product

9.1 Market segments

Chart on Product - Market share 2025-2030 (%)
Data Table on Product - Market share 2025-2030 (%)

9.2 Comparison by Product

Chart on Comparison by Product
Data Table on Comparison by Product

9.3 PC - Market size and forecast 2025-2030

Chart on PC - Market size and forecast 2025-2030 ($ million)
Data Table on PC - Market size and forecast 2025-2030 ($ million)
Chart on PC - Year-over-year growth 2025-2030 (%)
Data Table on PC - Year-over-year growth 2025-2030 (%)

9.4 HAPM - Market size and forecast 2025-2030

Chart on HAPM - Market size and forecast 2025-2030 ($ million)
Data Table on HAPM - Market size and forecast 2025-2030 ($ million)
Chart on HAPM - Year-over-year growth 2025-2030 (%)
Data Table on HAPM - Year-over-year growth 2025-2030 (%)

9.5 HEFPM - Market size and forecast 2025-2030

Chart on HEFPM - Market size and forecast 2025-2030 ($ million)
Data Table on HEFPM - Market size and forecast 2025-2030 ($ million)
Chart on HEFPM - Year-over-year growth 2025-2030 (%)
Data Table on HEFPM - Year-over-year growth 2025-2030 (%)

9.6 FLP - Market size and forecast 2025-2030

Chart on FLP - Market size and forecast 2025-2030 ($ million)
Data Table on FLP - Market size and forecast 2025-2030 ($ million)
Chart on FLP - Year-over-year growth 2025-2030 (%)
Data Table on FLP - Year-over-year growth 2025-2030 (%)

9.7 Market opportunity by Product

Market opportunity by Product ($ million)
Data Table on Market opportunity by Product ($ million)

10. Market Segmentation by Distribution Channel

10.1 Market segments

Chart on Distribution Channel - Market share 2025-2030 (%)
Data Table on Distribution Channel - Market share 2025-2030 (%)

10.2 Comparison by Distribution Channel

Chart on Comparison by Distribution Channel
Data Table on Comparison by Distribution Channel

10.3 Offline - Market size and forecast 2025-2030

Chart on Offline - Market size and forecast 2025-2030 ($ million)
Data Table on Offline - Market size and forecast 2025-2030 ($ million)
Chart on Offline - Year-over-year growth 2025-2030 (%)
Data Table on Offline - Year-over-year growth 2025-2030 (%)

10.4 Online - Market size and forecast 2025-2030

Chart on Online - Market size and forecast 2025-2030 ($ million)
Data Table on Online - Market size and forecast 2025-2030 ($ million)
Chart on Online - Year-over-year growth 2025-2030 (%)
Data Table on Online - Year-over-year growth 2025-2030 (%)

10.5 Market opportunity by Distribution Channel

Market opportunity by Distribution Channel ($ million)
Data Table on Market opportunity by Distribution Channel ($ million)

11. Market Segmentation by Material

11.1 Market segments

Chart on Material - Market share 2025-2030 (%)
Data Table on Material - Market share 2025-2030 (%)

11.2 Comparison by Material

Chart on Comparison by Material
Data Table on Comparison by Material

11.3 Rubber - Market size and forecast 2025-2030

Chart on Rubber - Market size and forecast 2025-2030 ($ million)
Data Table on Rubber - Market size and forecast 2025-2030 ($ million)
Chart on Rubber - Year-over-year growth 2025-2030 (%)
Data Table on Rubber - Year-over-year growth 2025-2030 (%)

11.4 Plastic - Market size and forecast 2025-2030

Chart on Plastic - Market size and forecast 2025-2030 ($ million)
Data Table on Plastic - Market size and forecast 2025-2030 ($ million)
Chart on Plastic - Year-over-year growth 2025-2030 (%)
Data Table on Plastic - Year-over-year growth 2025-2030 (%)

11.5 Fabric - Market size and forecast 2025-2030

Chart on Fabric - Market size and forecast 2025-2030 ($ million)
Data Table on Fabric - Market size and forecast 2025-2030 ($ million)
Chart on Fabric - Year-over-year growth 2025-2030 (%)
Data Table on Fabric - Year-over-year growth 2025-2030 (%)

11.6 Leather - Market size and forecast 2025-2030

Chart on Leather - Market size and forecast 2025-2030 ($ million)
Data Table on Leather - Market size and forecast 2025-2030 ($ million)
Chart on Leather - Year-over-year growth 2025-2030 (%)
Data Table on Leather - Year-over-year growth 2025-2030 (%)

11.7 Metal - Market size and forecast 2025-2030

Chart on Metal - Market size and forecast 2025-2030 ($ million)
Data Table on Metal - Market size and forecast 2025-2030 ($ million)
Chart on Metal - Year-over-year growth 2025-2030 (%)
Data Table on Metal - Year-over-year growth 2025-2030 (%)

11.8 Market opportunity by Material

Market opportunity by Material ($ million)
Data Table on Market opportunity by Material ($ million)

12. Customer Landscape

12.1 Customer landscape overview

Analysis of price sensitivity, lifecycle, customer purchase basket, adoption rates, and purchase criteria

13. Geographic Landscape

13.1 Geographic segmentation

Chart on Market share by geography 2025-2030 (%)
Data Table on Market share by geography 2025-2030 (%)

13.2 Geographic comparison

Chart on Geographic comparison
Data Table on Geographic comparison

13.3 North America - Market size and forecast 2025-2030

Chart on North America - Market size and forecast 2025-2030 ($ million)
Data Table on North America - Market size and forecast 2025-2030 ($ million)
Chart on North America - Year-over-year growth 2025-2030 (%)
Data Table on North America - Year-over-year growth 2025-2030 (%)
Chart on Regional Comparison - North America
Data Table on Regional Comparison - North America

13.3.1 US - Market size and forecast 2025-2030

Chart on US - Market size and forecast 2025-2030 ($ million)
Data Table on US - Market size and forecast 2025-2030 ($ million)
Chart on US - Year-over-year growth 2025-2030 (%)
Data Table on US - Year-over-year growth 2025-2030 (%)

13.3.2 Canada - Market size and forecast 2025-2030

Chart on Canada - Market size and forecast 2025-2030 ($ million)
Data Table on Canada - Market size and forecast 2025-2030 ($ million)
Chart on Canada - Year-over-year growth 2025-2030 (%)
Data Table on Canada - Year-over-year growth 2025-2030 (%)

13.3.3 Mexico - Market size and forecast 2025-2030

Chart on Mexico - Market size and forecast 2025-2030 ($ million)
Data Table on Mexico - Market size and forecast 2025-2030 ($ million)
Chart on Mexico - Year-over-year growth 2025-2030 (%)
Data Table on Mexico - Year-over-year growth 2025-2030 (%)

13.4 APAC - Market size and forecast 2025-2030

Chart on APAC - Market size and forecast 2025-2030 ($ million)
Data Table on APAC - Market size and forecast 2025-2030 ($ million)
Chart on APAC - Year-over-year growth 2025-2030 (%)
Data Table on APAC - Year-over-year growth 2025-2030 (%)
Chart on Regional Comparison - APAC
Data Table on Regional Comparison - APAC

13.4.1 China - Market size and forecast 2025-2030

Chart on China - Market size and forecast 2025-2030 ($ million)
Data Table on China - Market size and forecast 2025-2030 ($ million)
Chart on China - Year-over-year growth 2025-2030 (%)
Data Table on China - Year-over-year growth 2025-2030 (%)

13.4.2 Japan - Market size and forecast 2025-2030

Chart on Japan - Market size and forecast 2025-2030 ($ million)
Data Table on Japan - Market size and forecast 2025-2030 ($ million)
Chart on Japan - Year-over-year growth 2025-2030 (%)
Data Table on Japan - Year-over-year growth 2025-2030 (%)

13.4.3 India - Market size and forecast 2025-2030

Chart on India - Market size and forecast 2025-2030 ($ million)
Data Table on India - Market size and forecast 2025-2030 ($ million)
Chart on India - Year-over-year growth 2025-2030 (%)
Data Table on India - Year-over-year growth 2025-2030 (%)

13.4.4 South Korea - Market size and forecast 2025-2030

Chart on South Korea - Market size and forecast 2025-2030 ($ million)
Data Table on South Korea - Market size and forecast 2025-2030 ($ million)
Chart on South Korea - Year-over-year growth 2025-2030 (%)
Data Table on South Korea - Year-over-year growth 2025-2030 (%)

13.4.5 Australia - Market size and forecast 2025-2030

Chart on Australia - Market size and forecast 2025-2030 ($ million)
Data Table on Australia - Market size and forecast 2025-2030 ($ million)
Chart on Australia - Year-over-year growth 2025-2030 (%)
Data Table on Australia - Year-over-year growth 2025-2030 (%)

13.4.6 Indonesia - Market size and forecast 2025-2030

Chart on Indonesia - Market size and forecast 2025-2030 ($ million)
Data Table on Indonesia - Market size and forecast 2025-2030 ($ million)
Chart on Indonesia - Year-over-year growth 2025-2030 (%)
Data Table on Indonesia - Year-over-year growth 2025-2030 (%)

13.5 Europe - Market size and forecast 2025-2030

Chart on Europe - Market size and forecast 2025-2030 ($ million)
Data Table on Europe - Market size and forecast 2025-2030 ($ million)
Chart on Europe - Year-over-year growth 2025-2030 (%)
Data Table on Europe - Year-over-year growth 2025-2030 (%)
Chart on Regional Comparison - Europe
Data Table on Regional Comparison - Europe

13.5.1 Germany - Market size and forecast 2025-2030

Chart on Germany - Market size and forecast 2025-2030 ($ million)
Data Table on Germany - Market size and forecast 2025-2030 ($ million)
Chart on Germany - Year-over-year growth 2025-2030 (%)
Data Table on Germany - Year-over-year growth 2025-2030 (%)

13.5.2 UK - Market size and forecast 2025-2030

Chart on UK - Market size and forecast 2025-2030 ($ million)
Data Table on UK - Market size and forecast 2025-2030 ($ million)
Chart on UK - Year-over-year growth 2025-2030 (%)
Data Table on UK - Year-over-year growth 2025-2030 (%)

13.5.3 France - Market size and forecast 2025-2030

Chart on France - Market size and forecast 2025-2030 ($ million)
Data Table on France - Market size and forecast 2025-2030 ($ million)
Chart on France - Year-over-year growth 2025-2030 (%)
Data Table on France - Year-over-year growth 2025-2030 (%)

13.5.4 Italy - Market size and forecast 2025-2030

Chart on Italy - Market size and forecast 2025-2030 ($ million)
Data Table on Italy - Market size and forecast 2025-2030 ($ million)
Chart on Italy - Year-over-year growth 2025-2030 (%)
Data Table on Italy - Year-over-year growth 2025-2030 (%)

13.5.5 Spain - Market size and forecast 2025-2030

Chart on Spain - Market size and forecast 2025-2030 ($ million)
Data Table on Spain - Market size and forecast 2025-2030 ($ million)
Chart on Spain - Year-over-year growth 2025-2030 (%)
Data Table on Spain - Year-over-year growth 2025-2030 (%)

13.5.6 The Netherlands - Market size and forecast 2025-2030

Chart on The Netherlands - Market size and forecast 2025-2030 ($ million)
Data Table on The Netherlands - Market size and forecast 2025-2030 ($ million)
Chart on The Netherlands - Year-over-year growth 2025-2030 (%)
Data Table on The Netherlands - Year-over-year growth 2025-2030 (%)

13.6 Middle East and Africa - Market size and forecast 2025-2030

Chart on Middle East and Africa - Market size and forecast 2025-2030 ($ million)
Data Table on Middle East and Africa - Market size and forecast 2025-2030 ($ million)
Chart on Middle East and Africa - Year-over-year growth 2025-2030 (%)
Data Table on Middle East and Africa - Year-over-year growth 2025-2030 (%)
Chart on Regional Comparison - Middle East and Africa
Data Table on Regional Comparison - Middle East and Africa

13.6.1 Saudi Arabia - Market size and forecast 2025-2030

Chart on Saudi Arabia - Market size and forecast 2025-2030 ($ million)
Data Table on Saudi Arabia - Market size and forecast 2025-2030 ($ million)
Chart on Saudi Arabia - Year-over-year growth 2025-2030 (%)
Data Table on Saudi Arabia - Year-over-year growth 2025-2030 (%)

13.6.2 UAE - Market size and forecast 2025-2030

Chart on UAE - Market size and forecast 2025-2030 ($ million)
Data Table on UAE - Market size and forecast 2025-2030 ($ million)
Chart on UAE - Year-over-year growth 2025-2030 (%)
Data Table on UAE - Year-over-year growth 2025-2030 (%)

13.6.3 South Africa - Market size and forecast 2025-2030

Chart on South Africa - Market size and forecast 2025-2030 ($ million)
Data Table on South Africa - Market size and forecast 2025-2030 ($ million)
Chart on South Africa - Year-over-year growth 2025-2030 (%)
Data Table on South Africa - Year-over-year growth 2025-2030 (%)

13.6.4 Turkey - Market size and forecast 2025-2030

Chart on Turkey - Market size and forecast 2025-2030 ($ million)
Data Table on Turkey - Market size and forecast 2025-2030 ($ million)
Chart on Turkey - Year-over-year growth 2025-2030 (%)
Data Table on Turkey - Year-over-year growth 2025-2030 (%)

13.6.5 Israel - Market size and forecast 2025-2030

Chart on Israel - Market size and forecast 2025-2030 ($ million)
Data Table on Israel - Market size and forecast 2025-2030 ($ million)
Chart on Israel - Year-over-year growth 2025-2030 (%)
Data Table on Israel - Year-over-year growth 2025-2030 (%)

13.7 South America - Market size and forecast 2025-2030

Chart on South America - Market size and forecast 2025-2030 ($ million)
Data Table on South America - Market size and forecast 2025-2030 ($ million)
Chart on South America - Year-over-year growth 2025-2030 (%)
Data Table on South America - Year-over-year growth 2025-2030 (%)
Chart on Regional Comparison - South America
Data Table on Regional Comparison - South America

13.7.1 Brazil - Market size and forecast 2025-2030

Chart on Brazil - Market size and forecast 2025-2030 ($ million)
Data Table on Brazil - Market size and forecast 2025-2030 ($ million)
Chart on Brazil - Year-over-year growth 2025-2030 (%)
Data Table on Brazil - Year-over-year growth 2025-2030 (%)

13.7.2 Argentina - Market size and forecast 2025-2030

Chart on Argentina - Market size and forecast 2025-2030 ($ million)
Data Table on Argentina - Market size and forecast 2025-2030 ($ million)
Chart on Argentina - Year-over-year growth 2025-2030 (%)
Data Table on Argentina - Year-over-year growth 2025-2030 (%)

13.7.3 Chile - Market size and forecast 2025-2030

Chart on Chile - Market size and forecast 2025-2030 ($ million)
Data Table on Chile - Market size and forecast 2025-2030 ($ million)
Chart on Chile - Year-over-year growth 2025-2030 (%)
Data Table on Chile - Year-over-year growth 2025-2030 (%)

13.8 Market opportunity by geography

Market opportunity by geography ($ million)
Data Tables on Market opportunity by geography ($ million)

14. Drivers, Challenges, and Opportunity

14.1 Market drivers

Massive global investments in grid modernization and distributed renewable energy integration
Rapid proliferation of automated industrial manufacturing assets and high density data center infrastructure
Heightened corporate focus on workplace safety standards and comprehensive arc flash mitigation plans

14.2 Market challenges

Severe supply chain bottlenecks and volatile component pricing disruptions across smelting corridors
Complex integration overheads associated with digitized smart grid framework interoperability standards
Rising multi jurisdictional regulatory compliance mandates and rigorous field certification delays

14.3 Impact of drivers and challenges

Impact of drivers and challenges in 2025 and 2030

14.4 Market opportunities

Widespread industrial integration of artificial intelligence workplace monitoring and computer vision scanning
Rapid technical shift toward continuous predictive thermal monitoring via internet of things sensors
Strategic market consolidation through focused high value corporate mergers and technical platform integration

15. Competitive Landscape

15.1 Overview

15.2

Overview on criticality of inputs and factors of differentiation

15.3 Landscape disruption

Overview on factors of disruption

15.4 Industry risks

Impact of key risks on business

16. Competitive Analysis

16.1 Companies profiled

Companies covered

16.2 Company ranking index

16.3 Market positioning of companies

Matrix on companies position and classification

16.4 3M Co.

3M Co. - Overview
3M Co. - Business segments
3M Co. - Key news
3M Co. - Key offerings
3M Co. - Segment focus
SWOT

16.5 Ansell Ltd.

Ansell Ltd. - Overview
Ansell Ltd. - Business segments
Ansell Ltd. - Key offerings
Ansell Ltd. - Segment focus
SWOT

16.6 Boddingtons Electrical Ltd

Boddingtons Electrical Ltd - Overview
Boddingtons Electrical Ltd - Product / Service
Boddingtons Electrical Ltd - Key offerings
SWOT

16.7 Delta Plus Group SA

Delta Plus Group SA - Overview
Delta Plus Group SA - Product / Service
Delta Plus Group SA - Key offerings
SWOT

16.8 Enespro PPE LLC

Enespro PPE LLC - Overview
Enespro PPE LLC - Product / Service
Enespro PPE LLC - Key offerings
SWOT

16.9 Groupe Sicame

Groupe Sicame - Overview
Groupe Sicame - Product / Service
Groupe Sicame - Key offerings
SWOT

16.10 Honeywell International Inc.

Honeywell International Inc. - Overview
Honeywell International Inc. - Business segments
Honeywell International Inc. - Key news
Honeywell International Inc. - Key offerings
Honeywell International Inc. - Segment focus
SWOT

16.11 Hubbell Inc.

Hubbell Inc. - Overview
Hubbell Inc. - Business segments
Hubbell Inc. - Key offerings
Hubbell Inc. - Segment focus
SWOT

16.12 Lakeland Industries Inc.

Lakeland Industries Inc. - Overview
Lakeland Industries Inc. - Business segments
Lakeland Industries Inc. - Key offerings
Lakeland Industries Inc. - Segment focus
SWOT

16.13 MSA Safety Inc.

MSA Safety Inc. - Overview
MSA Safety Inc. - Business segments
MSA Safety Inc. - Key offerings
MSA Safety Inc. - Segment focus
SWOT

16.14 National Safety Apparel Inc.

National Safety Apparel Inc. - Overview
National Safety Apparel Inc. - Product / Service
National Safety Apparel Inc. - Key offerings
SWOT

16.15 Paulson Manufacturing Corp.

Paulson Manufacturing Corp. - Overview
Paulson Manufacturing Corp. - Product / Service
Paulson Manufacturing Corp. - Key offerings
SWOT

16.16 Sofamel SL

Sofamel SL - Overview
Sofamel SL - Product / Service
Sofamel SL - Key offerings
SWOT

16.17 UVEX GmbH and Co. KG

UVEX GmbH and Co. KG - Overview
UVEX GmbH and Co. KG - Product / Service
UVEX GmbH and Co. KG - Key offerings
SWOT

16.18 Workwear Outfitters LLC

Workwear Outfitters LLC - Overview
Workwear Outfitters LLC - Product / Service
Workwear Outfitters LLC - Key offerings
SWOT

17. Appendix

17.1 Scope of the report

Market definition
Objectives
Notes and caveats

17.2 Inclusions and exclusions checklist

Inclusions checklist
Exclusions checklist

17.3 Currency conversion rates for US$

17.4 Research methodology

17.5 Data procurement

Information sources

17.6 Data validation

17.7 Validation techniques employed for market sizing

17.8 Data synthesis

17.9 360 degree market analysis

17.10 List of abbreviations

Research Methodology

Technavio presents a detailed picture of the market by way of study, synthesis, and summation of data from multiple sources. The analysts have presented the various facets of the market with a particular focus on identifying the key industry influencers. The data thus presented is comprehensive, reliable, and the result of extensive research, both primary and secondary.

INFORMATION SOURCES

Primary sources

  • Manufacturers and suppliers
  • Channel partners
  • Industry experts
  • Strategic decision makers

Secondary sources

  • Industry journals and periodicals
  • Government data
  • Financial reports of key industry players
  • Historical data
  • Press releases

DATA ANALYSIS

Data Synthesis

  • Collation of data
  • Estimation of key figures
  • Analysis of derived insights

Data Validation

  • Triangulation with data models
  • Reference against proprietary databases
  • Corroboration with industry experts

REPORT WRITING

Qualitative

  • Market drivers
  • Market challenges
  • Market trends
  • Five forces analysis

Quantitative

  • Market size and forecast
  • Market segmentation
  • Geographical insights
  • Competitive landscape

Interested in this report?

Get your sample now to see our research methodology and insights!

Download Now

Frequently Asked Questions

Electrical Protective Equipment market growth will increase by USD 914.9 million during 2026-2030.

The Electrical Protective Equipment market is expected to grow at a CAGR of 3.9% during 2026-2030.

Electrical Protective Equipment market is segmented by End-user (Manufacturing, Construction, Automotive, Oil and gas, Others) Product (PC, HAPM, HEFPM, FLP) Distribution channel (Offline, Online) Material (Rubber, Plastic, Fabric, Leather, Metal)

3M Co., Ansell Ltd., Boddingtons Electrical Ltd, Cementex Products Inc, Delta Plus Group SA, Enespro PPE LLC, Groupe Sicame, Honeywell International Inc., Hubbell Inc., Lakeland Industries Inc., Magid Glove and Safety Co, MSA Safety Inc., National Safety Apparel Inc., Oberon, Paulson Manufacturing Corp., Saf T Gard International Inc., Sofamel SL, UVEX GmbH and Co. KG, Workwear Outfitters LLC are a few of the key vendors in the Electrical Protective Equipment market.

North America will register the highest growth rate of 38.8% among the other regions. Therefore, the Electrical Protective Equipment market in North America is expected to garner significant business opportunities for the vendors during the forecast period.

US, Canada, Mexico, China, Japan, India, South Korea, Australia, Indonesia, Germany, UK, France, Italy, Spain, The Netherlands, Saudi Arabia, UAE, South Africa, Turkey, Israel, Brazil, Argentina, Chile

  • Massive global investments in grid modernization and distributed renewable energy integration is the driving factor this market.

The Electrical Protective Equipment market vendors should focus on grabbing business opportunities from the End-user segment as it accounted for the largest market share in the base year.
RIA - Research AI Assistant
Ask RIA
