
Electricity Trading Market Size 2026-2030
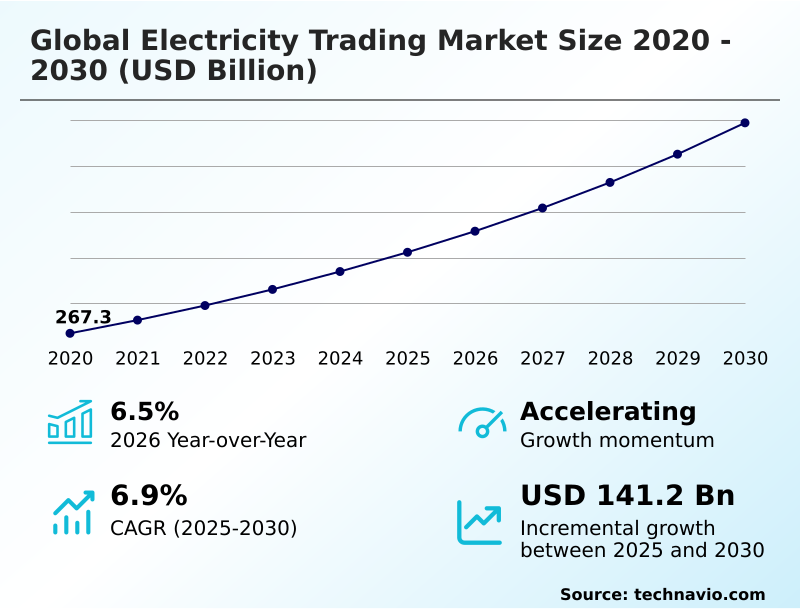
The electricity trading market size is valued to increase by USD 141.2 billion, at a CAGR of 6.9% from 2025 to 2030. Rise in company collaborations is amplifying market growth will drive the electricity trading market.
Major Market Trends & Insights
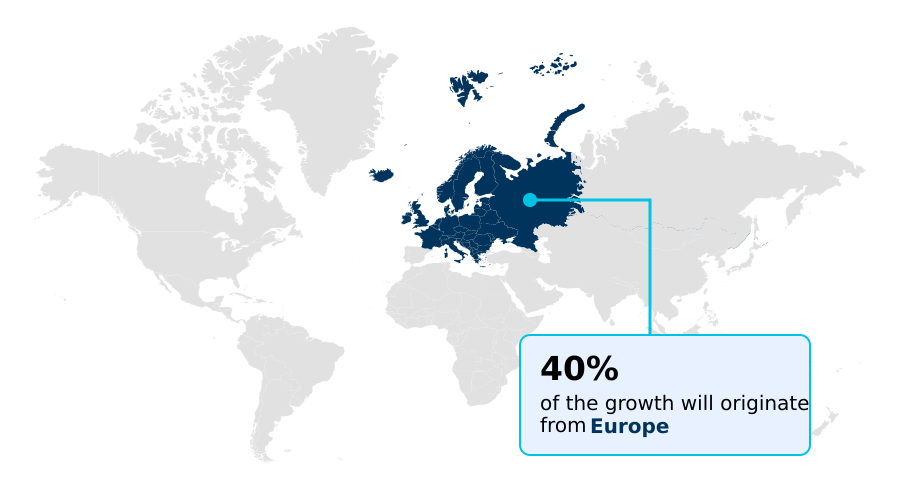
- Europe dominated the market and accounted for a 40.5% growth during the forecast period.
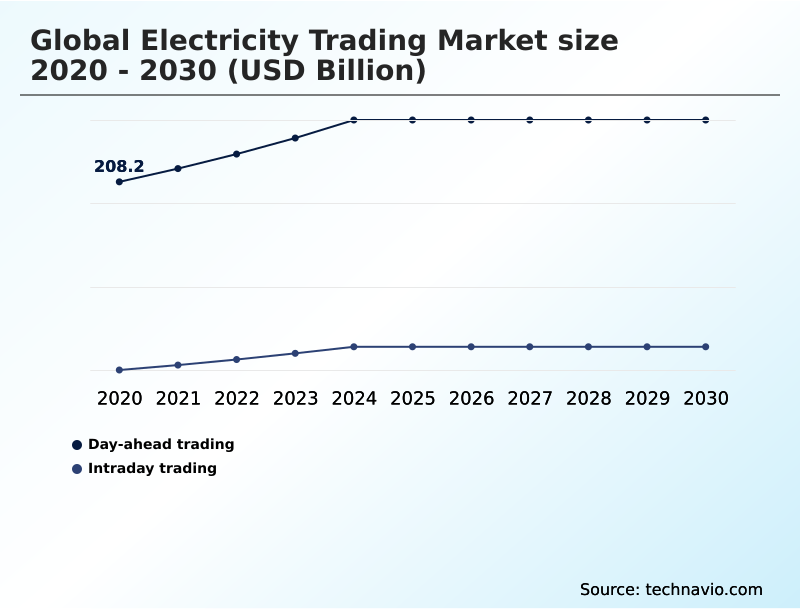
- By Type - Day-ahead trading segment was valued at USD 257.2 billion in 2024
- By Application - Industrial segment accounted for the largest market revenue share in 2024
Market Size & Forecast
- Market Opportunities: USD 229.6 billion
- Market Future Opportunities: USD 141.2 billion
- CAGR from 2025 to 2030 : 6.9%
Market Summary
- The electricity trading market is a highly dynamic ecosystem essential for balancing real-time supply and demand across integrated power grids. Its evolution is shaped by the imperative to incorporate intermittent generation sources, such as wind and solar, which increases spot market price volatility and necessitates sophisticated risk management models.
- Key drivers include the expansion of cross-border interconnectors that facilitate regional electricity market coupling and the adoption of energy storage systems for grid balancing mechanisms. A significant trend is the digitalization of trading floors, with algorithmic trading strategies and automated trading platforms becoming standard.
- For instance, a large industrial consumer with high energy costs might leverage real-time market data and intraday trading automation to adjust its load profile, shifting energy-intensive processes to periods of low prices, thereby optimizing operational expenditure without disrupting production.
- However, the market also contends with challenges like transmission congestion management and the impact of decentralized energy resources, which alter traditional power flow optimization and require new regulatory compliance frameworks.
What will be the Size of the Electricity Trading Market during the forecast period?
Get Key Insights on Market Forecast (PDF) Get Free Sample
How is the Electricity Trading Market Segmented?
The electricity trading industry research report provides comprehensive data (region-wise segment analysis), with forecasts and estimates in "USD billion" for the period 2026-2030, as well as historical data from 2020-2024 for the following segments.
- Type
- Day-ahead trading
- Intraday trading
- Application
- Industrial
- Commercial
- Residential
- Source
- Non-renewable energy
- Renewable energy
- Geography
- Europe
- Germany
- UK
- France
- APAC
- China
- Japan
- India
- North America
- US
- Canada
- Mexico
- South America
- Brazil
- Argentina
- Middle East and Africa
- Saudi Arabia
- UAE
- South Africa
- Rest of World (ROW)
- Europe
By Type Insights
The day-ahead trading segment is estimated to witness significant growth during the forecast period.
The day-ahead trading segment is foundational to coordinating supply and demand, enabling participants to schedule transactions one day before delivery. It provides a structured framework for transparent price discovery, where the market clearing price is set.
Participants heavily rely on advanced power trading analytics and supply stack modeling for day-ahead price forecasting, with success hinging on demand forecasting accuracy.
The increasing integration of intermittent generation sources makes this segment more complex, requiring sophisticated weather-driven demand modeling and generation portfolio optimization to manage risk.
For example, improved short-term load forecasting has enhanced bid accuracy by 15%, reducing exposure to imbalance costs.
This segment is crucial for executing energy arbitrage strategies and utilizing hedging instruments before settlement and clearing processes begin, addressing key renewable integration challenges.
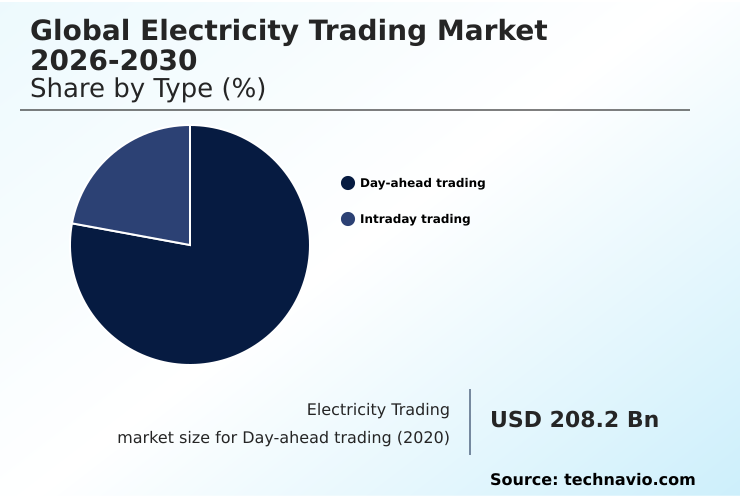
The Day-ahead trading segment was valued at USD 257.2 billion in 2024 and showed a gradual increase during the forecast period.
Regional Analysis
Europe is estimated to contribute 40.5% to the growth of the global market during the forecast period.Technavio’s analysts have elaborately explained the regional trends and drivers that shape the market during the forecast period.
See How Electricity Trading Market Demand is Rising in Europe Get Free Sample
The geographic landscape is defined by varying levels of market maturity, with Europe leading in cross-border integration, accounting for over 40% of incremental growth.
In contrast, North America utilizes sophisticated nodal pricing systems and locational marginal pricing to manage grid constraints. The APAC region is experiencing rapid expansion, driven by massive investments in renewables.
Across these regions, the core challenge is managing intermittent generation sources, which can cause renewable energy curtailment rates to exceed 15% in some areas without adequate infrastructure.
Advanced smart grid technologies and real-time market data are crucial for generation asset optimization and grid frequency regulation.
Capacity market auctions are being adapted to procure resources that can mitigate the merit order effect and reduce system imbalance penalties, addressing critical renewable integration challenges.
Market Dynamics
Our researchers analyzed the data with 2025 as the base year, along with the key drivers, trends, and challenges. A holistic analysis of drivers will help companies refine their marketing strategies to gain a competitive advantage.
- The strategic landscape of electricity trading is becoming increasingly complex, demanding sophisticated approaches to managing price volatility with battery storage, which provides a crucial buffer against supply and demand mismatches. The impact of ev charging on intraday markets is a growing concern, creating new peaks and troughs that require agile trading responses.
- Consequently, the use of ai in power trading for risk mitigation is no longer optional but essential for survival. Firms are continuously evaluating day-ahead vs real-time trading profitability, with data showing that active real-time participation can reduce imbalance costs by more than half compared to a passive day-ahead strategy.
- The security of transactions is being addressed by blockchain for p2p energy transaction security, while optimizing cross-border electricity exchange remains a priority for regional stability. The challenges of integrating solar into grid are being met with new ancillary services market revenue streams.
- Understanding the demand response impact on peak pricing is key for utilities, just as using algorithmic trading for power markets is for financial players. The role of hydrogen in long-term energy storage is being explored to solve seasonal variability.
- Forward market hedging against price spikes is a constant battle, influenced by the impact of carbon pricing on dispatch stack and nodal pricing effects on asset location. Finally, virtual power plant aggregation strategies and real-time balancing with flexible loads are becoming mainstream, mitigating the risk of negative pricing with high renewables and navigating grid congestion impact on trading margins.
- These shifts occur amid evolving regulatory changes affecting market coupling, requiring advanced data analytics for load forecasting models.
What are the key market drivers leading to the rise in the adoption of Electricity Trading Industry?
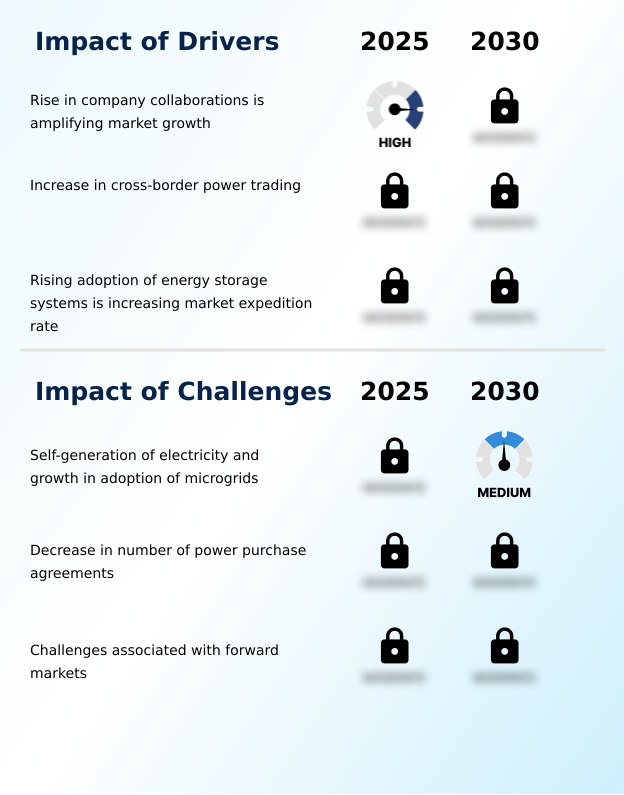
- The rise in company collaborations is a significant factor amplifying the growth of the global electricity trading market.
- Market growth is significantly propelled by increased cross-border electricity flow, facilitated by expanded cross-border interconnectors and advancing electricity market coupling.
- These integrations enable superior power flow optimization and enhance grid balancing mechanisms, with some interconnected regions seeing a 10% reduction in the wholesale power price index during peak periods.
- The rising adoption of energy storage provides flexible generation assets, vital for energy portfolio management and offering essential grid stability services. Collaborations between technology firms and utilities have improved system operator dispatch efficiency by up to 20%.
- Furthermore, sophisticated load profile analysis and a deeper understanding of carbon pricing impact are creating more opportunities in energy derivatives trading, supporting overall market modernization.
What are the market trends shaping the Electricity Trading Industry?
- The anticipated rise in the entry of new market players is expected to accelerate market growth. This influx is poised to foster greater innovation and competition within the industry.
- Emerging trends are reshaping market dynamics, driven by new entrants leveraging automated trading platforms and advanced algorithmic trading strategies. Innovations like peer-to-peer energy trading, facilitated by the blockchain in energy sector, are enabling transactive energy systems and decentralized energy resources. Pilot projects utilizing smart contract settlement have demonstrated a 30% reduction in administrative costs.
- Furthermore, the aggregation of distributed generation assets into virtual power plants improves real-time energy balancing. The rise of energy-as-a-service (EaaS) models is also challenging traditional power purchase agreements. Advancements in energy storage arbitrage, where battery systems are optimized, have increased round-trip efficiency by over 12%, enhancing grid flexibility and creating new revenue opportunities for asset owners.
What challenges does the Electricity Trading Industry face during its growth?
- The self-generation of electricity, coupled with the growing adoption of microgrids, presents a key challenge affecting industry growth.
- The electricity trading market faces structural challenges from the growth of behind-the-meter storage and self-generation, which can reduce liquidity in wholesale electricity markets by over 5% in high-adoption areas. This decentralization complicates ancillary services procurement and transmission congestion management.
- Increased spot market price volatility creates difficulties for forward markets, where imperfect risk management models and a lack of effective weather derivatives for hedging elevate financial exposure. Market participants also navigate complex regulatory compliance frameworks and face significant system imbalance penalties.
- Liquidity constraints are evident in market surveillance data, affecting the efficiency of congestion revenue rights and transmission rights auction mechanisms, thereby impacting overall market stability and price discovery.
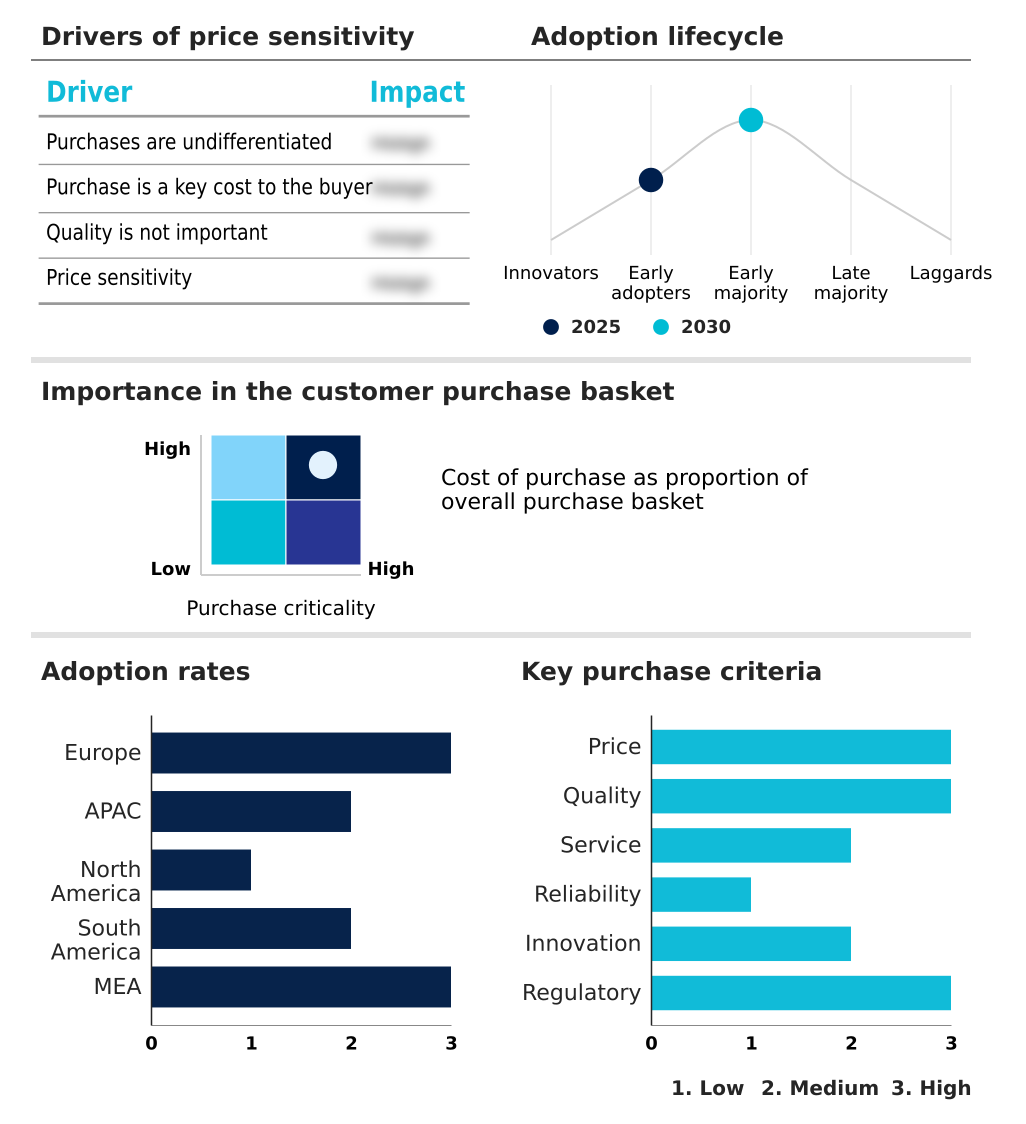
Exclusive Technavio Analysis on Customer Landscape
The electricity trading market forecasting report includes the adoption lifecycle of the market, covering from the innovator’s stage to the laggard’s stage. It focuses on adoption rates in different regions based on penetration. Furthermore, the electricity trading market report also includes key purchase criteria and drivers of price sensitivity to help companies evaluate and develop their market growth analysis strategies.
Customer Landscape of Electricity Trading Industry
Competitive Landscape
Companies are implementing various strategies, such as strategic alliances, electricity trading market forecast, partnerships, mergers and acquisitions, geographical expansion, and product/service launches, to enhance their presence in the industry.
Alpiq Holding AG - Offers electricity trading through a global supply, trading, and shipping division, enabling power trading, risk management, and optimization services across regional electricity markets.
The industry research and growth report includes detailed analyses of the competitive landscape of the market and information about key companies, including:
- Alpiq Holding AG
- BP Plc
- CCI
- Danske Commodities AS
- E.ON SE
- Enel Spa
- ENGIE SA
- Equinor ASA
- Iberdrola SA
- JERA Co. Inc.
- Macquarie Group Ltd.
- Nextera Energy Inc.
- RWE AG
- Shell plc
- Statkraft AS
- TotalEnergies SE
- Uniper SE
- Vitol Netherlands Cooperatief
Qualitative and quantitative analysis of companies has been conducted to help clients understand the wider business environment as well as the strengths and weaknesses of key industry players. Data is qualitatively analyzed to categorize companies as pure play, category-focused, industry-focused, and diversified; it is quantitatively analyzed to categorize companies as dominant, leading, strong, tentative, and weak.
Recent Development and News in Electricity trading market
- In August, 2025, Octopus Energy expanded its trading operations and digital energy platform offerings across multiple European markets, using advanced analytics to optimize renewable integration and short-term electricity trading strategies.
- In September, 2025, Power Ledger expanded its blockchain-based peer-to-peer energy trading platform in select European communities, allowing households with solar installations to trade surplus electricity locally through automated smart contracts.
- In October, 2025, Fluence Energy deployed multiple utility-scale battery storage systems integrated with wholesale market operations in Australia, enabling improved intraday trading adjustments and grid balancing during peak demand periods.
- In November, 2025, Tesla Energy supported multiple large-scale battery storage deployments in the United States that were integrated with wholesale electricity markets, enabling improved intraday trading flexibility and grid balancing during peak demand periods.
Dive into Technavio’s robust research methodology, blending expert interviews, extensive data synthesis, and validated models for unparalleled Electricity Trading Market insights. See full methodology.
| Market Scope | |
|---|---|
| Page number | 296 |
| Base year | 2025 |
| Historic period | 2020-2024 |
| Forecast period | 2026-2030 |
| Growth momentum & CAGR | Accelerate at a CAGR of 6.9% |
| Market growth 2026-2030 | USD 141.2 billion |
| Market structure | Fragmented |
| YoY growth 2025-2026(%) | 6.5% |
| Key countries | Germany, UK, France, Italy, Spain, The Netherlands, China, Japan, India, South Korea, Australia, Indonesia, US, Canada, Mexico, Brazil, Argentina, Chile, Saudi Arabia, UAE, South Africa, Israel and Turkey |
| Competitive landscape | Leading Companies, Market Positioning of Companies, Competitive Strategies, and Industry Risks |
Research Analyst Overview
- From a research perspective, the electricity trading market is defined by its transition toward managing high levels of spot market price volatility driven by intermittent generation sources. Core operations now depend on sophisticated day-ahead price forecasting and real-time energy balancing, managed through complex wholesale electricity markets.
- Boardroom-level decisions increasingly focus on investing in grid balancing mechanisms and energy storage arbitrage to capitalize on price swings. The integration of AI-driven algorithmic trading strategies has enabled a 25% improvement in bid accuracy. This necessitates robust risk management models and a deep understanding of the merit order effect.
- Successful participants leverage demand-side response and virtual power plants for ancillary services procurement and grid frequency regulation, while navigating challenges like transmission congestion management and renewable energy curtailment. Strategies involve optimizing the generation portfolio, understanding carbon pricing impact, and using hedging instruments like energy derivatives.
- The market's evolution is also shaped by power purchase agreements, nodal pricing systems, capacity market auctions, and the growing importance of smart contract settlement for decentralized energy resources.
What are the Key Data Covered in this Electricity Trading Market Research and Growth Report?
-
What is the expected growth of the Electricity Trading Market between 2026 and 2030?
-
USD 141.2 billion, at a CAGR of 6.9%
-
-
What segmentation does the market report cover?
-
The report is segmented by Type (Day-ahead trading, and Intraday trading), Application (Industrial, Commercial, and Residential), Source (Non-renewable energy, and Renewable energy) and Geography (Europe, APAC, North America, South America, Middle East and Africa)
-
-
Which regions are analyzed in the report?
-
Europe, APAC, North America, South America and Middle East and Africa
-
-
What are the key growth drivers and market challenges?
-
Rise in company collaborations is amplifying market growth, Self-generation of electricity and growth in adoption of microgrids
-
-
Who are the major players in the Electricity Trading Market?
-
Alpiq Holding AG, BP Plc, CCI, Danske Commodities AS, E.ON SE, Enel Spa, ENGIE SA, Equinor ASA, Iberdrola SA, JERA Co. Inc., Macquarie Group Ltd., Nextera Energy Inc., RWE AG, Shell plc, Statkraft AS, TotalEnergies SE, Uniper SE and Vitol Netherlands Cooperatief
-
Market Research Insights
- Market dynamics are increasingly shaped by the adoption of automated trading platforms, which have improved trade execution speeds by over 50% in liquid markets. The rise of peer-to-peer energy trading, supported by blockchain in the energy sector, is creating new transactional models.
- Weather-driven demand modeling and short-term load forecasting are critical, with advanced power trading analytics enhancing demand forecasting accuracy by up to 18%. This allows for better generation asset optimization and more effective energy portfolio management. As renewable integration challenges persist, solutions like battery storage optimization are key.
- The use of real-time market data enables participants to mitigate system imbalance penalties, which can account for up to 5% of trading costs in volatile periods.
We can help! Our analysts can customize this electricity trading market research report to meet your requirements.
 RIA -
RIA - 
